 🏗️ New Construction
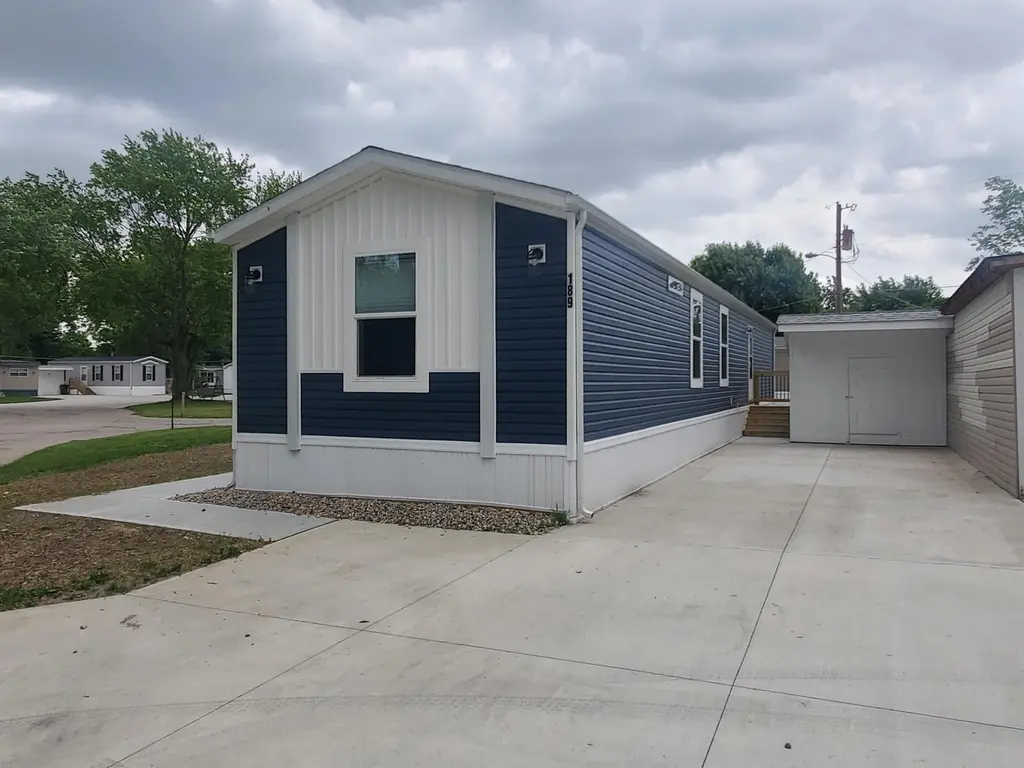
Clayton Redbud Estates Plan · Anderson, IN
Flood risk No data
- FEMA flood zone
- —
- Chance of flooding over 30 yrs
- —
- Est. flood insurance / yr
- —
Fire risk No data
- Est. fire insurance / yr
- —
Heat risk No data
- Hot days now (above threshold)
- —
- Hot days in 30 yrs
- —
Wind risk No data
- Chance of severe wind over 30 yrs
- —
Air-quality risk No data
- Unhealthy air days now
- —
- Unhealthy air days in 30 yrs
- —
Risk factors via First Street. Map © Google.
Why this score? — see what drove the B- grade
The composite is a weighted blend of 9 inputs, each scored 0–100. Each bar is that input's sub-score; the figure is the points it added to the 100-point composite (weight × sub-score).
- Cash flow +30.0/30.0
- DSCR +10.0/10.0
- 1% rule +8.8/10.0
- ARV discount +7.5/15.0
- Condition / age +4.0/5.0
- Livability +3.0/5.0
- Rent growth +2.5/5.0
- Schools +1.6/10.0
- Appreciation +0.0/10.0
$77,000
🖨 Deal sheet 📄 Offer letter ✓ Due diligence
Listing remarks MLS
Come tour this beautiful home! This 2 bedroom, 2 bathroom home features stainless steel kitchen appliances, shower-tub combo, and an Amish Built CARPORT! Call the office to schedule your tour today!
Key facts
- Amish built carport
- Listed 298 days
Tags
Neighborhood map
What this means for you Summary
Snapshot
- This is a 2-bed/2.0-bath manufactured listed at $77k. Condition is rated good.
Deal economics
- At list price, monthly cash flow is $305 ($4k/yr) — positive.
- The deal already cash-flows at list — no discount required.
- Meets the 1% rule at list price ($1k rent vs $77k).
- Recommended offer: $68k (12.0% below list) — sets the bar for market timing.
- Cap rate 11.0% vs local median 6.5% in Anderson — top-decile yield for the area; either an underpriced asset or a hidden risk that comps aren't pricing in. Stress-test before assuming the spread holds.
Location & tenants
- Location reads 60/100 on livability (#521 in IN) — a middle-class / working-renter tenant base. Strengths: cost of living A+, housing A+; Watch: schools F, crime D-, amenities F.
- Anderson Community School Corporation (urban): math 15% / reading 23% proficiency, ranked #280 of 301 in IN (top 93%) — low school quality limits family demand, transient renter base, plan for 1-2y turnover; 70% free/reduced lunch — lower-income household profile, screen leases tightly.
- Market conditions: 150 active listings in the ZIP; 19 comparable units currently listed for rent nearby; rentals at typical pace (median 24d on market — plan ~3-4 weeks tenant-placement turnaround); 42% of comp listings sitting > 30 days — soft ceiling on asking rent; 184 units permitted in Madison County in 2024 (0 in 5+ unit buildings).
Forward outlook
- Local home prices are declining (-3.0%/yr); year-one equity from $532 of loan paydown is wiped out by about $2k of value loss. Plan a longer hold.
- Madison County population projected at -14% by 2050 — secular population decline; favor cash flow + early exit over multi-decade hold.
- At projected returns (-3.0% appreciation + 3.0% rent growth), your $22k cash investment doubles in ~8 years — after that, you're playing with house money.
Negotiation context
- It's been on market 298 days — a 12% lower offer ($68k) is reasonable based on typical stale-listing flexibility.
Questions for the listing agent
- It's been on market 298 days. Have you received any prior offers? Is the seller open to a 12% concession, seller financing, or rate buy-down credit?
- Why hasn't it sold? Are there any deal-killer items the seller is aware of (foundation, flood, title, zoning, code violations)?
- Is there a deadline driving the sale (1031 exchange, divorce, estate, relocation)? That informs how much negotiation room exists.
- Schools are F-rated, which usually means shorter tenancies and higher turnover. Who's the typical renter profile here, and what's been the actual vacancy rate?
- Crime grade is D in this area — have there been break-ins, vandalism, or insurance claims at this property in the last 3 years? What carrier currently insures it and at what premium?
- What's the average days-on-market for RENTAL listings here right now (not sales)? A rising rental-DOM trend means longer vacancies and softer asking-rent achievability than the comps imply.
- What's the recent tenant-quality profile in this submarket — average credit score on applications, eviction rate, late-payment / NSF rate, and stable-employment percentage? A property-management company in the area should have these aggregated.
- How much new for-sale + rental construction is in the pipeline within 1–3 miles? Heavy new supply typically softens prices + rents 12–24 months out; constrained supply supports both.
Investment metrics
- 1% rule
- 1.38% ✓
- Cap rate
- 11.04%
- Cash-on-cash
- 16.96%
- DSCR
- 1.75
- GRM
- 6.1
CMA / ARV
No comps found within radius.
Projected returns pro-forma
-3.0% appreciation · 3.0% rent growth · sell at horizon
- IRR
- 8.2%
- Equity multiple
- 1.32×
- Total profit
- $6,946
- Equity at exit
- $11,481
- IRR
- 17.5%
- Equity multiple
- 2.44×
- Total profit
- $31,104
- Equity at exit
- $6,658
Cash invested: $21,560 (down + closing). Projections, not guarantees.
Landlord ↔ Tenant lean methodology
- Overall (STATE)
- 90 Strongly Landlord-Friendly
- State Indiana
- 90 Strongly Landlord-Friendly · R+11
- County
- — inherits STATE
- City
- — inherits STATE
ZIP-level market 46013
- Home prices YoY
- -26.9%
- Active inventory
- 150
- Price-to-rent
- 6.1×
Monthly cashflow live
- Estimated rent
- $1,059 high interval (Pro) →
- Mortgage (P&I)
- −$404
- Tax est. 1.5%
- −$96 /mo · $1,155/yr
- Insurance
- −$32
- HOA
- −$0
- Vacancy / Maint / Mgmt
- −$222
- Net cashflow
- $305
Break-even live
UW: 25.0% down · 7.5% · 30yr · 1.5% tax · 5.0% vac · 8.0% maint · 8.0% mgmt
Financing live
Cash to close
- Down payment
- $19,250
- Closing costs
- $2,310
- Reserves months
- —
- Total cash needed
- —
Loan-product check · same deal, 3 products live
Conventional
25% down · 7.5% · 30yr
- Down + closing
- —
- Monthly P&I
- —
- Monthly cashflow
- —
- DSCR
- —
- Eligible?
- —
Personal DTI + credit; lowest rate.
DSCR
20% down · 8.5% · 30yr
- Down + closing
- —
- Monthly P&I
- —
- Monthly cashflow
- —
- DSCR
- —
- Eligible?
- —
No personal income docs; deal must DSCR.
Hard money
10% down · 12.0% · 12mo
- Down + closing
- —
- Monthly P&I
- —
- Monthly cashflow
- —
- DSCR
- —
- Eligible?
- —
Short-term bridge; refi at stabilization.
Rent comps 19 comps
| Address | Beds | Baths | Sqft | Rent | $/sqft | DOM | Units | Dist |
|---|---|---|---|---|---|---|---|---|
| 4325 S Madison Ave Anderson, IN | 1.0–3.0 | 1.0–1.5 | 995 | $1,112 | $1.12 | 1d | 6 | 0.61mi |
| 3815 Camelot Blvd Anderson, IN | 3.0 | 2.0 | 1456 | $1,179 | $0.81 | 1d | 2 | 0.79mi |
| 2203 W 28th St Anderson, IN | 3.0 | 1.0 | 1068 | $1,000 | $0.94 | 43d | 1 | 0.80mi |
| 2719 Dewey St Anderson, IN | 2.0 | 1.0 | 877 | $1,150 | $1.31 | 43d | 1 | 0.81mi |
| 2613 Louise St Anderson, IN | 2.0 | 1.0 | 1096 | $950 | $0.87 | 21d | 1 | 0.85mi |
| 4021 Brown St Anderson, IN | 2.0 | 1.0 | 1320 | $975 | $0.74 | 7d | 1 | 0.94mi |
| 4015 Haverhill Dr Anderson, IN | 3.0 | 2.0 | 884 | $1,100 | $1.24 | 43d | 1 | 1.06mi |
| 2820 Fairview St Unit A Anderson, IN | 2.0 | 1.0 | 850 | $895 | $1.05 | 43d | 1 | 1.09mi |
| 2904 Lincoln St Anderson, IN | 2.0 | 1.0 | 864 | $900 | $1.04 | 43d | 1 | 1.15mi |
| 2411 Hendricks St Anderson, IN | 3.0 | 1.0 | 860 | $1,000 | $1.16 | 23d | 1 | 1.18mi |
| 3021 Delaware St Anderson, IN | 2.0 | 1.0 | 1154 | $1,150 | $1.00 | 7d | 1 | 1.24mi |
| 2627 Chase St Anderson, IN | 3.0 | 1.0 | 1050 | $850 | $0.81 | 17d | 1 | 1.28mi |
| 2442 Morton St Anderson, IN | 2.0 | 1.0 | 862 | $1,125 | $1.31 | 23d | 1 | 1.31mi |
| 2004 Arrow Ave Anderson, IN | 2.0 | 1.0 | 816 | $1,125 | $1.38 | 23d | 1 | 1.31mi |
| 2301 Sheridan St Anderson, IN | 2.0 | 1.0 | 900 | $950 | $1.06 | 43d | 1 | 1.33mi |
| 2233 Fairview St Anderson, IN | 3.0 | 1.5 | 1452 | $1,195 | $0.82 | 23d | 1 | 1.38mi |
| 618 W 22nd St Anderson, IN | 3.0 | 1.0 | 900 | $1,250 | $1.39 | 43d | 1 | 1.42mi |
| 2324 Chase St Anderson, IN | 2.0 | 1.0 | 783 | $950 | $1.21 | 43d | 1 | 1.47mi |
| 1720 Nelle St Anderson, IN | 2.0 | 1.0 | 768 | $1,100 | $1.43 | 23d | 1 | 1.48mi |
Listing history 14 events
-
2026-06-18days on market $77,000 Active 298 DOM
-
2026-06-17days on market $77,000 Active 297 DOM
-
2026-06-16days on market $77,000 Active 296 DOM
-
2026-06-15days on market $77,000 Active 295 DOM
-
2026-06-13days on market $77,000 Active 293 DOM
-
2026-06-09days on market $77,000 Active 289 DOM
-
2026-06-08days on market $77,000 Active 288 DOM
-
2026-06-07days on market $77,000 Active 287 DOM
-
2026-06-05days on market $77,000 Active 284 DOM
-
2026-06-03days on market $77,000 Active 283 DOM
-
2026-06-02days on market $77,000 Active 282 DOM
-
2026-06-01days on market $77,000 Active 281 DOM
-
2026-05-31days on market $77,000 Active 280 DOM
-
2025-08-25$77,000 Active 198-char remark
Show marketing remark (198 chars)
Come tour this beautiful home! This 2 bedroom, 2 bathroom home features stainless steel kitchen appliances, shower-tub combo, and an Amish Built CARPORT! Call the office to schedule your tour today!
ⓘ Source: listings_history table (triggers on properties + properties_extension) + one-shot
backfill from property_details.listing_events for pre-trigger history.
Nearby sold comps map
Loading sold comps map…
Walkable amenities ~0.75 mi
Loading nearby amenities…
Taxation est. · year 1
- Rental income
- $12,712
- − Mortgage interest
- −$4,313
- − Property taxes
- −$1,155
- − Insurance
- −$385
- − Repairs & maintenance
- −$1,017
- − Management
- −$1,017
- − Depreciation
- −$2,240
- Taxable income
- $2,585
- Est. tax owed @ 24.0%
- −$620
- After-tax cash flow
- $3,036/yr
For passive investors: Depreciation is non-cash, so a rental often shows a tax loss while cash-flowing — sheltering income. Rental losses are passive: they offset passive income freely, and up to $25,000/yr can offset ordinary (W-2) income if you actively participate and your MAGI is under $100k (phasing out to $0 by $150k); unused losses carry forward. On sale, claimed depreciation is recaptured at up to 25%, and gains may owe capital-gains tax (a 1031 exchange can defer both). Figures are a year-1 estimate at your 24.0% rate — not tax advice; consult a CPA.
Condition & rehab AI · 13 photos
This 2-bedroom, 2-bathroom home in Clayton Redbud Estates is in good condition with modern updates and a well-maintained exterior. It's ready for move-in and would benefit from a fresh coat of paint and some landscaping to further enhance its curb appeal and value.
Value-add opportunities
- Both Paint exterior — Enhances curb appeal and resale value
- Both Landscaping — Improves curb appeal and rental value
Renovation cost estimate screening
Value-add ROI direction
- Both Paint exterior — Enhances curb appeal and resale value ↑
- Both Landscaping — Improves curb appeal and rental value ↑
ⓘ Cost ranges are severity-bucket heuristics (US national rule-of-thumb). Get contractor quotes + a written scope before underwriting a rehab budget.
Schools (NCES district)
- District
- Anderson Community School Corporation
- NCES district ID
- 1800150
- Math proficiency
- 15% ▼ -14.00%
- Reading proficiency
- 23% ▼ -7.00%
- Median HH income
- $38,208
- Composite
- 15.93/100
- National rank
- #9250
- State rank
- #280 of 301 in IN
Livability — Anderson
- Score
- 60/100
- State rank
- #521
- US rank
- #18709
Category grades
Schools grade is shown separately in the Schools card above.
Census & demographics
- Census place
- Anderson, IN
- County
- Madison County · 69,445 people
- City population
- 57,762
- Metro
- Indianapolis-Carmel-Anderson, IN
- Population (ZIP)
- 19,073
- Household income
- $49,310
- Rent vs Own
- Severe rent burden
- 612.0
Population outlook (Madison County) Hauer SSP2
- Today (2025)
- 125,800 people
- By 2030
- 122,640 · -2.5%
- By 2040
- 115,420 · -8.3%
- By 2050
- 108,148 · -14.0%
- By 2075
- 91,838 · -27.0%
- By 2100
- 75,670 · -39.8%
Race, ethnicity, and origin ACS 2023
- Neighborhood character
- Predominantly White (83%)
- Race & ethnicity
- White 83% Two or more races 8% Black 7% Hispanic / Latino 3%
- Common ancestry
- Lithuanian 2% Slovak 2% Italian 1%
- Foreign-born
- 0% · Canada
- Languages at home
- 97% English-only · Spanish 2%
Political lean MEDSL · Madison
- 2024 margin
- Strong R (+26.9) · D 35.6% · R 62.5% · Other 1.9%
- 2008→2024 swing
- -33.5pp toward R · 2008: 6.5pp · 2024: -26.9pp
- All cycles
- 2024: R+26.9 2020: R+22.6 2016: R+25.7 2012: R+4.5 2008: D+6.5
Not yet ingested
- Civics
- —
Market trends
- HPI YoY
- ▼ -86.70%
- Current HPI
- 235.7485
- Rent YoY
- —
- Metro
- Indianapolis-Carmel-Anderson, IN
- State GDP YoY
- ▲ 2.90%
- F500 in state
- 18
Industry mix (Fortune 500 HQ in IN)
| Industry | F500 HQs | Revenue |
|---|---|---|
| Industrial Machinery | 2 | $37B |
|
||
| Healthcare | 1 | $177B |
|
||
| Pharmaceuticals | 1 | $45B |
|
||
| Metals / Steel | 1 | $18B |
|
||
| Agriculture | 1 | $17B |
|
||
| Packaging | 1 | $12B |
|
||
Price history
1 event — show timeline
- 2025-08-25 Listed $77,000 Zillow
Cash-flow waterfall
monthlySold comps — $/sqft
last 12 mo · ≤1 miLoading sold comps…