 🏷️ Likely Rental
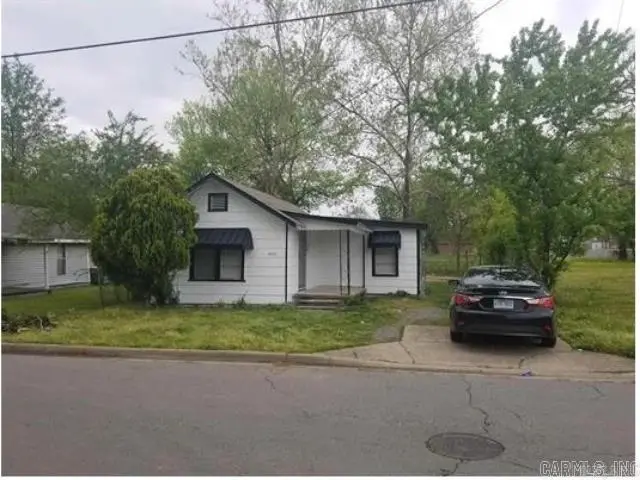
4221 Rogers St · North Little Rock, AR
Flood risk 6/10 · Moderate
- FEMA flood zone
- X (unshaded)
- Chance of flooding over 30 yrs
- 0.68%
- Est. flood insurance / yr
- $507 – $1,088
Fire risk 3/10 · Minor
- Est. fire insurance / yr
- $1,499 – $2,785
Heat risk 7/10 · Major
- Hot days now (above 110°F)
- 7 days/yr
- Hot days in 30 yrs
- 19 days/yr
Wind risk 4/10 · Minor
- Chance of severe wind over 30 yrs
- 10.0%
Air-quality risk 2/10 · Minimal
- Unhealthy air days now
- 2 days/yr
- Unhealthy air days in 30 yrs
- 2 days/yr
Risk factors via First Street. Map © Google.
Why this score? — see what drove the B+ grade
The composite is a weighted blend of 9 inputs, each scored 0–100. Each bar is that input's sub-score; the figure is the points it added to the 100-point composite (weight × sub-score).
- Cash flow +30.0/30.0
- ARV discount +15.0/15.0
- DSCR +10.0/10.0
- 1% rule +9.6/10.0
- Livability +3.7/5.0
- Rent growth +2.5/5.0
- Condition / age +2.5/5.0
- Schools +2.0/10.0
- Appreciation +0.0/10.0
$59,500
🖨 Deal sheet 📄 Offer letter ✓ Due diligence
Listing remarks MLS
2 bedroom 1 bathroom home in North Little Rock! Tenant on a 12 month lease for $725. Fully fenced back yard. Please do not disturb tenant, and please provide pre-approval or proof of funds before showing! Current lease ends November.
Key facts
- 4,356 sq ft lot
- Built 1930
- Listed 455 days
Tags
Neighborhood map
What this means for you Summary
Snapshot
- This is a 2-bed/1.0-bath single-family listed at $60k.
Deal economics
- At list price, monthly cash flow is $319 ($4k/yr) — positive.
- The deal already cash-flows at list — no discount required.
- Meets the 1% rule at list price ($867 rent vs $60k).
- Recommended offer: $52k (12.0% below list) — sets the bar for market timing.
- Cap rate 12.7% vs local median 5.1% in North Little Rock — top-decile yield for the area; either an underpriced asset or a hidden risk that comps aren't pricing in. Stress-test before assuming the spread holds.
Location & tenants
- Location reads 73/100 on livability (#24 in AR) — a middle-class / working-renter tenant base. Strengths: commute A+, cost of living A+, housing A+; Watch: schools D+, crime F, amenities F.
- N. Little Rock School District (urban): math 21% / reading 26% proficiency, ranked #191 of 238 in AR (top 80%) — low school quality limits family demand, transient renter base, plan for 1-2y turnover; 66% free/reduced lunch — lower-income household profile, screen leases tightly.
- Market conditions: 78 active listings in the ZIP; 13 comparable units currently listed for rent nearby; rentals at typical pace (median 24d on market — plan ~3-4 weeks tenant-placement turnaround); 1,006 units permitted in Pulaski County in 2024 (0 in 5+ unit buildings).
Forward outlook
- Local home prices are declining (-3.0%/yr); year-one equity from $411 of loan paydown is wiped out by about $2k of value loss. Plan a longer hold.
- Pulaski County population projected at +6% by 2050 — modest demand growth; plan on rents tracking national, not racing it.
- At projected returns (-3.0% appreciation + 3.0% rent growth), your $17k cash investment doubles in ~6 years — after that, you're playing with house money.
Negotiation context
- It's been on market 455 days — a 12% lower offer ($52k) is reasonable based on typical stale-listing flexibility.
- 3 sale attempts since 4y ago; this cycle's ask has dropped $4k (6%) from the opening price — seller is motivated, your offer sets the floor, not the list.
- Current owner paid $45k; 32% above their basis — modest negotiation headroom, anchor on the comps not their cost.
Risks & watch-outs
- Watch-outs: built in 1930 — expect roof / HVAC / electrical / plumbing capex.
- Climate carrying-cost: major flood risk; extreme-heat days projected 7→19/yr by 2055 (HVAC capex compounding) — expect insurance premiums to compound above CPI over the hold.
Questions for the listing agent
- It's been on market 455 days. Have you received any prior offers? Is the seller open to a 12% concession, seller financing, or rate buy-down credit?
- Built in 1930 — when were the roof, HVAC, electrical panel, plumbing, and water heater last replaced?
- Why hasn't it sold? Are there any deal-killer items the seller is aware of (foundation, flood, title, zoning, code violations)?
- Is there a deadline driving the sale (1031 exchange, divorce, estate, relocation)? That informs how much negotiation room exists.
- Schools are D-rated, which usually means shorter tenancies and higher turnover. Who's the typical renter profile here, and what's been the actual vacancy rate?
- Crime grade is F in this area — have there been break-ins, vandalism, or insurance claims at this property in the last 3 years? What carrier currently insures it and at what premium?
- What's the average days-on-market for RENTAL listings here right now (not sales)? A rising rental-DOM trend means longer vacancies and softer asking-rent achievability than the comps imply.
- What's the recent tenant-quality profile in this submarket — average credit score on applications, eviction rate, late-payment / NSF rate, and stable-employment percentage? A property-management company in the area should have these aggregated.
- How much new for-sale + rental construction is in the pipeline within 1–3 miles? Heavy new supply typically softens prices + rents 12–24 months out; constrained supply supports both.
Investment metrics
- 1% rule
- 1.46% ✓
- Cap rate
- 12.73%
- Cash-on-cash
- 22.97%
- DSCR
- 2.02
- GRM
- 5.7
CMA / ARV
- ARV (median comp)
- $93,013
- List price
- $59,500
- Delta
- -36.03%
- Verdict
- UNDERPRICED
- Comps
- 20 within 1.0 mi
Show comp detail 12 sales within ~0.75 mi
| Address | Dist | Beds/Ba | Sqft | Sold | Price | $/sf | Match |
|---|---|---|---|---|---|---|---|
| 4204 Coral St | 0.43mi | 2/1.0 | 924 (+1%) | 4mo | $24,000 | $26 | 75 |
| 204 Water St | 0.56mi | 2/1.0 | 936 (+2%) | 10mo | $31,000 | $33 | 62 |
| 908 Greenlea Dr | 0.73mi | 3/1.0 (+1) | 912 (-0%) | 4mo | $84,745 | $93 | 56 |
| 809 Healy St | 0.62mi | 3/1.0 (+1) | 936 (+2%) | 8mo | $60,000 | $64 | 56 |
| 626 Mills St | 0.58mi | 3/1.0 (+1) | 982 (+7%) | 2mo | $89,900 | $92 | 54 |
| 702 Hyacinth St | 0.53mi | 2/1.0 | 844 (-8%) | 10mo | $100,000 | $118 | 54 |
| 713 Hyacinth St | 0.54mi | 2/1.0 | 816 (-11%) | 8mo | $57,000 | $70 | 50 |
| 804 Water St | 0.50mi | 3/1.0 (+1) | 1,008 (+10%) | 7mo | $84,000 | $83 | 49 |
| 4705 Goodwin Cir | 0.57mi | 3/1.0 (+1) | 1,002 (+9%) | 7mo | $120,000 | $120 | 47 |
| 418 Mills St | 0.59mi | 3/1.0 (+1) | 996 (+9%) | 9mo | $45,000 | $45 | 45 |
| 615 Mills | 0.56mi | 2/1.0 | 794 (-13%) | 10mo | $27,000 | $34 | 44 |
| 309 Parkdale | 0.47mi | 3/1.0 (+1) | 1,040 (+14%) | 10mo | $124,000 | $119 | 42 |
Match score weights: distance 35% · size 25% · config 20% · recency 20%. Top-matched comps best support the ARV.
Projected returns pro-forma
-3.0% appreciation · 3.0% rent growth · sell at horizon
- IRR
- 15.9%
- Equity multiple
- 1.64×
- Total profit
- $10,657
- Equity at exit
- $8,872
- IRR
- 24.5%
- Equity multiple
- 3.12×
- Total profit
- $35,377
- Equity at exit
- $5,144
Cash invested: $16,660 (down + closing). Projections, not guarantees.
Landlord ↔ Tenant lean methodology
- Overall (STATE)
- 92 Strongly Landlord-Friendly
- State Arkansas
- 92 Strongly Landlord-Friendly · R+14
- County
- — inherits STATE
- City
- — inherits STATE
ZIP-level market 72117
- Home prices YoY
- -30.4%
- Active inventory
- 78
- Price-to-rent
- 5.7×
Monthly cashflow live
- Estimated rent
- $867 high interval (Pro) →
- Mortgage (P&I)
- −$312
- Tax from tax record
- −$29 /mo · $353/yr
- Insurance
- −$25
- HOA
- −$0
- Vacancy / Maint / Mgmt
- −$182
- Net cashflow
- $319
Break-even live
UW: 25.0% down · 7.5% · 30yr · 1.5% tax · 5.0% vac · 8.0% maint · 8.0% mgmt
Financing live
Cash to close
- Down payment
- $14,875
- Closing costs
- $1,785
- Reserves months
- —
- Total cash needed
- —
Loan-product check · same deal, 3 products live
Conventional
25% down · 7.5% · 30yr
- Down + closing
- —
- Monthly P&I
- —
- Monthly cashflow
- —
- DSCR
- —
- Eligible?
- —
Personal DTI + credit; lowest rate.
DSCR
20% down · 8.5% · 30yr
- Down + closing
- —
- Monthly P&I
- —
- Monthly cashflow
- —
- DSCR
- —
- Eligible?
- —
No personal income docs; deal must DSCR.
Hard money
10% down · 12.0% · 12mo
- Down + closing
- —
- Monthly P&I
- —
- Monthly cashflow
- —
- DSCR
- —
- Eligible?
- —
Short-term bridge; refi at stabilization.
Rent comps 13 comps
| Address | Beds | Baths | Sqft | Rent | $/sqft | DOM | Units | Dist |
|---|---|---|---|---|---|---|---|---|
| 303 Short St Unit EV North Little Rock, AR | 1.0 | 1.0 | 600 | $560 | $0.93 | 23d | 1 | 0.15mi |
| 515 Middle St North Little Rock, AR | 2.0 | 1.0 | 894 | $850 | $0.95 | 14d | 1 | 0.18mi |
| 4701 Atkins St North Little Rock, AR | 2.0 | 1.0 | 892 | $925 | $1.04 | 19d | 1 | 0.25mi |
| 607 Prothro St North Little Rock, AR | 2.0 | 1.0 | 779 | $825 | $1.06 | 43d | 1 | 0.28mi |
| 306 Boggs St North Little Rock, AR | 2.0 | 1.0 | 1000 | $850 | $0.85 | 23d | 1 | 0.31mi |
| 4912 School St North Little Rock, AR | 3.0 | 1.0 | 1056 | $950 | $0.90 | 23d | 1 | 0.49mi |
| 5204 Alpha St North Little Rock, AR | 3.0 | 1.0 | 753 | $850 | $1.13 | 43d | 1 | 0.54mi |
| 717 Greenlea Dr North Little Rock, AR | 3.0 | 1.0 | 912 | $1,095 | $1.20 | 43d | 1 | 0.69mi |
| 817 Greenlea Dr North Little Rock, AR | 3.0 | 1.0 | 912 | $1,195 | $1.31 | 23d | 1 | 0.70mi |
| 908 Greenlea Dr North Little Rock, AR | 3.0 | 1.0 | 912 | $1,300 | $1.43 | 21d | 1 | 0.75mi |
| 2107 Muldrow Dr North Little Rock, AR | 3.0 | 1.0 | 900 | $1,015 | $1.13 | 43d | 1 | 0.96mi |
| 211 Crockett St North Little Rock, AR | 2.0 | 1.0 | 1100 | $850 | $0.77 | 43d | 1 | 1.00mi |
| 2908 E 2nd St North Little Rock, AR | 1.0 | 1.0 | 741 | $550 | $0.74 | 23d | 1 | 1.19mi |
Listing history 25 events
-
2026-06-18days on market $59,500 Active 455 DOM
-
2026-06-17days on market $59,500 Active 454 DOM
-
2026-06-16days on market $59,500 Active 453 DOM
-
2026-06-15days on market $59,500 Active 452 DOM
-
2026-06-14days on market $59,500 Active 450 DOM
-
2026-06-13days on market $59,500 Active 449 DOM
-
2026-06-10days on market $59,500 Active 447 DOM
-
2026-06-09days on market $59,500 Active 446 DOM
-
2026-06-08days on market $59,500 Active 445 DOM
-
2026-06-07days on market $59,500 Active 444 DOM
-
2026-06-05days on market $59,500 Active 441 DOM
-
2026-06-03days on market $59,500 Active 440 DOM
-
2026-06-02days on market $59,500 Active 439 DOM
-
2026-06-01days on market $59,500 Active 438 DOM
-
2026-05-31days on market $59,500 Active 437 DOM
-
2026-05-31days on market $59,500 Active 436 DOM
-
2026-05-07price $59,500 233-char remark
Show marketing remark (233 chars)
2 bedroom 1 bathroom home in North Little Rock! Tenant on a 12 month lease for $725. Fully fenced back yard. Please do not disturb tenant, and please provide pre-approval or proof of funds before showing! Current lease ends November.
-
2026-01-14price $62,000 233-char remark
Show marketing remark (233 chars)
2 bedroom 1 bathroom home in North Little Rock! Tenant on a 12 month lease for $725. Fully fenced back yard. Please do not disturb tenant, and please provide pre-approval or proof of funds before showing! Current lease ends November.
-
2025-03-18$63,000 New Listing 233-char remark
Show marketing remark (233 chars)
2 bedroom 1 bathroom home in North Little Rock! Tenant on a 12 month lease for $725. Fully fenced back yard. Please do not disturb tenant, and please provide pre-approval or proof of funds before showing! Current lease ends November.
-
2024-11-28historical $695
-
2024-10-25price $695
-
2024-09-20$725
-
2022-12-07soldstatus $45,000 Sold 72-char remark
Show marketing remark (72 chars)
Great property in North Little Rock to add to your investment portfolio!
-
2022-11-04status Under Contract 72-char remark
Show marketing remark (72 chars)
Great property in North Little Rock to add to your investment portfolio!
-
2022-10-04$60,000 New Listing 72-char remark
Show marketing remark (72 chars)
Great property in North Little Rock to add to your investment portfolio!
ⓘ Source: listings_history table (triggers on properties + properties_extension) + one-shot
backfill from property_details.listing_events for pre-trigger history.
Tax reassessment forecast AR · Resets to sale price
- Current annual tax
- $353 · $29/mo
- Projected year-2 tax
- $381 · $32/mo
- Expected delta
- +$28/yr (+$2/mo · 7.8%)
ⓘ Screening estimate from a state-policy table — verify with the county assessor before closing.
Climate risk First Street
- Flood 6/10 Major FEMA zone X (unshaded) · 68% chance over 30 yrs
- Wildfire 3/10 Moderate
- Heat 7/10 Severe 7 d/yr ≥110°F today · 19 d/yr by 30 yrs out
- Wind 4/10 Moderate 10% chance of damaging wind over 30 yrs
- Air quality 2/10 Low 2 unhealthy d/yr today · 2 by 30 yrs out
Nearby sold comps map
Loading sold comps map…
Walkable amenities ~0.75 mi
Loading nearby amenities…
Taxation est. · year 1
- Rental income
- $10,408
- − Mortgage interest
- −$3,333
- − Property taxes
- −$353
- − Insurance
- −$298
- − Repairs & maintenance
- −$833
- − Management
- −$833
- − Depreciation
- −$1,731
- Taxable income
- $3,028
- Est. tax owed @ 24.0%
- −$727
- After-tax cash flow
- $3,100/yr
For passive investors: Depreciation is non-cash, so a rental often shows a tax loss while cash-flowing — sheltering income. Rental losses are passive: they offset passive income freely, and up to $25,000/yr can offset ordinary (W-2) income if you actively participate and your MAGI is under $100k (phasing out to $0 by $150k); unused losses carry forward. On sale, claimed depreciation is recaptured at up to 25%, and gains may owe capital-gains tax (a 1031 exchange can defer both). Figures are a year-1 estimate at your 24.0% rate — not tax advice; consult a CPA.
Schools (NCES district)
- District
- N. Little Rock School District
- NCES district ID
- 0510680
- Math proficiency
- 21% ▼ -11.00%
- Reading proficiency
- 26% ▼ -9.00%
- Median HH income
- $38,325
- Composite
- 19.69/100
- National rank
- #8728
- State rank
- #191 of 238 in AR
Livability — North Little Rock
- Score
- 73/100
- State rank
- #24
- US rank
- #5452
Category grades
Schools grade is shown separately in the Schools card above.
Census & demographics
- Census place
- North Little Rock, AR
- City population
- 55,470
- Population (ZIP)
- 14,339
Population outlook (Pulaski County) Hauer SSP2
- Today (2025)
- 415,378 people
- By 2030
- 423,720 · +2.0%
- By 2040
- 435,182 · +4.8%
- By 2050
- 440,904 · +6.1%
- By 2075
- 445,521 · +7.3%
- By 2100
- 419,173 · +0.9%
Race, ethnicity, and origin ACS 2023
- Neighborhood character
- Majority Black (63%)
- Race & ethnicity
- Black 63% White 24% Two or more races 7% Hispanic / Latino 5%
- Hispanic origin (detail)
- Mexican 5%
- Common ancestry
- Serbian 1% Slovak 1% Lithuanian 0%
- Foreign-born
- 3% · Canada
- Languages at home
- 95% English-only · Spanish 4%
Political lean MEDSL · Pulaski
- 2024 margin
- Strong D (+22.1) · D 59.8% · R 37.7% · Other 2.5%
- 2008→2024 swing
- +10.6pp toward D · 2008: 11.6pp · 2024: 22.1pp
- All cycles
- 2024: D+22.1 2020: D+22.5 2016: D+17.9 2012: D+11.4 2008: D+11.6
Not yet ingested
- Civics
- —
Market trends
- HPI YoY
- ▼ -53.78%
- Current HPI
- 123.3727
- Rent YoY
- —
- Metro
- —
- State GDP YoY
- ▲ 3.80%
- F500 in state
- 10
Industry mix (Fortune 500 HQ in AR)
| Industry | F500 HQs | Revenue |
|---|---|---|
| Retail | 1 | $681B |
|
||
| Food / Agriculture | 1 | $53B |
|
||
| Retail / Energy | 1 | $22B |
|
||
| Transportation / Logistics | 1 | $12B |
|
||
| Energy | 1 | $4B |
|
||
Price history
-0.8% since first listed9 events — show timeline
- 2026-05-07 Price Changed $59,500 CARMLS
- 2026-01-14 Price Changed $62,000 CARMLS
- 2025-03-18 Listed $63,000 CARMLS
- 2024-11-28 Rental Removed $695 CARMLS
- 2024-10-25 Price Changed $695 CARMLS
- 2024-09-20 Listed for Rent $725 CARMLS
- 2022-12-07 Sold (MLS) $45,000 CARMLS
- 2022-11-04 Pending — CARMLS
- 2022-10-04 Listed $60,000 CARMLS
Property tax history
+3.2%/yrLatest (2025): $353 · +6.0% YoY. Source: county tax records.
Cash-flow waterfall
monthlySold comps — $/sqft
last 12 mo · ≤1 miLoading sold comps…