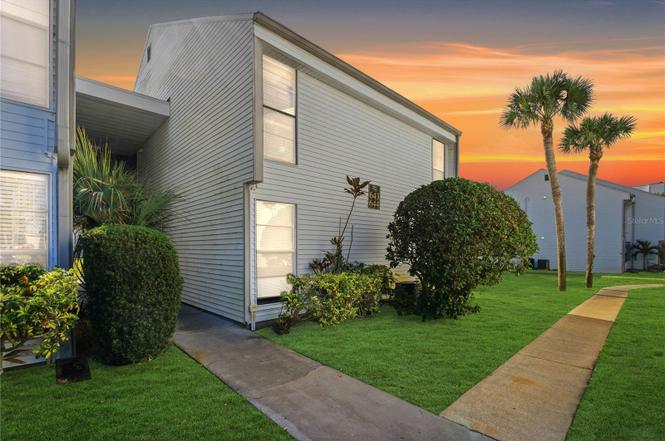
643 Haven Pl #643 · Tarpon Springs, FL
Flood risk 6/10 · Moderate
- FEMA flood zone
- X (unshaded)
- Chance of flooding over 30 yrs
- 0.69%
- Est. flood insurance / yr
- $507 – $1,088
Fire risk 1/10 · Minimal
- Est. fire insurance / yr
- $947 – $1,759
Heat risk 10/10 · Severe
- Hot days now (above 109°F)
- 7 days/yr
- Hot days in 30 yrs
- 28 days/yr
Wind risk 10/10 · Severe
- Chance of severe wind over 30 yrs
- 99.0%
Air-quality risk 3/10 · Minor
- Unhealthy air days now
- 2 days/yr
- Unhealthy air days in 30 yrs
- 2 days/yr
Risk factors via First Street. Map © Google.
Why this score? — see what drove the D grade
The composite is a weighted blend of 9 inputs, each scored 0–100. Each bar is that input's sub-score; the figure is the points it added to the 100-point composite (weight × sub-score).
- Cash flow +11.8/30.0
- ARV discount +7.5/15.0
- 1% rule +7.2/10.0
- Schools +4.3/10.0
- DSCR +3.5/10.0
- Livability +3.4/5.0
- Condition / age +2.5/5.0
- Rent growth +2.2/5.0
- Appreciation +0.0/10.0
$142,500
🖨 Deal sheet (PDF) 📄 Offer letter ✓ Due diligence
Listing remarks
One or more photo(s) has been virtually staged. Welcome to this inviting two bedroom condo located in the heart of Tarpon Springs, Florida! Positioned on the second floor, this home offers the added benefit of no neighbors above, creating a quieter and more peaceful living experience. From the moment you step inside, the condo feels light and welcoming, with an open layout designed to make the most of every square foot. Newer Life Proof (and waterproof!) Luxury Vinyl Plank flooring throughout, New Water Heater (2020) and crown molding in all the right places! The kitchen is beautifully appointed and thoughtfully designed to stay connected to the main living areas with Quartz countertops and
Key facts
- Large storage closet
- Community pool
- No neighbors above
Tags
Property features AI
Finance
- Other: Unfurnished; Third-party listing; Directions: From US-19 turn West onto E. Martin Luther King Jr Dr., enter Palms of Tarpon Springs, immediate left at gate onto Haven Place, unit in building marked "643" on the second floor
- Financial info: Total annual fees $5,097.84; Lease restrictions apply
- HOA & community: Monthly HOA fee of $424.82 (includes pool, insurance, building & grounds maintenance, management, pest control, recreational facilities, sewer, trash and water); Buyer approval required for association; Association approval required; Community features: pool, community mailbox, deed restrictions, sidewalks; Pets allowed with restrictions (breed restrictions, number limit, max pet weight 100 lbs)
Exterior
- Parking: Open parking
- Utilities: Public water; Public sewer; Electricity connected; Cable available; High-speed internet / BB/HS available; Water connected; Sewer connected
- Home design: Residential condominium; 2 total stories; unit located on 2nd floor; Faces east
- Construction: Vinyl siding and frame construction; Shingle roof; Slab foundation; Built as part of a 4-unit building
- Exterior features: Covered, screened patio/porch; Balcony; Sidewalks; Sliding doors; Exterior storage; Landscaped grounds; Near golf course; Near marina; Paved road
Interior
- Kitchen: Dishwasher; Disposal; Microwave; Range; Refrigerator; Electric water heater
- Bedrooms: 2 bedrooms
- Bathrooms: 1 full bath; 1 half bath
- Heating & cooling: Central heating (electric); Central air conditioning
- Interior features: Ceiling fans; Crown molding; Kitchen open to family room; Living room open to dining room; Open floorplan; Solid surface counters; Walk-in closet(s); Window treatments (blinds, drapes, rods)
- Laundry & utility: Washer; Dryer; Inside laundry in a laundry closet; Inside utility and storage rooms
Neighborhood map
What this means for you Summary
Snapshot
- This is a 2-bed/1.5-bath condo listed at $142k.
Deal economics
- At list price, monthly cash flow is $-39 ($-473/yr) — negative.
- To cash-flow at today's rent, offer at most $137k (4.0% below list).
- Meets the 1% rule at list price ($2k rent vs $142k).
- Recommended offer: $125k (12.0% below list) — sets the bar for market timing.
- Cap rate 6.0% vs local median 3.3% in Tarpon Springs — top-decile yield for the area; either an underpriced asset or a hidden risk that comps aren't pricing in. Stress-test before assuming the spread holds.
Location & tenants
- Location reads 68/100 on livability (#502 in FL) — a middle-class / working-renter tenant base. Strengths: housing A+, cost of living A; Watch: employment C-, amenities F, commute F.
- Pinellas (suburban): math 51% / reading 51% proficiency, ranked #31 of 73 in FL (top 42%) — acceptable for families but not a draw, mixed tenant base, ~2y average lease.
- Zoned schools: Tarpon Springs Elementary School (math 57% / reading 41%, grade D, #1,134 of 2,144 statewide, top 54%, 506 students, 80% FRL); Tarpon Springs Middle School (math 59% / reading 61%, grade B, #135 of 571 statewide, top 24%, 644 students, 50% FRL); Tarpon Springs High School (math 30% / reading 47%, grade F, #321 of 667 statewide, top 49%, 1,139 students, 46% FRL).
- Market conditions: Rents soft (-1.2%/yr); 404 active listings in the ZIP; 22 comparable units currently listed for rent nearby; rentals at typical pace (median 23d on market — plan ~3-4 weeks tenant-placement turnaround); 2,676 units permitted in Pinellas County in 2024 (1,422 in 5+ unit buildings).
Forward outlook
- Local home prices are declining (-3.0%/yr); year-one equity from $985 of loan paydown is wiped out by about $4k of value loss. Plan a longer hold.
- Pinellas County population projected at +14% by 2050 — modest demand growth; plan on rents tracking national, not racing it.
Negotiation context
- It's been on market 157 days — a 12% lower offer ($125k) is reasonable based on typical stale-listing flexibility.
Risks & watch-outs
- Watch-outs: HOA is 24% of rent.
- Climate carrying-cost: major flood risk; severe wind risk, 99% chance of damaging wind over 30y; extreme-heat days projected 7→28/yr by 2055 (HVAC capex compounding) — expect insurance premiums to compound above CPI over the hold.
Questions for the listing agent
- What do current leases actually rent for vs. the listed asking? Can we see a recent rent roll and the last 12 months of T-12 income?
- It's been on market 157 days. Have you received any prior offers? Is the seller open to a 12% concession, seller financing, or rate buy-down credit?
- Built in 1975 — when were the roof, HVAC, electrical panel, plumbing, and water heater last replaced?
- What does the HOA fee cover, when was the last increase, and are there any pending special assessments or reserve-fund shortfalls?
- Any open or pending special assessments — roof, HVAC, plumbing, elevator, façade? What's the per-unit balance and payoff schedule, and is the seller paying it off at close or rolling it to the buyer?
- Why hasn't it sold? Are there any deal-killer items the seller is aware of (foundation, flood, title, zoning, code violations)?
- Is there a deadline driving the sale (1031 exchange, divorce, estate, relocation)? That informs how much negotiation room exists.
- Schools are A-rated — typically a magnet for longer-tenancy family renters. What's the average tenant stay here, and is there a school-zone premium baked into asking?
- The area grade is low — what's the realistic commute time and amenity access for the typical tenant pool here? Any planned neighborhood developments (good or bad) we should know about?
- What's the average days-on-market for RENTAL listings here right now (not sales)? A rising rental-DOM trend means longer vacancies and softer asking-rent achievability than the comps imply.
- What's the recent tenant-quality profile in this submarket — average credit score on applications, eviction rate, late-payment / NSF rate, and stable-employment percentage? A property-management company in the area should have these aggregated.
- How much new apartment / multifamily construction is in the pipeline within 1–3 miles? Heavy new supply (>2% of stock underway) typically softens rents 12–24 months out; light construction supports rent growth.
Investment metrics
- 1% rule
- 1.22% ✓
- Cap rate
- 5.96%
- Cash-on-cash
- -1.18%
- DSCR
- 0.95
- GRM
- 6.9
CMA / ARV
No comps found within radius.
Projected returns pro-forma
-3.0% appreciation · 0.0% rent growth · sell at horizon
- IRR
- -23.0%
- Equity multiple
- 0.24×
- Total profit
- $-30,392
- Equity at exit
- $21,247
- IRR
- -36.6%
- Equity multiple
- -0.21×
- Total profit
- $-48,162
- Equity at exit
- $12,321
Cash invested: $39,900 (down + closing). Projections, not guarantees.
Landlord ↔ Tenant lean methodology
- Overall (STATE)
- 87 Strongly Landlord-Friendly
- State Florida
- 87 Strongly Landlord-Friendly · R+3
- County
- — inherits STATE
- City
- — inherits STATE
ZIP-level market 34689
- Rents YoY
- -1.2%
- Active inventory
- 404
- Price-to-rent
- 6.9×
Monthly cashflow live
- Estimated rent
- $1,733 high interval (Pro) →
- Mortgage (P&I)
- −$747
- Tax est. 1.5%
- −$178 /mo · $2,138/yr
- Insurance
- −$59
- HOA
- −$424
- Vacancy / Maint / Mgmt
- −$364
- Net cashflow
- $-39
Break-even live
Sensitivity live
| Price | -10% $59 | -5% $10 | +0% $-39 | +5% $-89 | +10% $-138 |
|---|---|---|---|---|---|
| Rent | -10% $-176 | -5% $-108 | +0% $-39 | +5% $29 | +10% $98 |
| Rate | -1.0pp $32 | -0.5pp $-3 | base $-39 | +0.5pp $-76 | +1.0pp $-114 |
UW: 25.0% down · 7.5% · 30yr · 1.5% tax · 5.0% vac · 8.0% maint · 8.0% mgmt
Financing live
Cash to close
- Down payment
- $35,625
- Closing costs
- $4,275
- Reserves months
- —
- Total cash needed
- —
Loan-product check · same deal, 3 products live
Conventional
25% down · 7.5% · 30yr
- Down + closing
- —
- Monthly P&I
- —
- Monthly cashflow
- —
- DSCR
- —
- Eligible?
- —
Personal DTI + credit; lowest rate.
DSCR
20% down · 8.5% · 30yr
- Down + closing
- —
- Monthly P&I
- —
- Monthly cashflow
- —
- DSCR
- —
- Eligible?
- —
No personal income docs; deal must DSCR.
Hard money
10% down · 12.0% · 12mo
- Down + closing
- —
- Monthly P&I
- —
- Monthly cashflow
- —
- DSCR
- —
- Eligible?
- —
Short-term bridge; refi at stabilization.
Rent comps 22 comps
| Address | Beds | Baths | Sqft | Rent | $/sqft | DOM | Units | Dist |
|---|---|---|---|---|---|---|---|---|
| 640 Haven Pl #640 Tarpon Springs, FL | 2.0 | 1.5 | 960 | $1,575 | $1.64 | 0d | 1 | 0.02mi |
| 673 Haven Pl #673 Tarpon Springs, FL | 2.0 | 1.5 | 960 | $1,450 | $1.51 | 16d | 1 | 0.09mi |
| 501 Saint Michaels Way Unit 520 Tarpon Springs, FL | 2.0 | 2.0 | 1000 | $1,595 | $1.59 | 26d | 1 | 0.21mi |
| 1113 E Lime St Tarpon Springs, FL | 2.0 | 1.0 | 780 | $1,200 | $1.54 | 6d | 1 | 0.37mi |
| 524 E Lime St Tarpon Springs, FL | 2.0 | 1.0 | 775 | $1,600 | $2.06 | 26d | 1 | 0.49mi |
| 650 E Tarpon Ave Unit C1 Tarpon Springs, FL | 3.0 | 2.0 | 900 | $2,000 | $2.22 | 9d | 1 | 0.51mi |
| 39650 US Highway 19 N #141 Tarpon Springs, FL | 2.0 | 2.0 | 950 | $1,550 | $1.63 | 6d | 1 | 0.52mi |
| 825 Cypress St Tarpon Springs, FL | 1.0–2.0 | 1.0 | 750 | $1,674 | $2.23 | 0d | 6 | 0.70mi |
| 320 S Grosse Ave Tarpon Springs, FL | 3.0 | 1.0 | 936 | $1,749 | $1.87 | 26d | 1 | 0.70mi |
| 316 E Boyer St Tarpon Springs, FL | 3.0 | 1.0 | 936 | $1,749 | $1.87 | 26d | 1 | 0.73mi |
| 707 E Spruce St Tarpon Springs, FL | 3.0 | 1.0 | 967 | $1,700 | $1.76 | 12d | 1 | 0.91mi |
| 1185 S Pinellas Ave Tarpon Springs, FL | 1.0–3.0 | 1.0–2.0 | 1013 | $2,154 | $2.12 | 0d | 20 | 0.95mi |
| 103 E Park St Tarpon Springs, FL | 3.0 | 1.0 | 999 | $3,000 | $3.00 | 26d | 1 | 1.04mi |
| 101 W Lemon St Tarpon Springs, FL | 1.0 | 1.0 | 650 | $1,450 | $2.23 | 6d | 1 | 1.08mi |
| 101 W Lemon St Unit 4 Tarpon Springs, FL | 1.0 | 1.0 | 650 | $1,450 | $2.23 | 16d | 1 | 1.08mi |
| 101 W Lemon St Apt 3 Tarpon Springs, FL | 1.0 | 1.0 | 650 | $1,350 | $2.08 | 23d | 1 | 1.08mi |
| 329 Moorings Cove Dr Tarpon Springs, FL | 2.0 | 2.0 | 1020 | $1,700 | $1.67 | 22d | 1 | 1.12mi |
| 1250 S Pinellas Ave #504 Tarpon Springs, FL | 1.0 | 1.0 | 565 | $1,099 | $1.95 | 26d | 1 | 1.13mi |
| 105 S Spring Blvd Unit 10 Tarpon Springs, FL | 1.0 | 1.0 | 700 | $1,350 | $1.93 | 26d | 1 | 1.28mi |
| 542 Division St Tarpon Springs, FL | 2.0 | 1.0 | 629 | $1,400 | $2.23 | 13d | 1 | 1.29mi |
| 812 Bayou Ave Unit B Tarpon Springs, FL | 1.0 | 1.0 | 675 | $1,450 | $2.15 | 26d | 1 | 1.31mi |
| 817 Margo St Tarpon Springs, FL | 2.0 | 1.0 | 792 | $1,600 | $2.02 | 26d | 1 | 1.35mi |
HOA detail condo
- Monthly dues
- $424 · $5,088/yr
- Likely covers
- water
- Assessments
- None detected in remarks — confirm with the listing agent.
Listing history 17 events
-
2026-06-22days on market $142,500 Active 157 DOM
-
2026-06-18days on market $142,500 Active 154 DOM
-
2026-06-17days on market $142,500 Active 153 DOM
-
2026-06-16days on market $142,500 Active 152 DOM
-
2026-06-15days on market $142,500 Active 151 DOM
-
2026-06-13days on market $142,500 Active 149 DOM
-
2026-06-09days on market $142,500 Active 145 DOM
-
2026-06-08days on market $142,500 Active 144 DOM
-
2026-06-07days on market $142,500 Active 143 DOM
-
2026-06-04days on market $142,500 Active 140 DOM
-
2026-06-03days on market $142,500 Active 139 DOM
-
2026-06-01days on market $142,500 Active 137 DOM
-
2026-05-31days on market $142,500 Active 136 DOM
-
2026-05-20price $142,500
-
2026-04-23price $147,500
-
2026-04-06price $157,500
-
2026-01-15$160,000 Active
ⓘ Source: listings_history table (triggers on properties + properties_extension) + one-shot
backfill from property_details.listing_events for pre-trigger history.
Climate risk First Street
- Flood 6/10 Major FEMA zone X (unshaded) · 69% chance over 30 yrs
- Wildfire 1/10 Low
- Heat 10/10 Extreme 7 d/yr ≥109°F today · 28 d/yr by 30 yrs out
- Wind 10/10 Extreme 99% chance of damaging wind over 30 yrs
- Air quality 3/10 Moderate 2 unhealthy d/yr today · 2 by 30 yrs out
Nearby sold comps map
Loading sold comps map…
Walkable amenities ~0.75 mi
Loading nearby amenities…
Taxation est. · year 1
- Rental income
- $20,801
- − Mortgage interest
- −$7,982
- − Property taxes
- −$2,138
- − Insurance
- −$712
- − Repairs & maintenance
- −$1,664
- − Management
- −$1,664
- − HOA
- −$5,088
- − Depreciation
- −$4,145
- Taxable loss
- −$2,593
- Est. tax savings @ 24.0%
- +$622
- After-tax cash flow
- $150/yr
For passive investors: Depreciation is non-cash, so a rental often shows a tax loss while cash-flowing — sheltering income. Rental losses are passive: they offset passive income freely, and up to $25,000/yr can offset ordinary (W-2) income if you actively participate and your MAGI is under $100k (phasing out to $0 by $150k); unused losses carry forward. On sale, claimed depreciation is recaptured at up to 25%, and gains may owe capital-gains tax (a 1031 exchange can defer both). Figures are a year-1 estimate at your 24.0% rate — not tax advice; consult a CPA.
Schools (NCES district)
- District
- Pinellas
- NCES district ID
- 1201560
- Math proficiency
- 51% ▼ -5.00%
- Reading proficiency
- 51% ▼ -3.00%
- Median HH income
- $46,270
- Composite
- 43.27/100
- National rank
- #3046
- State rank
- #31 of 73 in FL
Livability — Tarpon Springs
- Score
- 68/100
- State rank
- #502
- US rank
- #9244
Category grades
Schools grade is shown separately in the Schools card above.
Census & demographics
- Census place
- Tarpon Springs, FL
- County
- Pinellas County · 939,478 people
- City population
- 27,324
- Metro
- Tampa-St. Petersburg-Clearwater, FL
- Population (ZIP)
- 27,324
- Household income
- $74,854
- Rent vs Own
- Severe rent burden
- 721.0
Population outlook (Pinellas County) Hauer SSP2
- Today (2025)
- 1,027,532 people
- By 2030
- 1,063,586 · +3.5%
- By 2040
- 1,125,020 · +9.5%
- By 2050
- 1,168,637 · +13.7%
- By 2075
- 1,265,188 · +23.1%
- By 2100
- 1,260,357 · +22.7%
Race, ethnicity, and origin ACS 2023
- Neighborhood character
- Predominantly White (80%)
- Race & ethnicity
- White 80% Hispanic / Latino 10% Two or more races 7% Black 6%
- Hispanic origin (detail)
- Mexican 2% Puerto Rican 4%
- Common ancestry
- Romanian 6% Lithuanian 3% Slovak 2%
- Foreign-born
- 10% · Canada, Jamaica, Dominican Republic
- Languages at home
- 84% English-only · Other Indo-European 6% Spanish 6% French/Haitian/Cajun 1%
Political lean MEDSL · Pinellas
- 2024 margin
- Lean R (+5.2) · D 46.9% · R 52.1%
- 2008→2024 swing
- -13.5pp toward R · 2008: 8.3pp · 2024: -5.2pp
- All cycles
- 2024: R+5.2 2020: D+0.2 2016: R+1.1 2012: D+5.6 2008: D+8.3
Not yet ingested
- Civics
- —
Market trends
- HPI YoY
- ▼ -300.96%
- Current HPI
- 303.7434
- Rent YoY
- ▼ -1.16%
- Metro
- Tampa-St. Petersburg-Clearwater, FL
- State GDP YoY
- ▲ 3.28%
- F500 in state
- 36
Industry mix (Fortune 500 HQ in FL)
| Industry | F500 HQs | Revenue |
|---|---|---|
| Industrial Technology | 2 | $29B |
|
||
| Insurance | 2 | $17B |
|
||
| Retail | 1 | $60B |
|
||
| Technology Distribution | 1 | $58B |
|
||
| Homebuilding | 1 | $35B |
|
||
| Technology Manufacturing | 1 | $35B |
|
||
Price history
-10.9% since first listed4 events — show timeline
- 2026-05-20 Price Changed $142,500 Stellar MLS as Distributed by MLS Grid
- 2026-04-23 Price Changed $147,500 Stellar MLS as Distributed by MLS Grid
- 2026-04-06 Price Changed $157,500 Stellar MLS as Distributed by MLS Grid
- 2026-01-15 Listed $160,000 Stellar MLS as Distributed by MLS Grid
Cash-flow waterfall
monthlySold comps — $/sqft
last 12 mo · ≤1 miLoading sold comps…