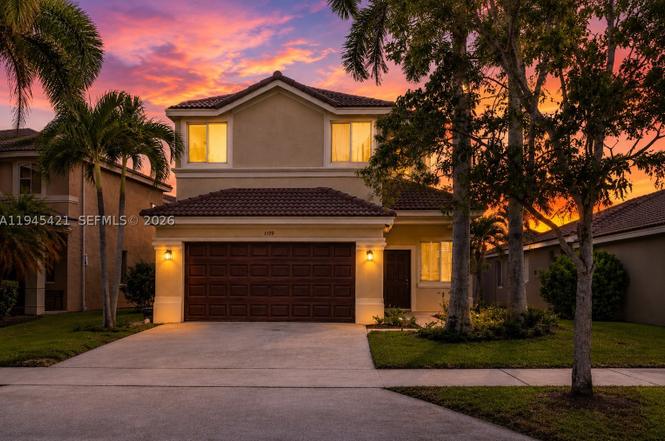
1199 Golden Cane Dr · Weston, FL
Flood risk 1/10 · Minimal
- FEMA flood zone
- X (shaded)
- Chance of flooding over 30 yrs
- 0.0%
- Est. flood insurance / yr
- $507 – $1,088
Fire risk 3/10 · Minor
- Est. fire insurance / yr
- $947 – $1,759
Heat risk 9/10 · Severe
- Hot days now (above 107°F)
- 7 days/yr
- Hot days in 30 yrs
- 25 days/yr
Wind risk 10/10 · Severe
- Chance of severe wind over 30 yrs
- 99.0%
Air-quality risk 2/10 · Minimal
- Unhealthy air days now
- 2 days/yr
- Unhealthy air days in 30 yrs
- 2 days/yr
Risk factors via First Street. Map © Google.
Why this score? — see what drove the C grade
The composite is a weighted blend of 9 inputs, each scored 0–100. Each bar is that input's sub-score; the figure is the points it added to the 100-point composite (weight × sub-score).
- ARV discount +15.0/15.0
- Cash flow +14.0/30.0
- Appreciation +5.4/10.0
- DSCR +4.3/10.0
- Schools +4.1/10.0
- 1% rule +3.8/10.0
- Livability +3.4/5.0
- Rent growth +3.1/5.0
- Condition / age +2.5/5.0
$749,900
🖨 Deal sheet 📄 Offer letter ✓ Due diligence
Listing remarks
Major Price Improvement! Exceptional opportunity in Savanna. Seller has paid the special assessment in full. Spacious 5-bedroom home with primary suite on the first floor, this home offers a functional layout perfect for families, multi-generational living, or anyone seeking added privacy and convenience. The bright and open living areas provide plenty of space for everyday living and entertaining, while the kitchen overlooks the main gathering spaces, creating the perfect setting for family and friends. Upstairs, you'll find generously sized secondary bedrooms with room for guests, a home office, playroom, or fitness space. Step outside to a covered and screened patio, ideal for relaxing,
Key facts
- 4,492 sq ft lot
- 2 garage spots
- Community pool
Tags
Property features AI
Finance
- Other: Community pool (community amenity); Zoned R-1
- HOA & community: Homeowners association; Quarterly association fee; Community clubhouse; Gated; Maintained community; Community pool; Street lights; Sidewalks
Exterior
- Parking: 2-car garage; Driveway; Garage door opener; 2 covered parking spaces
- Security: Gated community; Security guard; Smoke detector(s)
- Utilities: Public water; Public sewer
- Home design: 2 stories; Faces east
- Construction: Block construction; Spanish tile roof; Resale property
- Exterior features: Barbecue; Enclosed porch; Patio; Patio (screened)
Interior
- Kitchen: Dishwasher; Disposal; Microwave; Refrigerator
- Bedrooms: Bedroom on main level; Den; Other
- Flooring: Ceramic tile; Hardwood; Wood
- Bathrooms: 2 full bathrooms; 1 half bathroom
- Heating & cooling: Central heating; Central air conditioning
- Interior features: Breakfast area; Closet cabinetry; Dining area; Separate/formal dining room; Eat-in kitchen; First floor entry; Pantry; Walk-in closet(s)
- Laundry & utility: Washer hookup; Dryer hookup; Washer; Dryer
Neighborhood map
What this means for you Summary
Snapshot
- This is a 5-bed/4.0-bath single-family listed at $750k.
Deal economics
- At list price, monthly cash flow is $99 ($1k/yr) — positive.
- The deal already cash-flows at list — no discount required.
- To meet the 1% rule (rent ≥ 1% of price), the offer needs to be $658k (12.2% below list).
- Recommended offer: $658k (12.2% below list) — sets the bar for 1% rule.
- Cap rate 6.5% vs local median 3.3% in Weston — top-decile yield for the area; either an underpriced asset or a hidden risk that comps aren't pricing in. Stress-test before assuming the spread holds.
Location & tenants
- Location reads 67/100 on livability (#546 in FL) — a middle-class / working-renter tenant base. Strengths: schools A+, crime A+, employment A+; Watch: amenities F, commute F, cost of living F.
- Broward (suburban): math 42% / reading 53% proficiency, ranked #46 of 73 in FL (top 63%) — families likely to look elsewhere, expect single-tenant / working-renter base with shorter leases.
- Market conditions: Rents rising (+2.4%/yr); 131 active listings in the ZIP; 40 comparable units currently listed for rent nearby; rentals at typical pace (median 25d on market — plan ~3-4 weeks tenant-placement turnaround); high-income renter base; 2,111 units permitted in Broward County in 2024 (1,265 in 5+ unit buildings).
- At $6,585/mo this rent would consume 50% of the median local household income ($159k/yr) (locally 574% of renters already pay >50% of income on rent) — very limited rent-growth headroom before tenants either downsize or default.
Forward outlook
- In year one you build about $11k of equity ($5k loan paydown + $6k appreciation (0.8% local appreciation)).
- Broward County population projected at +34% by 2050 — long-run rental-demand tailwind backs the buy-and-hold thesis.
- By year 5, paydown + projected appreciation supports a ~$52k cash-out refi (75% LTV) — recoverable capital for the next deal without selling this one.
Negotiation context
- It's been on market 154 days — a 12% lower offer ($660k) is reasonable based on typical stale-listing flexibility.
- 5 sale attempts since 13y ago; this cycle's ask has dropped $74k (9%) from the opening price — seller is motivated, your offer sets the floor, not the list.
- Current owner paid $360k; list at $750k implies a 108% gain — meaningful room to come down on a strong offer.
Risks & watch-outs
- Climate carrying-cost: severe wind risk, 99% chance of damaging wind over 30y; extreme-heat days projected 7→25/yr by 2055 (HVAC capex compounding) — expect insurance premiums to compound above CPI over the hold.
Questions for the listing agent
- It's been on market 154 days. Have you received any prior offers? Is the seller open to a 12% concession, seller financing, or rate buy-down credit?
- What does the HOA fee cover, when was the last increase, and are there any pending special assessments or reserve-fund shortfalls?
- Why hasn't it sold? Are there any deal-killer items the seller is aware of (foundation, flood, title, zoning, code violations)?
- Is there a deadline driving the sale (1031 exchange, divorce, estate, relocation)? That informs how much negotiation room exists.
- Schools are A-rated — typically a magnet for longer-tenancy family renters. What's the average tenant stay here, and is there a school-zone premium baked into asking?
- What's the average days-on-market for RENTAL listings here right now (not sales)? A rising rental-DOM trend means longer vacancies and softer asking-rent achievability than the comps imply.
- What's the recent tenant-quality profile in this submarket — average credit score on applications, eviction rate, late-payment / NSF rate, and stable-employment percentage? A property-management company in the area should have these aggregated.
- How much new for-sale + rental construction is in the pipeline within 1–3 miles? Heavy new supply typically softens prices + rents 12–24 months out; constrained supply supports both.
Investment metrics
- 1% rule
- 0.88% ✗
- Cap rate
- 6.45%
- Cash-on-cash
- 0.56%
- DSCR
- 1.03
- GRM
- 9.5
CMA / ARV
- ARV (on-the-fly)
- $992,718
- Comps found
- 3
Show comp detail 3 sales within ~0.75 mi
| Address | Dist | Beds/Ba | Sqft | Sold | Price | $/sf | Match |
|---|---|---|---|---|---|---|---|
| 1170 Chenille Cir | 0.56mi | 5/4.0 | 2,798 (+11%) | 3mo | $1,100,000 | $393 | 53 |
| 970 Bluewood Ter | 0.30mi | 4/2.5 (-1) | 2,326 (-8%) | 14mo | $750,000 | $322 | 51 |
| 1306 Crossbill Ct | 0.63mi | 5/2.5 | 2,764 (+9%) | 1mo | $1,095,000 | $396 | 48 |
Match score weights: distance 35% · size 25% · config 20% · recency 20%. Top-matched comps best support the ARV.
Projected returns pro-forma
0.76% appreciation · 2.41% rent growth · sell at horizon
- IRR
- 0.8%
- Equity multiple
- 1.04×
- Total profit
- $7,890
- Equity at exit
- $246,870
- IRR
- 5.3%
- Equity multiple
- 1.62×
- Total profit
- $129,769
- Equity at exit
- $321,118
Cash invested: $209,972 (down + closing). Projections, not guarantees.
Landlord ↔ Tenant lean methodology
- Overall (STATE)
- 87 Strongly Landlord-Friendly
- State Florida
- 87 Strongly Landlord-Friendly · R+3
- County
- — inherits STATE
- City
- — inherits STATE
ZIP-level market 33327
- Home prices YoY
- 0.3%
- Rents YoY
- 2.4%
- Active inventory
- 131
- Price-to-rent
- 9.5×
Monthly cashflow live
- Estimated rent
- $6,585 high interval (Pro) →
- Mortgage (P&I)
- −$3,933
- Tax from tax record
- −$672 /mo · $8,067/yr
- Insurance
- −$312
- HOA
- −$186
- Vacancy / Maint / Mgmt
- −$1,383
- Net cashflow
- $99
Break-even live
UW: 25.0% down · 7.5% · 30yr · 1.5% tax · 5.0% vac · 8.0% maint · 8.0% mgmt
Financing live
Cash to close
- Down payment
- $187,475
- Closing costs
- $22,497
- Reserves months
- —
- Total cash needed
- —
Loan-product check · same deal, 3 products live
Conventional
25% down · 7.5% · 30yr
- Down + closing
- —
- Monthly P&I
- —
- Monthly cashflow
- —
- DSCR
- —
- Eligible?
- —
Personal DTI + credit; lowest rate.
DSCR
20% down · 8.5% · 30yr
- Down + closing
- —
- Monthly P&I
- —
- Monthly cashflow
- —
- DSCR
- —
- Eligible?
- —
No personal income docs; deal must DSCR.
Hard money
10% down · 12.0% · 12mo
- Down + closing
- —
- Monthly P&I
- —
- Monthly cashflow
- —
- DSCR
- —
- Eligible?
- —
Short-term bridge; refi at stabilization.
Rent comps 40 comps
| Address | Beds | Baths | Sqft | Rent | $/sqft | DOM | Units | Dist |
|---|---|---|---|---|---|---|---|---|
| 709 Bald Cypress Rd Weston, FL | 4.0 | 3.5 | 2254 | $7,100 | $3.15 | 24d | 1 | 0.21mi |
| 1006 Sunflower Cir Weston, FL | 4.0 | 2.5 | 2115 | $4,500 | $2.13 | 8d | 1 | 0.22mi |
| 828 Vanda Ter Weston, FL | 4.0 | 2.0 | 1876 | $5,200 | $2.77 | 3d | 1 | 0.30mi |
| 898 Tulip Cir Weston, FL | 5.0 | 4.0 | 3092 | $5,500 | $1.78 | 24d | 1 | 0.40mi |
| 1714 Victoria Pointe Cir Weston, FL | 4.0 | 2.5 | 2587 | $7,800 | $3.02 | 15d | 1 | 0.42mi |
| 950 Marina Dr Weston, FL | 4.0 | 3.0 | 2599 | $7,200 | $2.77 | 8d | 1 | 0.45mi |
| 1094 Bluewood Ter Weston, FL | 5.0 | 4.0 | 2672 | $8,500 | $3.18 | 5d | 1 | 0.46mi |
| 1139 Chenille Cir Weston, FL | 4.0 | 2.5 | 2285 | $4,950 | $2.17 | 24d | 1 | 0.47mi |
| 1666 Victoria Pointe Cir Weston, FL | 4.0 | 3.5 | 3176 | $7,990 | $2.52 | 24d | 1 | 0.48mi |
| 1666 Victoria Pointe Cir Weston, FL | 4.0 | 3.5 | 3176 | $7,990 | $2.52 | 4d | 1 | 0.48mi |
| 878 Lavender Cir #878 Weston, FL | 4.0 | 2.0 | 1876 | $5,500 | $2.93 | 8d | 1 | 0.49mi |
| 1137 Croton Ct Weston, FL | 4.0 | 2.5 | 2115 | $5,200 | $2.46 | 17d | 1 | 0.55mi |
| 1118 Chinaberry Dr Weston, FL | 4.0 | 2.0 | 1915 | $4,500 | $2.35 | 17d | 1 | 0.59mi |
| 1118 Chinaberry Dr Weston, FL | 4.0 | 2.0 | 1915 | $4,500 | $2.35 | 24d | 1 | 0.59mi |
| 1319 Croton Ct Weston, FL | 6.0 | 4.0 | 3071 | $6,400 | $2.08 | 17d | 1 | 0.59mi |
| 2002 Schooner Ln Weston, FL | 4.0 | 3.0 | 2505 | $6,450 | $2.57 | 24d | 1 | 0.60mi |
| 1365 Majesty Ter Unit 1365 Weston, FL | 4.0 | 3.5 | 2088 | $5,950 | $2.85 | 24d | 1 | 0.62mi |
| 1983 Harbor View Cir Weston, FL | 5.0 | 4.0 | 3442 | $8,000 | $2.32 | 24d | 1 | 0.64mi |
| 1114 Tupelo Way Weston, FL | 4.0 | 2.5 | 2256 | $7,500 | $3.32 | 24d | 1 | 0.65mi |
| 1114 Tupelo Way Weston, FL | 4.0 | 2.5 | 2256 | $7,500 | $3.32 | 1d | 1 | 0.65mi |
| 1113 Tupelo Way Weston, FL | 4.0 | 2.5 | 2256 | $4,400 | $1.95 | 24d | 1 | 0.67mi |
| 1396 Banyan Way Weston, FL | 5.0 | 3.5 | 2480 | $5,250 | $2.12 | 17d | 1 | 0.72mi |
| 1392 Canary Island Dr Weston, FL | 4.0 | 2.5 | 2088 | $5,800 | $2.78 | 24d | 1 | 0.77mi |
| 1392 Canary Island Dr Weston, FL | 4.0 | 2.0 | 2088 | $5,990 | $2.87 | 19d | 1 | 0.77mi |
| 1374 Canary Island Dr Weston, FL | 4.0 | 3.5 | 2088 | $5,500 | $2.63 | 8d | 1 | 0.79mi |
| 1600 Blue Jay Cir Weston, FL | 4.0 | 2.5 | 2674 | $6,500 | $2.43 | 24d | 1 | 0.80mi |
| 1527 Winterberry Ln Weston, FL | 4.0 | 2.5 | 2240 | $5,200 | $2.32 | 24d | 1 | 0.91mi |
| 2408 Deer Creek Rd Weston, FL | 4.0 | 3.0 | 2674 | $7,100 | $2.66 | 24d | 1 | 0.94mi |
| 2408 Deer Creek Rd Weston, FL | 4.0 | 3.0 | 2674 | $7,100 | $2.66 | 21d | 1 | 0.94mi |
| 2538 Montclaire Ct Weston, FL | 5.0 | 3.5 | 3398 | $9,500 | $2.80 | 15d | 1 | 0.94mi |
| 1702 Sparrow Ln Weston, FL | 4.0 | 3.0 | 2115 | $4,500 | $2.13 | 24d | 1 | 0.97mi |
| 1725 Winterberry Ln Weston, FL | 4.0 | 3.0 | 1997 | $5,500 | $2.75 | 8d | 1 | 1.04mi |
| 1725 Winterberry Ln Weston, FL | 4.0 | 3.0 | 1997 | $5,500 | $2.75 | 24d | 1 | 1.04mi |
| 1725 Winterberry Ln Weston, FL | 4.0 | 3.0 | 1997 | $5,500 | $2.75 | 12d | 1 | 1.04mi |
| 1725 Winterberry Ln Unit 1725 Weston, FL | 4.0 | 3.0 | 1997 | $5,500 | $2.75 | 17d | 1 | 1.04mi |
| 1725 Winterberry Ln Weston, FL | 4.0 | 3.0 | 1997 | $5,500 | $2.75 | 21d | 1 | 1.04mi |
| 2488 Eagle Run Dr Weston, FL | 5.0 | 4.0 | 3446 | $9,900 | $2.87 | 24d | 1 | 1.05mi |
| 1901 Cedar Ct Weston, FL | 4.0 | 2.5 | 1978 | $5,700 | $2.88 | 24d | 1 | 1.09mi |
| 814 Heron Rd Weston, FL | 4.0 | 2.5 | 2313 | $6,000 | $2.59 | 24d | 1 | 1.11mi |
| 618 Willow Bend Rd Unit 618 Weston, FL | 4.0 | 2.5 | 2078 | $4,850 | $2.33 | 24d | 1 | 1.12mi |
HOA detail
- Monthly dues
- $186 · $2,232/yr
- ⚠ Special-assessment mentions
-
Major Price Improvement! Exceptional opportunity in Savanna. Seller has paid the special assessment in full. Spacious 5-bedroom home with primary suite on the first floor, this home offers a functional layout perfect…
Listing history 43 events
-
2026-06-18days on market $749,900 Active 154 DOM
-
2026-06-17days on market $749,900 Active 153 DOM
-
2026-06-16days on market $749,900 Active 152 DOM
-
2026-06-15price $749,900 Active 151 DOM
-
2026-06-15days on market $769,000 Active 151 DOM
-
2026-06-13remarks 699-char remark
-
2026-06-13days on market $769,000 Active 149 DOM
-
2026-06-09days on market $769,000 Active 145 DOM
-
2026-06-07days on market $769,000 Active 143 DOM
-
2026-06-04days on market $769,000 Active 140 DOM
-
2026-06-03days on market $769,000 Active 139 DOM
-
2026-06-02days on market $769,000 Active 138 DOM
-
2026-06-01days on market $769,000 Active 137 DOM
-
2026-05-31days on market $769,000 Active 136 DOM
-
2026-04-29price $789,000
-
2026-04-20price $799,000
-
2026-03-30price $814,000
-
2026-01-15$824,000 Active
-
2025-12-14historical
-
2025-09-29price $849,000
-
2025-09-02price $880,000
-
2025-07-09price $899,000
-
2025-06-23price $925,000
-
2025-06-13price $950,000
-
2025-06-13$959,000 Active
-
2015-07-20historical
-
2015-05-02price $445,000
-
2015-05-02price $450,000
-
2015-02-09price $448,000
-
2015-01-09price $450,000
-
2014-10-29price $470,000
-
2014-10-11price $475,000
-
2014-09-05price $480,000
-
2014-08-27price $485,000
-
2014-08-21price $495,000
-
2014-08-18$510,000 Active
-
2013-12-19historical
-
2013-10-04status Active
-
2013-10-01historical
-
2013-09-23$445,000 Active
-
2011-04-28soldstatus $359,900
-
2007-01-18soldstatus $528,900
-
2003-01-24soldstatus $275,000
ⓘ Source: listings_history table (triggers on properties + properties_extension) + one-shot
backfill from property_details.listing_events for pre-trigger history.
Tax reassessment forecast FL · Resets to sale price
- Current annual tax
- $8,067 · $672/mo
- Projected year-2 tax
- $8,067 · $672/mo
- Expected delta
- $0/yr ($0/mo · 0.0%)
ⓘ Screening estimate from a state-policy table — verify with the county assessor before closing.
Climate risk First Street
- Flood 1/10 Low FEMA zone X (shaded) · 0% chance over 30 yrs
- Wildfire 3/10 Moderate
- Heat 9/10 Extreme 7 d/yr ≥107°F today · 25 d/yr by 30 yrs out
- Wind 10/10 Extreme 99% chance of damaging wind over 30 yrs
- Air quality 2/10 Low 2 unhealthy d/yr today · 2 by 30 yrs out
Nearby sold comps map
Loading sold comps map…
Walkable amenities ~0.75 mi
Loading nearby amenities…
Taxation est. · year 1
- Rental income
- $79,017
- − Mortgage interest
- −$42,006
- − Property taxes
- −$8,067
- − Insurance
- −$3,750
- − Repairs & maintenance
- −$6,321
- − Management
- −$6,321
- − HOA
- −$2,232
- − Depreciation
- −$21,815
- Taxable loss
- −$11,495
- Est. tax savings @ 24.0%
- +$2,759
- After-tax cash flow
- $3,943/yr
For passive investors: Depreciation is non-cash, so a rental often shows a tax loss while cash-flowing — sheltering income. Rental losses are passive: they offset passive income freely, and up to $25,000/yr can offset ordinary (W-2) income if you actively participate and your MAGI is under $100k (phasing out to $0 by $150k); unused losses carry forward. On sale, claimed depreciation is recaptured at up to 25%, and gains may owe capital-gains tax (a 1031 exchange can defer both). Figures are a year-1 estimate at your 24.0% rate — not tax advice; consult a CPA.
Schools (NCES district)
- District
- Broward
- NCES district ID
- 1200180
- Math proficiency
- 42% ▼ -18.00%
- Reading proficiency
- 53% ▼ -5.00%
- Median HH income
- $52,139
- Composite
- 40.88/100
- National rank
- #3621
- State rank
- #46 of 73 in FL
Livability — Weston
- Score
- 67/100
- State rank
- #546
- US rank
- #10241
Category grades
Schools grade is shown separately in the Schools card above.
Census & demographics
- Census place
- Weston, FL
- County
- Broward County · 1,963,430 people
- City population
- 68,003
- Metro
- Miami-Fort Lauderdale-Pompano Beach, FL
- Population (ZIP)
- 23,203
- Household income
- $159,388
- Rent vs Own
- Severe rent burden
- 574.0
Population outlook (Broward County) Hauer SSP2
- Today (2025)
- 2,207,033 people
- By 2030
- 2,360,704 · +7.0%
- By 2040
- 2,661,208 · +20.6%
- By 2050
- 2,946,698 · +33.5%
- By 2075
- 3,602,273 · +63.2%
- By 2100
- 3,970,984 · +79.9%
Race, ethnicity, and origin ACS 2023
- Neighborhood character
- Diverse neighborhood (Simpson 0.62)
- Race & ethnicity
- Hispanic / Latino 55% Two or more races 40% White 26% Asian 10% Black 4%
- Hispanic origin (detail)
- Mexican 3% Puerto Rican 9% Cuban 4% Salvadoran 5%
- Common ancestry
- Estonian 2% Romanian 2% Russian 2%
- Foreign-born
- 55% · Canada, Jamaica, Dominican Republic
- Languages at home
- 25% English-only · Spanish 56% Other Indo-European 10% Chinese 5%
Political lean MEDSL · Broward
- 2024 margin
- D (+17.0) · D 58.0% · R 41.0%
- 2008→2024 swing
- -17.8pp toward R · 2008: 34.7pp · 2024: 17.0pp
- All cycles
- 2024: D+17.0 2020: D+29.8 2016: D+35.0 2012: D+34.9 2008: D+34.7
Not yet ingested
- Civics
- —
Market trends
- HPI YoY
- ▲ 0.76%
- Current HPI
- 297.972
- Rent YoY
- ▲ 2.41%
- Metro
- Miami-Fort Lauderdale-Pompano Beach, FL
- State GDP YoY
- ▲ 3.28%
- F500 in state
- 36
Industry mix (Fortune 500 HQ in FL)
| Industry | F500 HQs | Revenue |
|---|---|---|
| Industrial Technology | 2 | $29B |
|
||
| Insurance | 2 | $17B |
|
||
| Retail | 1 | $60B |
|
||
| Technology Distribution | 1 | $58B |
|
||
| Homebuilding | 1 | $35B |
|
||
| Technology Manufacturing | 1 | $35B |
|
||
Price history
+186.9% since first listed29 events — show timeline
- 2026-04-29 Price Changed $789,000 MARMLS
- 2026-04-20 Price Changed $799,000 MARMLS
- 2026-03-30 Price Changed $814,000 MARMLS
- 2026-01-15 Listed $824,000 MARMLS
- 2025-12-14 Listing Removed — MARMLS
- 2025-09-29 Price Changed $849,000 MARMLS
- 2025-09-02 Price Changed $880,000 MARMLS
- 2025-07-09 Price Changed $899,000 MARMLS
- 2025-06-23 Price Changed $925,000 MARMLS
- 2025-06-13 Price Changed $950,000 MARMLS
- 2025-06-13 Listed $959,000 MARMLS
- 2015-07-20 Listing Removed — MARMLS
- 2015-05-02 Price Changed $450,000 MARMLS
- 2015-05-02 Price Changed $445,000 MARMLS
- 2015-02-09 Price Changed $448,000 MARMLS
- 2015-01-09 Price Changed $450,000 MARMLS
- 2014-10-29 Price Changed $470,000 MARMLS
- 2014-10-11 Price Changed $475,000 MARMLS
- 2014-09-05 Price Changed $480,000 MARMLS
- 2014-08-27 Price Changed $485,000 MARMLS
- 2014-08-21 Price Changed $495,000 MARMLS
- 2014-08-18 Listed $510,000 MARMLS
- 2013-12-19 Listing Removed — MARMLS
- 2013-10-04 Relisted — MARMLS
- 2013-10-01 Listing Removed — MARMLS
- 2013-09-23 Listed $445,000 MARMLS
- 2011-04-28 Sold (Public Records) $359,900 Public Records
- 2007-01-18 Sold (Public Records) $528,900 Public Records
- 2003-01-24 Sold (Public Records) $275,000 Public Records
Property tax history
+2.4%/yrLatest (2025): $8,067 · +3.1% YoY. Source: county tax records.
Cash-flow waterfall
monthlySold comps — $/sqft
last 12 mo · ≤1 miLoading sold comps…