7721 N 60th St #102 · Milwaukee, WI
Flood risk 1/10 · Minimal
- FEMA flood zone
- X (unshaded)
- Chance of flooding over 30 yrs
- 0.0%
- Est. flood insurance / yr
- $507 – $1,088
Fire risk 1/10 · Minimal
- Est. fire insurance / yr
- $636 – $1,182
Heat risk 2/10 · Minimal
- Hot days now (above 99°F)
- 7 days/yr
- Hot days in 30 yrs
- 13 days/yr
Wind risk 2/10 · Minimal
- Chance of severe wind over 30 yrs
- —
Air-quality risk 2/10 · Minimal
- Unhealthy air days now
- 1 days/yr
- Unhealthy air days in 30 yrs
- 2 days/yr
Risk factors via First Street. Map © Google.
Why this score? — see what drove the B- grade
The composite is a weighted blend of 9 inputs, each scored 0–100. Each bar is that input's sub-score; the figure is the points it added to the 100-point composite (weight × sub-score).
- Cash flow +29.1/30.0
- 1% rule +10.0/10.0
- DSCR +10.0/10.0
- ARV discount +7.5/15.0
- Livability +4.0/5.0
- Rent growth +2.5/5.0
- Condition / age +2.2/5.0
- Schools +1.2/10.0
- Appreciation +0.0/10.0
$68,000
🖨 Deal sheet 📄 Offer letter ✓ Due diligence
Listing remarks MLS
Handyman or Investor special! Bring your rehab ideas to this affordable first level 2 bedroom, 2 bath condo! Master bedroom has nice walk in closet and master bath. Large living and dining room. Great potential here for homeowner or investor. Units can be rented! Lower level of building includes assigned storage area and coin operated washers and dryers. This condo is being sold AS IS
Key facts
- Private balcony
- Community amenities
- $350 HOA
Tags
Property features AI
Finance
- HOA & community: Monthly condo fee of $350; Association laundry facilities; Building contains 8 units; association totals 120 units
Exterior
- Parking: Assigned surface parking
- Utilities: Municipal water; Municipal sewer; Natural gas heating fuel; Window/wall air conditioning
- Home design: Condo in a 2-story building; Unit is single-story (1 story unit)
- Construction: Condo in The Chalet subdivision; Zoning: RM1; Information on year built from assessor/public record
- Exterior features: Balcony; Brick, brick/stone and vinyl exterior
Interior
- Kitchen: Refrigerator; Oven/Range; Dishwasher
- Bedrooms: Main-level primary bedroom, approximately 12 x 14; Main-level second bedroom, approximately 11 x 12
- Bathrooms: Two full bathrooms; Master bathroom with walk-in shower; Secondary bath with shower over tub
- Interior features: High-speed internet
- Laundry & utility: Community laundry facilities
Neighborhood map
What this means for you Summary
Snapshot
- This is a 2-bed/2.0-bath condo listed at $68k. Condition is rated fair.
Deal economics
- At list price, monthly cash flow is $235 ($3k/yr) — positive.
- The deal already cash-flows at list — no discount required.
- Meets the 1% rule at list price ($1k rent vs $68k).
- Cap rate 10.4% vs local median 5.1% in Milwaukee — top-decile yield for the area; either an underpriced asset or a hidden risk that comps aren't pricing in. Stress-test before assuming the spread holds.
Location & tenants
- Location reads 81/100 on livability (#55 in WI, #1,534 nationally) — a professional / high-income tenant draw. Strengths: amenities A+, commute A+, cost of living A+; Watch: employment D+, crime F.
- Milwaukee School District (urban): math 10% / reading 18% proficiency, ranked #337 of 342 in WI (top 98%) — low school quality limits family demand, transient renter base, plan for 1-2y turnover; 77% free/reduced lunch — lower-income household profile, screen leases tightly.
- Zoned schools: Vincent High (math 10% / reading 10%, grade F, #440 of 483 statewide, top 95%, 685 students, 83% FRL).
- Market conditions: 46 active listings in the ZIP; 13 comparable units currently listed for rent nearby; rentals at typical pace (median 14d on market — plan ~3-4 weeks tenant-placement turnaround); 1,017 units permitted in Milwaukee County in 2024 (803 in 5+ unit buildings).
Forward outlook
- Local home prices are declining (-3.0%/yr); year-one equity from $470 of loan paydown is wiped out by about $2k of value loss. Plan a longer hold.
- Milwaukee County population projected at +4% by 2050 — modest demand growth; plan on rents tracking national, not racing it.
- At projected returns (-3.0% appreciation + 3.0% rent growth), your $19k cash investment doubles in ~8 years — after that, you're playing with house money.
Negotiation context
- Only 11 days on market — expect competitive offers; lowballing is unlikely to land.
- 2 sale attempts since 2y ago with the ask held roughly flat each time — persistent listings suggest the price (not the market) is what's stuck; bring a comps-based counter.
- Current owner paid $42k; list at $68k implies a 60% gain — meaningful room to come down on a strong offer.
Risks & watch-outs
- Watch-outs: HOA is 26% of rent.
Questions for the listing agent
- Have any recent inspections been done? Can we get a copy of the seller's disclosures and any deferred-maintenance estimates?
- Built in 1972 — when were the roof, HVAC, electrical panel, plumbing, and water heater last replaced?
- What does the HOA fee cover, when was the last increase, and are there any pending special assessments or reserve-fund shortfalls?
- Any open or pending special assessments — roof, HVAC, plumbing, elevator, façade? What's the per-unit balance and payoff schedule, and is the seller paying it off at close or rolling it to the buyer?
- Is there a deadline driving the sale (1031 exchange, divorce, estate, relocation)? That informs how much negotiation room exists.
- Schools are F-rated, which usually means shorter tenancies and higher turnover. Who's the typical renter profile here, and what's been the actual vacancy rate?
- Crime grade is F in this area — have there been break-ins, vandalism, or insurance claims at this property in the last 3 years? What carrier currently insures it and at what premium?
- What's the average days-on-market for RENTAL listings here right now (not sales)? A rising rental-DOM trend means longer vacancies and softer asking-rent achievability than the comps imply.
- What's the recent tenant-quality profile in this submarket — average credit score on applications, eviction rate, late-payment / NSF rate, and stable-employment percentage? A property-management company in the area should have these aggregated.
- How much new apartment / multifamily construction is in the pipeline within 1–3 miles? Heavy new supply (>2% of stock underway) typically softens rents 12–24 months out; light construction supports rent growth.
Investment metrics
- 1% rule
- 1.96% ✓
- Cap rate
- 10.44%
- Cash-on-cash
- 14.83%
- DSCR
- 1.66
- GRM
- 4.2
CMA / ARV
No comps found within radius.
Projected returns pro-forma
-3.0% appreciation · 3.0% rent growth · sell at horizon
- IRR
- 5.7%
- Equity multiple
- 1.22×
- Total profit
- $4,199
- Equity at exit
- $10,139
- IRR
- 15.3%
- Equity multiple
- 2.26×
- Total profit
- $23,904
- Equity at exit
- $5,879
Cash invested: $19,040 (down + closing). Projections, not guarantees.
Landlord ↔ Tenant lean methodology
- Overall (STATE)
- 73 Landlord-Friendly
- State Wisconsin
- 73 Landlord-Friendly · R+2
- County
- — inherits STATE
- City
- — inherits STATE
ZIP-level market 53223
- Home prices YoY
- -27.7%
- Active inventory
- 46
- Price-to-rent
- 4.2×
Monthly cashflow live
- Estimated rent
- $1,336 high interval (Pro) →
- Mortgage (P&I)
- −$357
- Tax est. 1.5%
- −$85 /mo · $1,020/yr
- Insurance
- −$28
- HOA
- −$350
- Vacancy / Maint / Mgmt
- −$280
- Net cashflow
- $235
Break-even live
UW: 25.0% down · 7.5% · 30yr · 1.5% tax · 5.0% vac · 8.0% maint · 8.0% mgmt
Financing live
Cash to close
- Down payment
- $17,000
- Closing costs
- $2,040
- Reserves months
- —
- Total cash needed
- —
Loan-product check · same deal, 3 products live
Conventional
25% down · 7.5% · 30yr
- Down + closing
- —
- Monthly P&I
- —
- Monthly cashflow
- —
- DSCR
- —
- Eligible?
- —
Personal DTI + credit; lowest rate.
DSCR
20% down · 8.5% · 30yr
- Down + closing
- —
- Monthly P&I
- —
- Monthly cashflow
- —
- DSCR
- —
- Eligible?
- —
No personal income docs; deal must DSCR.
Hard money
10% down · 12.0% · 12mo
- Down + closing
- —
- Monthly P&I
- —
- Monthly cashflow
- —
- DSCR
- —
- Eligible?
- —
Short-term bridge; refi at stabilization.
Rent comps 13 comps
| Address | Beds | Baths | Sqft | Rent | $/sqft | DOM | Units | Dist |
|---|---|---|---|---|---|---|---|---|
| 6011 W Port Ave Apt 203H Milwaukee, WI | 1.0 | 1.0 | 725 | $995 | $1.37 | 43d | 1 | 0.04mi |
| 6401 W Bradley Rd Milwaukee, WI | 1.0–3.0 | 1.0–2.5 | 882 | $1,475 | $1.67 | 1d | 2 | 0.39mi |
| 5005 W Bradley Rd Milwaukee, WI | 2.0 | 1.0 | 1149 | $1,299 | $1.13 | 43d | 1 | 0.73mi |
| 5005 W Bradley Rd Milwaukee, WI | 2.0 | 1.0 | 1064 | $1,299 | $1.22 | 14d | 2 | 0.73mi |
| 5829 W Helena St Milwaukee, WI | 3.0 | 2.0 | 1212 | $2,200 | $1.82 | 10d | 1 | 0.82mi |
| 5401 W Presidio Ln Milwaukee, WI | 2.0 | 2.0 | 1200 | $1,685 | $1.40 | 1d | 13 | 0.88mi |
| 7290 W Dean Rd Milwaukee, WI | 2.0 | 1.0–1.5 | 625 | $1,545 | $2.47 | 1d | 8 | 1.12mi |
| 7300 W Dean Rd Milwaukee, WI | 1.0–2.0 | 1.0–1.5 | 850 | $1,545 | $1.82 | 2d | 8 | 1.23mi |
| 6762 N 52nd St Milwaukee, WI | 2.0 | 2.0 | 1309 | $1,500 | $1.15 | 14d | 1 | 1.29mi |
| 6951 N 76th St Apt 112 Milwaukee, WI | 2.0 | 1.0 | 1025 | $1,100 | $1.07 | 23d | 1 | 1.35mi |
| 7601 W Donna Ct #1 Milwaukee, WI | 2.0 | 1.5 | 872 | $1,250 | $1.43 | 23d | 1 | 1.36mi |
| 4127 W Kiley Ave Unit A Milwaukee, WI | 3.0 | 1.0 | 1025 | $1,250 | $1.22 | 43d | 1 | 1.44mi |
| 6535 N 58th St Milwaukee, WI | 2.0 | 1.0 | 962 | $1,195 | $1.24 | 16d | 1 | 1.47mi |
HOA detail condo
- Monthly dues
- $350 · $4,200/yr
- Assessments
- None detected in remarks — confirm with the listing agent.
Listing history 9 events
-
2026-06-18days on market $68,000 Active 11 DOM
-
2026-06-17days on market $68,000 Active 10 DOM
-
2026-06-16days on market $68,000 Active 9 DOM
-
2026-06-15days on market $68,000 Active 8 DOM
-
2026-06-13days on market $68,000 Active 6 DOM
-
2026-06-13days on market $68,000 Active 5 DOM
-
2026-06-09days on market $68,000 Active 2 DOM
-
2026-06-08remarks 438-char remark
-
2026-06-08$68,000 Active 1 DOM
ⓘ Source: listings_history table (triggers on properties + properties_extension) + one-shot
backfill from property_details.listing_events for pre-trigger history.
Climate risk First Street
- Flood 1/10 Low FEMA zone X (unshaded) · 0% chance over 30 yrs
- Wildfire 1/10 Low
- Heat 2/10 Low 7 d/yr ≥99°F today · 13 d/yr by 30 yrs out
- Wind 2/10 Low
- Air quality 2/10 Low 1 unhealthy d/yr today · 2 by 30 yrs out
Nearby sold comps map
Loading sold comps map…
Walkable amenities ~0.75 mi
Loading nearby amenities…
Taxation est. · year 1
- Rental income
- $16,028
- − Mortgage interest
- −$3,809
- − Property taxes
- −$1,020
- − Insurance
- −$340
- − Repairs & maintenance
- −$1,282
- − Management
- −$1,282
- − HOA
- −$4,200
- − Depreciation
- −$1,978
- Taxable income
- $2,116
- Est. tax owed @ 24.0%
- −$508
- After-tax cash flow
- $2,315/yr
For passive investors: Depreciation is non-cash, so a rental often shows a tax loss while cash-flowing — sheltering income. Rental losses are passive: they offset passive income freely, and up to $25,000/yr can offset ordinary (W-2) income if you actively participate and your MAGI is under $100k (phasing out to $0 by $150k); unused losses carry forward. On sale, claimed depreciation is recaptured at up to 25%, and gains may owe capital-gains tax (a 1031 exchange can defer both). Figures are a year-1 estimate at your 24.0% rate — not tax advice; consult a CPA.
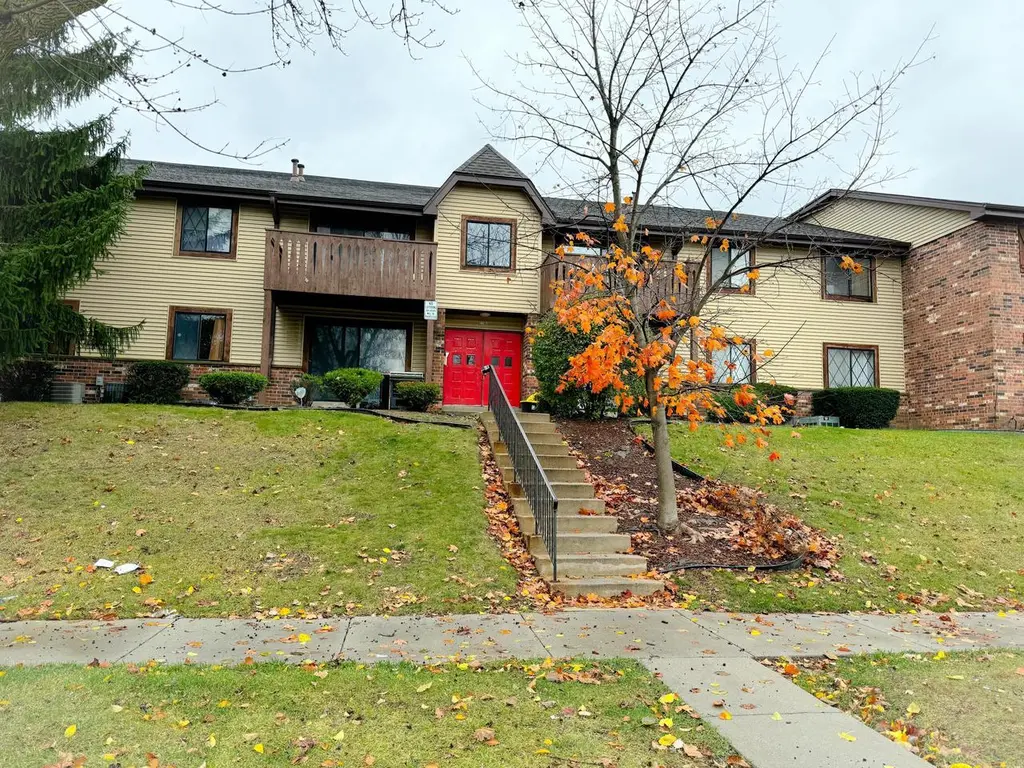
Condition & rehab AI · 1 photo
This condo requires significant exterior and interior repairs, including painting and landscaping, to improve its condition and value.
Repairs flagged
- Major siding — Severe weathering and peeling
- Major paint — Peeling and general wear
- Major landscaping — Overgrown lawn and debris
Value-add opportunities
- Both painting and repainting — Fresh paint can significantly improve curb appeal and interior aesthetics
- Both landscaping and yard maintenance — A well-maintained yard can enhance curb appeal and attract potential buyers
- Both roof inspection — Ensuring the roof is in good condition can prevent costly repairs and improve the home's value
Renovation cost estimate screening
| Repair item | Severity | Est. cost |
|---|---|---|
| siding · Severe weathering and peeling | Major | $15,000–50,000 |
| paint · Peeling and general wear | Major | $15,000–50,000 |
| landscaping · Overgrown lawn and debris | Major | $15,000–50,000 |
| Total estimated repair cost · 3 items | $45,000–150,000 |
Value-add ROI direction
- Both painting and repainting — Fresh paint can significantly improve curb appeal and interior aesthetics ↑
- Both landscaping and yard maintenance — A well-maintained yard can enhance curb appeal and attract potential buyers ↑
- Both roof inspection — Ensuring the roof is in good condition can prevent costly repairs and improve the home's value ↑
ⓘ Cost ranges are severity-bucket heuristics (US national rule-of-thumb). Get contractor quotes + a written scope before underwriting a rehab budget.
Schools (NCES district)
- District
- Milwaukee School District
- NCES district ID
- 5509600
- Math proficiency
- 10% ▼ -5.00%
- Reading proficiency
- 18% ▬ 0.00%
- Median HH income
- $36,339
- Composite
- 11.61/100
- National rank
- #9696
- State rank
- #337 of 342 in WI
Livability — Milwaukee
- Score
- 81/100
- State rank
- #55
- US rank
- #1534
Category grades
Schools grade is shown separately in the Schools card above.
Census & demographics
- Census place
- Milwaukee, WI
- County
- Milwaukee County · 926,379 people
- City population
- 573,768
- Metro
- Milwaukee-Waukesha, WI
- Population (ZIP)
- 28,793
- Household income
- $60,839
- Rent vs Own
- Severe rent burden
- 1084.0
Population outlook (Milwaukee County) Hauer SSP2
- Today (2025)
- 995,758 people
- By 2030
- 1,009,124 · +1.3%
- By 2040
- 1,028,128 · +3.3%
- By 2050
- 1,040,066 · +4.4%
- By 2075
- 1,057,849 · +6.2%
- By 2100
- 1,039,774 · +4.4%
Race, ethnicity, and origin ACS 2023
- Neighborhood character
- Diverse neighborhood (Simpson 0.59)
- Race & ethnicity
- Black 57% White 29% Asian 6% Two or more races 5% Hispanic / Latino 4%
- Common ancestry
- Romanian 3% Portuguese 1% Lithuanian 1%
- Foreign-born
- 7% · Canada
- Languages at home
- 89% English-only · Other Asian/Pacific 4% Spanish 2% French/Haitian/Cajun 1%
Political lean MEDSL · Milwaukee
- 2024 margin
- Solid D (+38.5) · D 68.3% · R 29.8% · Other 1.8%
- 2008→2024 swing
- +2.7pp toward D · 2008: 35.9pp · 2024: 38.5pp
- All cycles
- 2024: D+38.5 2020: D+39.9 2016: D+37.5 2012: D+34.6 2008: D+35.9
Not yet ingested
- Civics
- —
Market trends
- HPI YoY
- ▼ -108.51%
- Current HPI
- 283.4147
- Rent YoY
- —
- Metro
- Milwaukee-Waukesha, WI
- State GDP YoY
- ▲ 2.10%
- F500 in state
- 20
Industry mix (Fortune 500 HQ in WI)
| Industry | F500 HQs | Revenue |
|---|---|---|
| Industrial Machinery | 4 | $23B |
|
||
| Industrial Technology | 2 | $36B |
|
||
| Insurance | 1 | $36B |
|
||
| Professional Services | 1 | $19B |
|
||
| Utilities | 1 | $9B |
|
||
| Consumer Goods | 1 | $3B |
|
||
Price history
+60.0% since first listed4 events — show timeline
- 2026-06-07 Listed $68,000 METROMLS
- 2025-01-03 Sold (MLS) $42,500 METROMLS
- 2024-11-27 Contingent — METROMLS
- 2024-11-22 Listed $42,500 METROMLS
Cash-flow waterfall
monthlySold comps — $/sqft
last 12 mo · ≤1 miLoading sold comps…