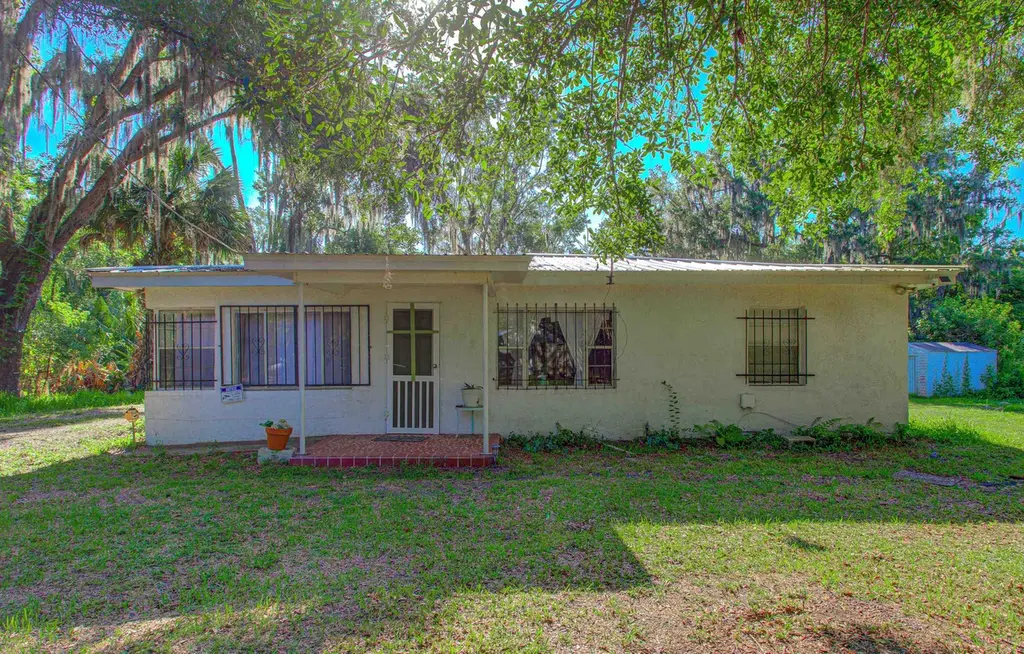
309 Hatten Ln · Hastings, FL
Flood risk 4/10 · Minor
- FEMA flood zone
- X (unshaded)
- Chance of flooding over 30 yrs
- 0.13%
- Est. flood insurance / yr
- $507 – $1,088
Fire risk 3/10 · Minor
- Est. fire insurance / yr
- $947 – $1,759
Heat risk 9/10 · Severe
- Hot days now (above 107°F)
- 7 days/yr
- Hot days in 30 yrs
- 20 days/yr
Wind risk 9/10 · Severe
- Chance of severe wind over 30 yrs
- 99.0%
Air-quality risk 2/10 · Minimal
- Unhealthy air days now
- 2 days/yr
- Unhealthy air days in 30 yrs
- 2 days/yr
Risk factors via First Street. Map © Google.
Why this score? — see what drove the A- grade
The composite is a weighted blend of 9 inputs, each scored 0–100. Each bar is that input's sub-score; the figure is the points it added to the 100-point composite (weight × sub-score).
- Cash flow +27.0/30.0
- ARV discount +15.0/15.0
- Appreciation +10.0/10.0
- DSCR +9.4/10.0
- 1% rule +6.4/10.0
- Schools +6.4/10.0
- Livability +3.6/5.0
- Rent growth +2.5/5.0
- Condition / age +2.5/5.0
$169,000
🖨 Deal sheet (PDF) 📄 Offer letter ✓ Due diligence
Listing remarks MLS
Owner Financing available with terms consisting of minimum of 10% down payment.
Key facts
- Combined homesite
- End of the street
- Expansive property
Tags
Property features AI
Finance
- Other: Directions: From N Main St turn left (South) on W Ashland Ave. Turn right on Daniels St, then right on Hatten Ln. Go to the end of the road and park on the side of the house.
- Financial info: Tax year 2025
Exterior
- Utilities: County water; Septic system
- Home design: Single-story (ground level) residence
- Construction: Concrete block construction; Metal/Tin roof
- Exterior features: Screened porch; Located on a cul-de-sac; Approximately 0.54 acre lot
Interior
- Bedrooms: Primary bedroom on the first floor
- Bathrooms: 2 bathrooms
- Heating & cooling: Central heating; Central air conditioning
- Interior features: Ground-level entry; Crawlspace substructure
Neighborhood map
What this means for you Summary
Snapshot
- This is a 5-bed/2.0-bath single-family listed at $169k.
Deal economics
- At list price, monthly cash flow is $475 ($6k/yr) — positive.
- The deal already cash-flows at list — no discount required.
- Meets the 1% rule at list price ($2k rent vs $169k).
- Cap rate 9.7% vs local median 2.7% in Hastings — top-decile yield for the area; either an underpriced asset or a hidden risk that comps aren't pricing in. Stress-test before assuming the spread holds.
Location & tenants
- Location reads 71/100 on livability (#410 in FL) — a middle-class / working-renter tenant base. Strengths: crime A+, cost of living A+, housing A+; Watch: employment D+, schools F, amenities F.
- St. Johns (rural): math 75% / reading 73% proficiency, ranked #2 of 73 in FL (top 3%) — strong family-tenant draw, lease renewals of 3-5y typical; only 20% free/reduced lunch — higher-income household profile.
- Market conditions: 235 active listings in the ZIP; 5,575 units permitted in St. Johns County in 2024 (584 in 5+ unit buildings).
Forward outlook
- In year one you build about $18k of equity ($1k loan paydown + $17k appreciation (10.0% local appreciation)).
- St. Johns County population projected at +60% by 2050 — long-run rental-demand tailwind backs the buy-and-hold thesis.
- At projected returns (10.0% appreciation + 3.0% rent growth), your $47k cash investment doubles in ~2 years — after that, you're playing with house money.
- By year 3, paydown + projected appreciation supports a ~$46k cash-out refi (75% LTV) — recoverable capital for the next deal without selling this one.
Negotiation context
- Only 9 days on market — expect competitive offers; lowballing is unlikely to land.
- 9 sale attempts since 3y ago with the ask held roughly flat each time — persistent listings suggest the price (not the market) is what's stuck; bring a comps-based counter.
- Current owner paid $87k; list at $169k implies a 94% gain — meaningful room to come down on a strong offer.
Risks & watch-outs
- Watch-outs: built in 1954 — expect roof / HVAC / electrical / plumbing capex.
- Climate carrying-cost: severe wind risk, 99% chance of damaging wind over 30y; extreme-heat days projected 7→20/yr by 2055 (HVAC capex compounding) — expect insurance premiums to compound above CPI over the hold.
Questions for the listing agent
- Built in 1954 — when were the roof, HVAC, electrical panel, plumbing, and water heater last replaced?
- Is there a deadline driving the sale (1031 exchange, divorce, estate, relocation)? That informs how much negotiation room exists.
- Schools are F-rated, which usually means shorter tenancies and higher turnover. Who's the typical renter profile here, and what's been the actual vacancy rate?
- What's the average days-on-market for RENTAL listings here right now (not sales)? A rising rental-DOM trend means longer vacancies and softer asking-rent achievability than the comps imply.
- What's the recent tenant-quality profile in this submarket — average credit score on applications, eviction rate, late-payment / NSF rate, and stable-employment percentage? A property-management company in the area should have these aggregated.
- How much new for-sale + rental construction is in the pipeline within 1–3 miles? Heavy new supply typically softens prices + rents 12–24 months out; constrained supply supports both.
Investment metrics
- 1% rule
- 1.14% ✓
- Cap rate
- 9.67%
- Cash-on-cash
- 12.04%
- DSCR
- 1.54
- GRM
- 7.3
CMA / ARV
- ARV (on-the-fly)
- $278,278
- Comps found
- 1
Show comp detail 1 sale within ~0.75 mi
| Address | Dist | Beds/Ba | Sqft | Sold | Price | $/sf | Match |
|---|---|---|---|---|---|---|---|
| 205 E Cochran Ave | 0.38mi | 4/2.0 (-1) | 1,714 (-14%) | 8mo | $238,000 | $139 | 47 |
Match score weights: distance 35% · size 25% · config 20% · recency 20%. Top-matched comps best support the ARV.
Projected returns pro-forma
10.0% appreciation · 3.0% rent growth · sell at horizon
- IRR
- 33.1%
- Equity multiple
- 3.58×
- Total profit
- $122,246
- Equity at exit
- $152,249
- IRR
- 28.6%
- Equity multiple
- 8.10×
- Total profit
- $336,121
- Equity at exit
- $328,330
Cash invested: $47,320 (down + closing). Projections, not guarantees.
Landlord ↔ Tenant lean methodology
- Overall (STATE)
- 87 Strongly Landlord-Friendly
- State Florida
- 87 Strongly Landlord-Friendly · R+3
- County
- — inherits STATE
- City
- — inherits STATE
ZIP-level market 32145
- Home prices YoY
- 19.1%
- Active inventory
- 235
- Price-to-rent
- 7.3×
Monthly cashflow live
- Estimated rent
- $1,930 medium interval (Pro) →
- Mortgage (P&I)
- −$886
- Tax from tax record
- −$93 /mo · $1,115/yr
- Insurance
- −$70
- HOA
- −$0
- Vacancy / Maint / Mgmt
- −$405
- Net cashflow
- $475
Break-even live
Sensitivity live
| Price | -10% $571 | -5% $523 | +0% $475 | +5% $427 | +10% $379 |
|---|---|---|---|---|---|
| Rent | -10% $322 | -5% $399 | +0% $475 | +5% $551 | +10% $627 |
| Rate | -1.0pp $560 | -0.5pp $518 | base $475 | +0.5pp $431 | +1.0pp $387 |
UW: 25.0% down · 7.5% · 30yr · 1.5% tax · 5.0% vac · 8.0% maint · 8.0% mgmt
Financing live
Cash to close
- Down payment
- $42,250
- Closing costs
- $5,070
- Reserves months
- —
- Total cash needed
- —
Loan-product check · same deal, 3 products live
Conventional
25% down · 7.5% · 30yr
- Down + closing
- —
- Monthly P&I
- —
- Monthly cashflow
- —
- DSCR
- —
- Eligible?
- —
Personal DTI + credit; lowest rate.
DSCR
20% down · 8.5% · 30yr
- Down + closing
- —
- Monthly P&I
- —
- Monthly cashflow
- —
- DSCR
- —
- Eligible?
- —
No personal income docs; deal must DSCR.
Hard money
10% down · 12.0% · 12mo
- Down + closing
- —
- Monthly P&I
- —
- Monthly cashflow
- —
- DSCR
- —
- Eligible?
- —
Short-term bridge; refi at stabilization.
Listing history 7 events
-
2026-06-21days on market $169,000 Active 9 DOM
-
2026-06-18days on market $169,000 Active 6 DOM
-
2026-06-17days on market $169,000 Active 5 DOM
-
2026-06-16days on market $169,000 Active 4 DOM
-
2026-06-15days on market $169,000 Active 3 DOM
-
2026-06-13remarks 699-char remark
-
2026-06-13$169,000 Active 1 DOM
ⓘ Source: listings_history table (triggers on properties + properties_extension) + one-shot
backfill from property_details.listing_events for pre-trigger history.
Tax reassessment forecast FL · Resets to sale price
- Current annual tax
- $1,115 · $93/mo
- Projected year-2 tax
- $1,403 · $117/mo
- Expected delta
- +$288/yr (+$24/mo · 25.8%)
ⓘ Screening estimate from a state-policy table — verify with the county assessor before closing.
Climate risk First Street
- Flood 4/10 Moderate FEMA zone X (unshaded) · 13% chance over 30 yrs
- Wildfire 3/10 Moderate
- Heat 9/10 Extreme 7 d/yr ≥107°F today · 20 d/yr by 30 yrs out
- Wind 9/10 Extreme 99% chance of damaging wind over 30 yrs
- Air quality 2/10 Low 2 unhealthy d/yr today · 2 by 30 yrs out
Nearby sold comps map
Loading sold comps map…
Walkable amenities ~0.75 mi
Loading nearby amenities…
Taxation est. · year 1
- Rental income
- $23,157
- − Mortgage interest
- −$9,467
- − Property taxes
- −$1,115
- − Insurance
- −$845
- − Repairs & maintenance
- −$1,853
- − Management
- −$1,853
- − Depreciation
- −$4,916
- Taxable income
- $3,109
- Est. tax owed @ 24.0%
- −$746
- After-tax cash flow
- $4,953/yr
For passive investors: Depreciation is non-cash, so a rental often shows a tax loss while cash-flowing — sheltering income. Rental losses are passive: they offset passive income freely, and up to $25,000/yr can offset ordinary (W-2) income if you actively participate and your MAGI is under $100k (phasing out to $0 by $150k); unused losses carry forward. On sale, claimed depreciation is recaptured at up to 25%, and gains may owe capital-gains tax (a 1031 exchange can defer both). Figures are a year-1 estimate at your 24.0% rate — not tax advice; consult a CPA.
Schools (NCES district)
- District
- St. Johns
- NCES district ID
- 1201740
- Math proficiency
- 75% ▼ -5.00%
- Reading proficiency
- 73% ▼ -2.00%
- Median HH income
- $66,842
- Composite
- 64.31/100
- National rank
- #556
- State rank
- #2 of 73 in FL
Livability — Hastings
- Score
- 71/100
- State rank
- #410
- US rank
- #7309
Category grades
Schools grade is shown separately in the Schools card above.
Census & demographics
- Census place
- Hastings, FL
- Population (ZIP)
- 5,750
Population outlook (St. Johns County) Hauer SSP2
- Today (2025)
- 303,941 people
- By 2030
- 342,590 · +12.7%
- By 2040
- 417,328 · +37.3%
- By 2050
- 487,011 · +60.2%
- By 2075
- 635,395 · +109.1%
- By 2100
- 717,469 · +136.1%
Race, ethnicity, and origin ACS 2023
- Neighborhood character
- Predominantly White (76%)
- Race & ethnicity
- White 76% Two or more races 16% Hispanic / Latino 9% Black 7%
- Hispanic origin (detail)
- Mexican 8%
- Common ancestry
- Lithuanian 3% Romanian 3% Estonian 3%
- Foreign-born
- 12% · Canada
- Languages at home
- 86% English-only · Spanish 9% Other Indo-European 5%
Political lean MEDSL · St. Johns
- 2024 margin
- Solid R (+31.4) · D 33.9% · R 65.2%
- 2008→2024 swing
- +0.2pp no change · 2008: -31.6pp · 2024: -31.4pp
- All cycles
- 2024: R+31.4 2020: R+26.7 2016: R+33.4 2012: R+37.8 2008: R+31.6
Not yet ingested
- Civics
- —
Market trends
- HPI YoY
- ▲ 40.24%
- Current HPI
- 250.8035
- Rent YoY
- —
- Metro
- —
- State GDP YoY
- ▲ 3.28%
- F500 in state
- 36
Industry mix (Fortune 500 HQ in FL)
| Industry | F500 HQs | Revenue |
|---|---|---|
| Industrial Technology | 2 | $29B |
|
||
| Insurance | 2 | $17B |
|
||
| Retail | 1 | $60B |
|
||
| Technology Distribution | 1 | $58B |
|
||
| Homebuilding | 1 | $35B |
|
||
| Technology Manufacturing | 1 | $35B |
|
||
Price history
+42.0% since first listed24 events — show timeline
- 2026-06-12 Listed $169,000 St. Augustine and St. Johns County Board of REALTORS®
- 2026-04-30 Listing Removed — realMLS
- 2026-03-11 Price Changed $168,999 realMLS
- 2026-03-08 Price Changed $150,000 realMLS
- 2026-02-23 Price Changed $170,000 realMLS
- 2025-11-21 Listed $185,000 realMLS
- 2025-09-09 Listing Removed — realMLS
- 2025-09-09 Listing Removed — Stellar MLS as Distributed by MLS Grid
- 2025-06-06 Listed $265,000 realMLS
- 2025-06-06 Listed $265,000 Stellar MLS as Distributed by MLS Grid
- 2024-12-03 Listing Removed — Stellar MLS as Distributed by MLS Grid
- 2024-07-04 Listed $154,900 Stellar MLS as Distributed by MLS Grid
- 2024-04-25 Listing Removed — Stellar MLS as Distributed by MLS Grid
- 2024-02-02 Listed $194,500 Stellar MLS as Distributed by MLS Grid
- 2023-08-23 Sold (Public Records) $87,000 Public Records
- 2023-08-22 Sold (MLS) $86,000 realMLS
- 2023-08-17 Pending — realMLS
- 2023-08-16 Relisted — realMLS
- 2023-08-14 Pending — realMLS
- 2023-06-30 Price Changed $99,000 realMLS
- 2023-05-04 Relisted — realMLS
- 2023-05-02 Pending — realMLS
- 2023-04-19 Price Changed $106,000 realMLS
- 2023-01-12 Listed $119,000 realMLS
Property tax history
+2.3%/yrLatest (2025): $1,115 · +18.9% YoY. Source: county tax records.
Cash-flow waterfall
monthlySold comps — $/sqft
last 12 mo · ≤1 miLoading sold comps…