 Multi-family
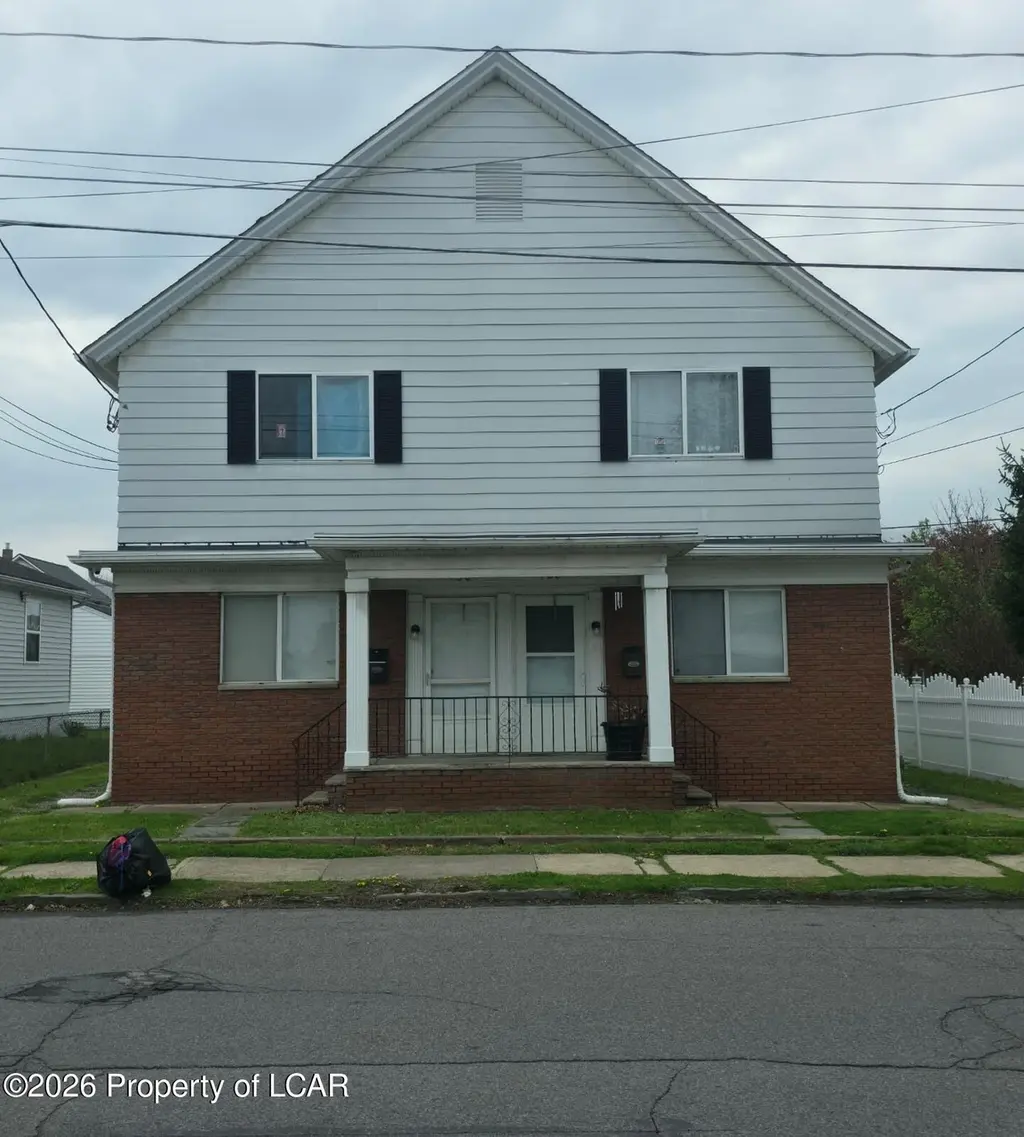
128 130 Stephenson St · Duryea, PA
Flood risk 7/10 · Major
- FEMA flood zone
- X
- Chance of flooding over 30 yrs
- 0.76%
- Est. flood insurance / yr
- $507 – $1,088
Fire risk 4/10 · Minor
- Est. fire insurance / yr
- $511 – $949
Heat risk 4/10 · Minor
- Hot days now (above 95°F)
- 7 days/yr
- Hot days in 30 yrs
- 16 days/yr
Wind risk 3/10 · Minor
- Chance of severe wind over 30 yrs
- 4.0%
Air-quality risk 2/10 · Minimal
- Unhealthy air days now
- 0 days/yr
- Unhealthy air days in 30 yrs
- 1 days/yr
Risk factors via First Street. Map © Google.
Why this score? — see what drove the B- grade
The composite is a weighted blend of 9 inputs, each scored 0–100. Each bar is that input's sub-score; the figure is the points it added to the 100-point composite (weight × sub-score).
- Cash flow +30.0/30.0
- DSCR +10.0/10.0
- 1% rule +8.0/10.0
- ARV discount +7.5/15.0
- Livability +3.3/5.0
- Schools +3.0/10.0
- Rent growth +2.5/5.0
- Condition / age +2.5/5.0
- Appreciation +0.0/10.0
$319,900
🖨 Deal sheet 📄 Offer letter ✓ Due diligence
Multi-family units
County records classify this as Multi-Family (2-4 Unit). Listing-text estimate: 1 unit. estimate disagrees with records
Listing remarks MLS
A true turnkey investment opportunity, ideal for building, expanding, or diversifying your real estate portfolio. This impeccably maintained three-unit property is situated in a quiet area of Duryea, offering convenient access to major highways and close proximity to Scranton, Pittston, and a variety of shopping centers. Each unit is equipped with separate utilities, with the owner responsible
Key facts
- Three unit property
- Separate utilities
- Convenient access
Tags
Neighborhood map
What this means for you Summary
Snapshot
- This is a 5-bed/3.0-bath multifamily listed at $320k.
Deal economics
- At list price, monthly cash flow is $1k ($14k/yr) — positive.
- The deal already cash-flows at list — no discount required.
- Meets the 1% rule at list price ($4k rent vs $320k).
- Recommended offer: $310k (3.0% below list) — sets the bar for market timing.
Location & tenants
- Location reads 66/100 on livability (#1,029 in PA) — a middle-class / working-renter tenant base. Strengths: cost of living A+, crime A, housing B+; Watch: schools D+, amenities F, commute F.
- Pittston Area SD (suburban): math 30% / reading 40% proficiency, ranked #418 of 539 in PA (top 78%) — families likely to look elsewhere, expect single-tenant / working-renter base with shorter leases.
- Market conditions: 20 active listings in the ZIP; 349 units permitted in Luzerne County in 2024 (16 in 5+ unit buildings).
Forward outlook
- Local home prices are declining (-3.0%/yr); year-one equity from $2k of loan paydown is wiped out by about $10k of value loss. Plan a longer hold.
- Luzerne County population projected at +4% by 2050 — modest demand growth; plan on rents tracking national, not racing it.
- At projected returns (-3.0% appreciation + 3.0% rent growth), your $90k cash investment doubles in ~8 years — after that, you're playing with house money.
Negotiation context
- It's been on market 57 days — a 3% lower offer ($310k) is reasonable based on typical stale-listing flexibility.
- 4 sale attempts since 22y ago with the ask held roughly flat each time — persistent listings suggest the price (not the market) is what's stuck; bring a comps-based counter.
Risks & watch-outs
- Watch-outs: flood insurance adds $66/mo; built in 1920 — expect roof / HVAC / electrical / plumbing capex.
- Climate carrying-cost: major flood risk — expect insurance premiums to compound above CPI over the hold.
Questions for the listing agent
- It's been on market 57 days. Have you received any prior offers? Is the seller open to a 3% concession, seller financing, or rate buy-down credit?
- Built in 1920 — when were the roof, HVAC, electrical panel, plumbing, and water heater last replaced?
- What's the actual annual flood-insurance premium (NFIP or private), and is the property in a SFHA with mandatory coverage?
- Is there a deadline driving the sale (1031 exchange, divorce, estate, relocation)? That informs how much negotiation room exists.
- Schools are D-rated, which usually means shorter tenancies and higher turnover. Who's the typical renter profile here, and what's been the actual vacancy rate?
- What's the average days-on-market for RENTAL listings here right now (not sales)? A rising rental-DOM trend means longer vacancies and softer asking-rent achievability than the comps imply.
- What's the recent tenant-quality profile in this submarket — average credit score on applications, eviction rate, late-payment / NSF rate, and stable-employment percentage? A property-management company in the area should have these aggregated.
- How much new apartment / multifamily construction is in the pipeline within 1–3 miles? Heavy new supply (>2% of stock underway) typically softens rents 12–24 months out; light construction supports rent growth.
Investment metrics
- 1% rule
- 1.30% ✓
- Cap rate
- 10.94%
- Cash-on-cash
- 16.61%
- DSCR
- 1.74
- GRM
- 6.4
CMA / ARV
- ARV (median comp)
- $200,174
- List price
- $319,900
- Delta
- 59.81%
- Verdict
- OVERPRICED
- Comps
- 20 within 1.0 mi
Show comp detail 3 sales within ~0.75 mi
| Address | Dist | Beds/Ba | Sqft | Sold | Price | $/sf | Match |
|---|---|---|---|---|---|---|---|
| 106-108 Lackawanna Ave | 0.13mi | 6/4.0 (+1) | 2,832 (-6%) | 4mo | $219,000 | $77 | 72 |
| 258 Main St | 0.16mi | 5/4.0 | 2,992 (-0%) | 22mo | $212,500 | $71 | 70 |
| 834-836 Marcy Ave | 0.59mi | 4/2.5 (-1) | 2,700 (-10%) | 7mo | $242,000 | $90 | 42 |
Match score weights: distance 35% · size 25% · config 20% · recency 20%. Top-matched comps best support the ARV.
Projected returns pro-forma
-3.0% appreciation · 3.0% rent growth · sell at horizon
- IRR
- 6.6%
- Equity multiple
- 1.26×
- Total profit
- $22,915
- Equity at exit
- $47,698
- IRR
- 15.9%
- Equity multiple
- 2.30×
- Total profit
- $116,225
- Equity at exit
- $27,659
Cash invested: $89,572 (down + closing). Projections, not guarantees.
Landlord ↔ Tenant lean methodology
- Overall (STATE)
- 62 Landlord-Friendly
- State Pennsylvania
- 62 Landlord-Friendly · EVEN
- County
- — inherits STATE
- City
- — inherits STATE
ZIP-level market 18642
- Home prices YoY
- -15.5%
- Active inventory
- 20
- Price-to-rent
- 19.2×
Monthly cashflow live
- Estimated rent
- $4,166 high interval (Pro) →
- Mortgage (P&I)
- −$1,678
- Tax from tax record
- −$240 /mo · $2,882/yr
- Insurance
- −$133
- Flood insurance flood zone
- −$66 /mo · $798/yr
- HOA
- −$0
- Vacancy / Maint / Mgmt
- −$875
- Net cashflow
- $1,174
Break-even live
3-unit breakdown (identical units grouped — click to expand)
| Units | Beds | Baths | Est. rent |
|---|---|---|---|
| 3× units | 3 | 1 | $4,167 |
| #1 | 3 | 1 | $1,389 |
| #2 | 3 | 1 | $1,389 |
| #3 | 3 | 1 | $1,389 |
| Total (3 units) | $4,166 | ||
UW: 25.0% down · 7.5% · 30yr · 1.5% tax · 5.0% vac · 8.0% maint · 8.0% mgmt
Financing live
Cash to close
- Down payment
- $79,975
- Closing costs
- $9,597
- Reserves months
- —
- Total cash needed
- —
Loan-product check · same deal, 3 products live
Conventional
25% down · 7.5% · 30yr
- Down + closing
- —
- Monthly P&I
- —
- Monthly cashflow
- —
- DSCR
- —
- Eligible?
- —
Personal DTI + credit; lowest rate.
DSCR
20% down · 8.5% · 30yr
- Down + closing
- —
- Monthly P&I
- —
- Monthly cashflow
- —
- DSCR
- —
- Eligible?
- —
No personal income docs; deal must DSCR.
Hard money
10% down · 12.0% · 12mo
- Down + closing
- —
- Monthly P&I
- —
- Monthly cashflow
- —
- DSCR
- —
- Eligible?
- —
Short-term bridge; refi at stabilization.
Listing history 23 events
-
2026-06-18days on market $319,900 Active 57 DOM
-
2026-06-17days on market $319,900 Active 56 DOM
-
2026-06-16days on market $319,900 Active 55 DOM
-
2026-06-15days on market $319,900 Active 54 DOM
-
2026-06-14days on market $319,900 Active 52 DOM
-
2026-06-13days on market $319,900 Active 51 DOM
-
2026-06-10days on market $319,900 Active 49 DOM
-
2026-06-09days on market $319,900 Active 48 DOM
-
2026-06-08days on market $319,900 Active 47 DOM
-
2026-06-07days on market $319,900 Active 46 DOM
-
2026-06-02days on market $319,900 Active 41 DOM
-
2026-06-01days on market $319,900 Active 40 DOM
-
2026-05-31days on market $319,900 Active 39 DOM
-
2026-05-30days on market $319,900 Active 38 DOM
-
2026-04-22$319,900 Active 396-char remark
Show marketing remark (396 chars)
A true turnkey investment opportunity, ideal for building, expanding, or diversifying your real estate portfolio. This impeccably maintained three-unit property is situated in a quiet area of Duryea, offering convenient access to major highways and close proximity to Scranton, Pittston, and a variety of shopping centers. Each unit is equipped with separate utilities, with the owner responsible
-
2025-02-20soldstatus $290,000 Closed
-
2025-02-11$299,000
-
2018-07-11soldstatus $106,500
-
2018-06-26soldstatus $106,500
-
2018-06-26soldstatus $106,500
-
2017-07-06$118,000
-
2006-01-20soldstatus $57,000
-
2004-07-22$89,900
ⓘ Source: listings_history table (triggers on properties + properties_extension) + one-shot
backfill from property_details.listing_events for pre-trigger history.
Tax reassessment forecast PA · Partial reset (capped growth)
- Current annual tax
- $2,882 · $240/mo
- Projected year-2 tax
- $3,968 · $331/mo
- Expected delta
- +$1,086/yr (+$90/mo · 37.7%)
ⓘ Screening estimate from a state-policy table — verify with the county assessor before closing.
Climate risk First Street
- Flood 7/10 Severe FEMA zone X · 76% chance over 30 yrs
- Wildfire 4/10 Moderate
- Heat 4/10 Moderate 7 d/yr ≥95°F today · 16 d/yr by 30 yrs out
- Wind 3/10 Moderate 4% chance of damaging wind over 30 yrs
- Air quality 2/10 Low 0 unhealthy d/yr today · 1 by 30 yrs out
Nearby sold comps map
Loading sold comps map…
Walkable amenities ~0.75 mi
Loading nearby amenities…
Taxation est. · year 1
- Rental income
- $49,992
- − Mortgage interest
- −$17,919
- − Property taxes
- −$2,882
- − Insurance
- −$2,397
- − Repairs & maintenance
- −$3,999
- − Management
- −$3,999
- − Depreciation
- −$9,306
- Taxable income
- $9,488
- Est. tax owed @ 24.0%
- −$2,277
- After-tax cash flow
- $11,806/yr
For passive investors: Depreciation is non-cash, so a rental often shows a tax loss while cash-flowing — sheltering income. Rental losses are passive: they offset passive income freely, and up to $25,000/yr can offset ordinary (W-2) income if you actively participate and your MAGI is under $100k (phasing out to $0 by $150k); unused losses carry forward. On sale, claimed depreciation is recaptured at up to 25%, and gains may owe capital-gains tax (a 1031 exchange can defer both). Figures are a year-1 estimate at your 24.0% rate — not tax advice; consult a CPA.
Schools (NCES district)
- District
- Pittston Area SD
- NCES district ID
- 4219200
- Math proficiency
- 30% ▼ -12.00%
- Reading proficiency
- 40% ▼ -19.00%
- Median HH income
- $45,316
- Composite
- 29.86/100
- National rank
- #6409
- State rank
- #418 of 539 in PA
Livability — Duryea
- Score
- 66/100
- State rank
- #1029
- US rank
- #11458
Category grades
Schools grade is shown separately in the Schools card above.
Census & demographics
- Census place
- Duryea, PA
- City population
- 4,469
- Population (ZIP)
- 4,469
Population outlook (Luzerne County) Hauer SSP2
- Today (2025)
- 319,505 people
- By 2030
- 319,943 · +0.1%
- By 2040
- 322,643 · +1.0%
- By 2050
- 330,817 · +3.5%
- By 2075
- 379,145 · +18.7%
- By 2100
- 431,908 · +35.2%
Race, ethnicity, and origin ACS 2023
- Neighborhood character
- Predominantly White (78%)
- Race & ethnicity
- White 78% Hispanic / Latino 21% Two or more races 19%
- Hispanic origin (detail)
- Mexican 16% Puerto Rican 2%
- Common ancestry
- Romanian 20% Scotch-Irish 3% Iranian 2%
- Foreign-born
- 7% · Canada
- Languages at home
- 82% English-only · Spanish 16%
Political lean MEDSL · Luzerne
- 2024 margin
- R (+19.2) · D 40.0% · R 59.2%
- 2008→2024 swing
- -27.6pp toward R · 2008: 8.4pp · 2024: -19.2pp
- All cycles
- 2024: R+19.2 2020: R+14.4 2016: R+19.6 2012: D+4.8 2008: D+8.4
Not yet ingested
- Civics
- —
Market trends
- HPI YoY
- ▼ -34.99%
- Current HPI
- 190.5926
- Rent YoY
- —
- Metro
- —
- State GDP YoY
- ▲ 1.68%
- F500 in state
- 34
Industry mix (Fortune 500 HQ in PA)
| Industry | F500 HQs | Revenue |
|---|---|---|
| Healthcare | 2 | $309B |
|
||
| Insurance | 2 | $27B |
|
||
| Telecommunications / Media | 1 | $124B |
|
||
| Industrial Distribution | 1 | $22B |
|
||
| Financial Services | 1 | $20B |
|
||
| Chemicals / Materials | 1 | $18B |
|
||
Price history
+255.8% since first listed9 events — show timeline
- 2026-04-22 Listed $319,900 LCAR
- 2025-02-20 Sold (MLS) $290,000 LCAR
- 2025-02-11 Listed $299,000 GSBR as distributed by MLS GRID
- 2018-07-11 Sold (Public Records) $106,500 Public Records
- 2018-06-26 Sold (MLS) $106,500 LCAR
- 2018-06-26 Sold (MLS) $106,500 GSBR as distributed by MLS GRID
- 2017-07-06 Listed $118,000 LCAR
- 2006-01-20 Sold (MLS) $57,000 GSBR as distributed by MLS GRID
- 2004-07-22 Listed $89,900 GSBR as distributed by MLS GRID
Property tax history
+1.9%/yrLatest (2026): $2,882 · +0.4% YoY. Source: county tax records.
Cash-flow waterfall
monthlySold comps — $/sqft
last 12 mo · ≤1 miLoading sold comps…