 Duplex
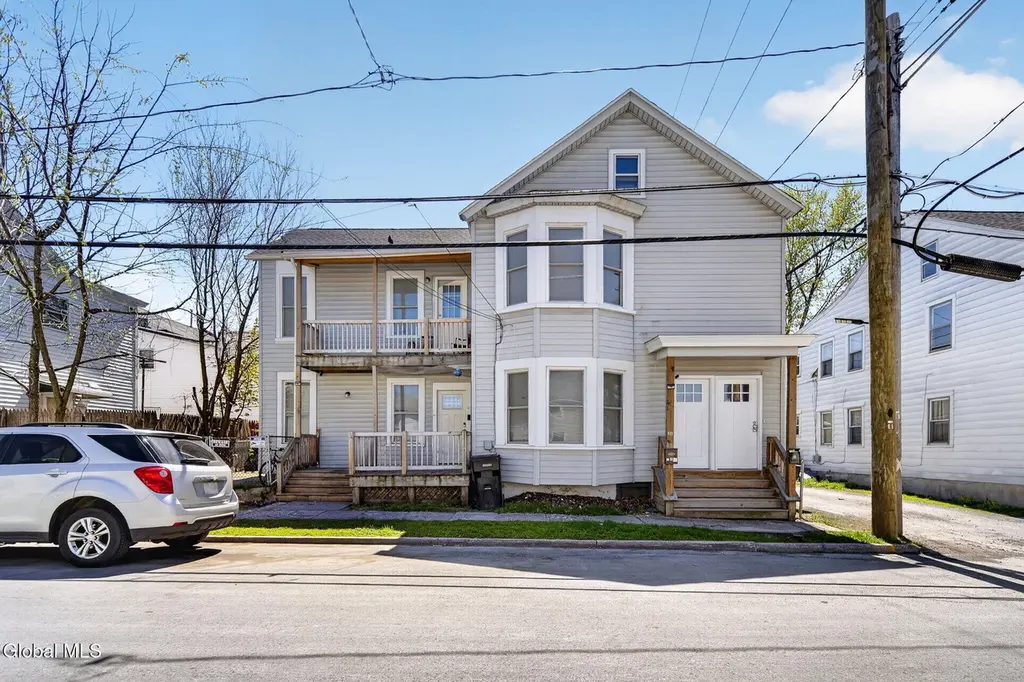
30 118th St · Troy, NY
Flood risk 6/10 · Moderate
- FEMA flood zone
- X
- Chance of flooding over 30 yrs
- 0.54%
- Est. flood insurance / yr
- $473 – $860
Fire risk 3/10 · Minor
- Est. fire insurance / yr
- $691 – $1,283
Heat risk 4/10 · Minor
- Hot days now (above 95°F)
- 8 days/yr
- Hot days in 30 yrs
- 18 days/yr
Wind risk 3/10 · Minor
- Chance of severe wind over 30 yrs
- 5.0%
Air-quality risk 2/10 · Minimal
- Unhealthy air days now
- 0 days/yr
- Unhealthy air days in 30 yrs
- 1 days/yr
Risk factors via First Street. Map © Google.
Why this score? — see what drove the C+ grade
The composite is a weighted blend of 9 inputs, each scored 0–100. Each bar is that input's sub-score; the figure is the points it added to the 100-point composite (weight × sub-score).
- Cash flow +24.9/30.0
- ARV discount +10.0/15.0
- DSCR +8.1/10.0
- 1% rule +6.4/10.0
- Livability +4.0/5.0
- Schools +2.8/10.0
- Rent growth +2.5/5.0
- Condition / age +2.5/5.0
- Appreciation +0.0/10.0
$269,900
🖨 Deal sheet 📄 Offer letter ✓ Due diligence
Multi-family units
County records classify this as Multi-Family (2-4 Unit). Listing-text estimate: 2 units. confirmed
Listing remarks MLS
Looking for a home to Renovate? This 2 family Lansignburgh home has a lot of potential. Each unit has separate entrances. 3 bedrooms, 1 bathroom per unit. Bring this one back to it's former beauty!
Key facts
- Near downtown troy
- Spacious floor plans
- 1,306 sq ft lot
Tags
Property features AI
Finance
- Financial info: Two-unit property
Exterior
- Utilities: Public water; Public sewer
- Home design: Duplex
- Construction: Vinyl siding
- Exterior features: Small lot (approximately 0.03 acres)
Interior
- Bedrooms: Unit 1: 2 bedrooms (both on the 1st floor); Unit 2: 2 bedrooms (both on the 2nd floor)
- Bathrooms: Total of 4 full bathrooms; Unit 1: 2 full bathrooms (both on the 1st floor); Unit 2: 2 full bathrooms (both on the 2nd floor)
- Heating & cooling: Forced air heating; Natural gas
- Interior features: Unfinished basement
Neighborhood map
What this means for you Summary
Snapshot
- This is a 2 × 2-bed/2.0-bath units multifamily listed at $270k.
Deal economics
- At list price, monthly cash flow is $583 ($7k/yr) — positive. Per door: $292/mo.
- The deal already cash-flows at list — no discount required.
- Meets the 1% rule at list price ($3k rent vs $270k).
- Recommended offer: $262k (3.0% below list) — sets the bar for market timing.
- Cap rate 8.9% vs local median 5.3% in Troy — top-decile yield for the area; either an underpriced asset or a hidden risk that comps aren't pricing in. Stress-test before assuming the spread holds.
Location & tenants
- Location reads 81/100 on livability (#88 in NY, #1,350 nationally) — a professional / high-income tenant draw. Strengths: amenities A+, commute A+, housing A+; Watch: schools C-, employment C-, crime F.
- Lansingburgh Central School District (urban): math 31% / reading 35% proficiency, ranked #566 of 590 in NY (top 96%) — families likely to look elsewhere, expect single-tenant / working-renter base with shorter leases.
- Market conditions: 75 active listings in the ZIP; 7 comparable units currently listed for rent nearby; rentals at typical pace (median 14d on market — plan ~3-4 weeks tenant-placement turnaround); 405 units permitted in Rensselaer County in 2024 (224 in 5+ unit buildings).
Forward outlook
- Local home prices are declining (-3.0%/yr); year-one equity from $2k of loan paydown is wiped out by about $8k of value loss. Plan a longer hold.
- Rensselaer County population projected to shrink 6% by 2050 — rents likely to lag national; underwrite the cash flow, not the appreciation.
Negotiation context
- It's been on market 35 days — a 3% lower offer ($262k) is reasonable based on typical stale-listing flexibility.
- 4 sale attempts since 6y ago with the ask held roughly flat each time — persistent listings suggest the price (not the market) is what's stuck; bring a comps-based counter.
- Current owner paid $20k; list at $270k implies a 1250% gain — meaningful room to come down on a strong offer.
Risks & watch-outs
- Watch-outs: built in 1865 — expect roof / HVAC / electrical / plumbing capex.
- Climate carrying-cost: major flood risk — expect insurance premiums to compound above CPI over the hold.
Questions for the listing agent
- It's been on market 35 days. Have you received any prior offers? Is the seller open to a 3% concession, seller financing, or rate buy-down credit?
- Can we see the unit-by-unit rent roll, current vacancy, and any below-market leases? What's the average tenancy length?
- What capital expenditures (roof, boiler, parking lot, exteriors) have been made in the last 5 years, and what's planned in the next 2?
- Built in 1865 — when were the roof, HVAC, electrical panel, plumbing, and water heater last replaced?
- Is there a deadline driving the sale (1031 exchange, divorce, estate, relocation)? That informs how much negotiation room exists.
- Crime grade is F in this area — have there been break-ins, vandalism, or insurance claims at this property in the last 3 years? What carrier currently insures it and at what premium?
- What's the average days-on-market for RENTAL listings here right now (not sales)? A rising rental-DOM trend means longer vacancies and softer asking-rent achievability than the comps imply.
- What's the recent tenant-quality profile in this submarket — average credit score on applications, eviction rate, late-payment / NSF rate, and stable-employment percentage? A property-management company in the area should have these aggregated.
- How much new apartment / multifamily construction is in the pipeline within 1–3 miles? Heavy new supply (>2% of stock underway) typically softens rents 12–24 months out; light construction supports rent growth.
Investment metrics
- 1% rule
- 1.14% ✓
- Cap rate
- 8.89%
- Cash-on-cash
- 9.26%
- DSCR
- 1.41
- GRM
- 7.3
CMA / ARV
- ARV (median comp)
- $286,108
- List price
- $269,900
- Delta
- -5.66%
- Verdict
- FAIR
- Comps
- 20 within 1.0 mi
Show comp detail 12 sales within ~0.75 mi
| Address | Dist | Beds/Ba | Sqft | Sold | Price | $/sf | Match |
|---|---|---|---|---|---|---|---|
| 669 6th Ave | 0.08mi | 3/2.0 (-1) | 1,884 (-1%) | 8mo | $102,000 | $54 | 75 |
| 536 7th Ave | 0.37mi | 5/2.0 (+1) | 1,864 (-2%) | 9mo | $200,000 | $107 | 59 |
| 39 111th St | 0.60mi | 4/2.0 | 1,936 (+2%) | 5mo | $200,000 | $103 | 56 |
| 847 5th Ave | 0.51mi | 4/2.0 | 2,052 (+8%) | 1mo | $245,000 | $119 | 54 |
| 799 5th Ave | 0.38mi | 4/2.0 | 2,112 (+11%) | 6mo | $226,000 | $107 | 50 |
| 411 Fifth Ave | 0.68mi | 4/3.0 | 1,751 (-8%) | 4mo | $220,000 | $126 | 48 |
| 33 110th St | 0.69mi | 4/2.0 | 2,026 (+7%) | 5mo | $205,000 | $101 | 44 |
| 46 Continental Ave | 0.74mi | 4/2.0 | 1,832 (-3%) | 12mo | $242,000 | $132 | 42 |
| 443-445 3rd Ave | 0.60mi | 5/2.0 (+1) | 1,792 (-6%) | 10mo | $172,000 | $96 | 42 |
| 418 7th Ave | 0.69mi | 5/2.0 (+1) | 2,025 (+7%) | 6mo | $227,000 | $112 | 38 |
| 457 4th Ave | 0.56mi | 5/2.0 (+1) | 2,032 (+7%) | 13mo | $252,000 | $124 | 38 |
| 10 Northern Dr | 0.70mi | 4/2.0 | 2,168 (+14%) | 10mo | $145,000 | $67 | 27 |
Match score weights: distance 35% · size 25% · config 20% · recency 20%. Top-matched comps best support the ARV.
Projected returns pro-forma
-3.0% appreciation · 3.0% rent growth · sell at horizon
- IRR
- -2.3%
- Equity multiple
- 0.91×
- Total profit
- $-6,545
- Equity at exit
- $40,243
- IRR
- 7.4%
- Equity multiple
- 1.56×
- Total profit
- $42,276
- Equity at exit
- $23,336
Cash invested: $75,572 (down + closing). Projections, not guarantees.
Landlord ↔ Tenant lean methodology
- Overall (STATE)
- 15 Strongly Tenant-Friendly
- State New York
- 15 Strongly Tenant-Friendly · D+10
- County
- — inherits STATE
- City
- — inherits STATE
ZIP-level market 12182
- Home prices YoY
- -15.6%
- Active inventory
- 75
- Price-to-rent
- 14.7×
Monthly cashflow live
- Estimated rent
- $3,068 high interval (Pro) →
- Mortgage (P&I)
- −$1,415
- Tax from tax record
- −$312 /mo · $3,749/yr
- Insurance
- −$112
- HOA
- −$0
- Vacancy / Maint / Mgmt
- −$644
- Net cashflow
- $583
Break-even live
2-unit breakdown (identical units grouped — click to expand)
| Units | Beds | Baths | Est. rent |
|---|---|---|---|
| 2× units | 2 | 2 | $3,068 |
| #1 | 2 | 2 | $1,534 |
| #2 | 2 | 2 | $1,534 |
| Total (2 units) | $3,068 | ||
UW: 25.0% down · 7.5% · 30yr · 1.5% tax · 5.0% vac · 8.0% maint · 8.0% mgmt
Financing live
Cash to close
- Down payment
- $67,475
- Closing costs
- $8,097
- Reserves months
- —
- Total cash needed
- —
Loan-product check · same deal, 3 products live
Conventional
25% down · 7.5% · 30yr
- Down + closing
- —
- Monthly P&I
- —
- Monthly cashflow
- —
- DSCR
- —
- Eligible?
- —
Personal DTI + credit; lowest rate.
DSCR
20% down · 8.5% · 30yr
- Down + closing
- —
- Monthly P&I
- —
- Monthly cashflow
- —
- DSCR
- —
- Eligible?
- —
No personal income docs; deal must DSCR.
Hard money
10% down · 12.0% · 12mo
- Down + closing
- —
- Monthly P&I
- —
- Monthly cashflow
- —
- DSCR
- —
- Eligible?
- —
Short-term bridge; refi at stabilization.
Rent comps 7 comps
| Address | Beds | Baths | Sqft | Rent | $/sqft | DOM | Units | Dist |
|---|---|---|---|---|---|---|---|---|
| 750 2nd Ave Troy, NY | 1.0–3.0 | 1.0–1.5 | 1185 | $1,711 | $1.44 | 14d | 1 | 0.29mi |
| 53 Park Ave Cohoes, NY | 3.0 | 1.0 | 1875 | $1,600 | $0.85 | 14d | 1 | 0.73mi |
| 290 2nd Ave Troy, NY | 3.0 | 1.0 | 1400 | $1,600 | $1.14 | 21d | 1 | 0.99mi |
| 192 Saratoga St Cohoes, NY | 1.0–3.0 | 1.0–3.0 | 1157 | $2,600 | $2.25 | 14d | 4 | 1.35mi |
| 157 6th Ave Unit 2 Troy, NY | 3.0 | 1.0 | 1300 | $1,350 | $1.04 | 18d | 1 | 1.36mi |
| 131 6th Ave Troy, NY | 4.0 | 1.0 | 1400 | $2,325 | $1.66 | 14d | 1 | 1.42mi |
| 12 White St Cohoes, NY | 3.0 | 2.0 | 1790 | $2,895 | $1.62 | 18d | 1 | 1.44mi |
Listing history 26 events
-
2026-06-18days on market $269,900 Active 35 DOM
-
2026-06-17days on market $269,900 Active 34 DOM
-
2026-06-16days on market $269,900 Active 33 DOM
-
2026-06-15days on market $269,900 Active 32 DOM
-
2026-06-14days on market $269,900 Active 30 DOM
-
2026-06-10days on market $269,900 Active 27 DOM
-
2026-06-09days on market $269,900 Active 26 DOM
-
2026-06-08days on market $269,900 Active 25 DOM
-
2026-06-07days on market $269,900 Active 24 DOM
-
2026-06-05days on market $269,900 Active 21 DOM
-
2026-06-03days on market $269,900 Active 20 DOM
-
2026-06-02days on market $269,900 Active 19 DOM
-
2026-06-01days on market $269,900 Active 18 DOM
-
2026-05-31days on market $269,900 Active 17 DOM
-
2026-05-31days on market $269,900 Active 16 DOM
-
2026-05-14$269,900 Active 307-char remark
-
2025-12-30historical
-
2025-11-03price $275,000
-
2025-06-30price $279,900
-
2025-05-22$290,000 Active
-
2020-11-02soldstatus $20,000
-
2020-10-27soldstatus $20,000 Closed (Final Sale)
Show marketing remark (197 chars)
Looking for a home to Renovate? This 2 family Lansignburgh home has a lot of potential. Each unit has separate entrances. 3 bedrooms, 1 bathroom per unit. Bring this one back to it's former beauty!
-
2020-09-21status Pend (Under Cntr)
Show marketing remark (197 chars)
Looking for a home to Renovate? This 2 family Lansignburgh home has a lot of potential. Each unit has separate entrances. 3 bedrooms, 1 bathroom per unit. Bring this one back to it's former beauty!
-
2020-07-24status Back On Market
Show marketing remark (197 chars)
Looking for a home to Renovate? This 2 family Lansignburgh home has a lot of potential. Each unit has separate entrances. 3 bedrooms, 1 bathroom per unit. Bring this one back to it's former beauty!
-
2020-07-18status Pend (Under Cntr)
Show marketing remark (197 chars)
Looking for a home to Renovate? This 2 family Lansignburgh home has a lot of potential. Each unit has separate entrances. 3 bedrooms, 1 bathroom per unit. Bring this one back to it's former beauty!
-
2020-07-14$50,000 New
Show marketing remark (197 chars)
Looking for a home to Renovate? This 2 family Lansignburgh home has a lot of potential. Each unit has separate entrances. 3 bedrooms, 1 bathroom per unit. Bring this one back to it's former beauty!
ⓘ Source: listings_history table (triggers on properties + properties_extension) + one-shot
backfill from property_details.listing_events for pre-trigger history.
Tax reassessment forecast NY · Partial reset (capped growth)
- Current annual tax
- $3,749 · $312/mo
- Projected year-2 tax
- $4,155 · $346/mo
- Expected delta
- +$406/yr (+$34/mo · 10.8%)
ⓘ Screening estimate from a state-policy table — verify with the county assessor before closing.
Climate risk First Street
- Flood 6/10 Major FEMA zone X · 54% chance over 30 yrs
- Wildfire 3/10 Moderate
- Heat 4/10 Moderate 8 d/yr ≥95°F today · 18 d/yr by 30 yrs out
- Wind 3/10 Moderate 5% chance of damaging wind over 30 yrs
- Air quality 2/10 Low 0 unhealthy d/yr today · 1 by 30 yrs out
Nearby sold comps map
Loading sold comps map…
Walkable amenities ~0.75 mi
Loading nearby amenities…
Taxation est. · year 1
- Rental income
- $36,816
- − Mortgage interest
- −$15,119
- − Property taxes
- −$3,749
- − Insurance
- −$1,350
- − Repairs & maintenance
- −$2,945
- − Management
- −$2,945
- − Depreciation
- −$7,852
- Taxable income
- $2,856
- Est. tax owed @ 24.0%
- −$686
- After-tax cash flow
- $6,316/yr
For passive investors: Depreciation is non-cash, so a rental often shows a tax loss while cash-flowing — sheltering income. Rental losses are passive: they offset passive income freely, and up to $25,000/yr can offset ordinary (W-2) income if you actively participate and your MAGI is under $100k (phasing out to $0 by $150k); unused losses carry forward. On sale, claimed depreciation is recaptured at up to 25%, and gains may owe capital-gains tax (a 1031 exchange can defer both). Figures are a year-1 estimate at your 24.0% rate — not tax advice; consult a CPA.
Schools (NCES district)
- District
- Lansingburgh Central School District
- NCES district ID
- 3616740
- Math proficiency
- 31% ▼ -7.00%
- Reading proficiency
- 35% ▼ -6.00%
- Median HH income
- $44,807
- Composite
- 28.19/100
- National rank
- #6810
- State rank
- #566 of 590 in NY
Livability — Troy
- Score
- 81/100
- State rank
- #88
- US rank
- #1350
Category grades
Schools grade is shown separately in the Schools card above.
Census & demographics
- Census place
- Troy, NY
- City population
- 53,479
- Population (ZIP)
- 14,273
Population outlook (Rensselaer County) Hauer SSP2
- Today (2025)
- 162,400 people
- By 2030
- 161,746 · -0.4%
- By 2040
- 158,095 · -2.7%
- By 2050
- 152,966 · -5.8%
- By 2075
- 140,767 · -13.3%
- By 2100
- 124,727 · -23.2%
Race, ethnicity, and origin ACS 2023
- Neighborhood character
- Predominantly White (70%)
- Race & ethnicity
- White 70% Black 14% Two or more races 12% Hispanic / Latino 7%
- Hispanic origin (detail)
- Puerto Rican 6%
- Common ancestry
- Lithuanian 7% Romanian 3% Iranian 1%
- Foreign-born
- 3% · Canada, Jamaica
- Languages at home
- 94% English-only · Spanish 4% Other Indo-European 1%
Political lean MEDSL · Rensselaer
- 2024 margin
- Toss-up / Even · D 50.7% · R 49.3%
- 2008→2024 swing
- -8.0pp toward R · 2008: 9.3pp · 2024: 1.4pp
- All cycles
- 2024: D+1.4 2020: D+5.6 2016: R+2.9 2012: D+11.8 2008: D+9.3
Not yet ingested
- Civics
- —
Market trends
- HPI YoY
- ▼ -50.58%
- Current HPI
- 273.5758
- Rent YoY
- —
- Metro
- —
- State GDP YoY
- ▲ 2.60%
- F500 in state
- 92
Industry mix (Fortune 500 HQ in NY)
| Industry | F500 HQs | Revenue |
|---|---|---|
| Financial Services | 10 | $950B |
|
||
| Consumer Goods | 9 | $162B |
|
||
| Insurance | 4 | $225B |
|
||
| Telecommunications | 2 | $144B |
|
||
| Pharmaceuticals | 2 | $112B |
|
||
| Media / Entertainment | 2 | $69B |
|
||
Price history
+439.8% since first listed11 events — show timeline
- 2026-05-14 Listed $269,900 Global MLS
- 2025-12-30 Listing Removed — Global MLS
- 2025-11-03 Price Changed $275,000 Global MLS
- 2025-06-30 Price Changed $279,900 Global MLS
- 2025-05-22 Listed $290,000 Global MLS
- 2020-11-02 Sold (Public Records) $20,000 Public Records
- 2020-10-27 Sold (MLS) $20,000 Global MLS
- 2020-09-21 Pending — Global MLS
- 2020-07-24 Relisted — Global MLS
- 2020-07-18 Pending — Global MLS
- 2020-07-14 Listed $50,000 Global MLS
Property tax history
+17.9%/yrLatest (2025): $3,749 · +1.3% YoY. Source: county tax records.
Cash-flow waterfall
monthlySold comps — $/sqft
last 12 mo · ≤1 miLoading sold comps…