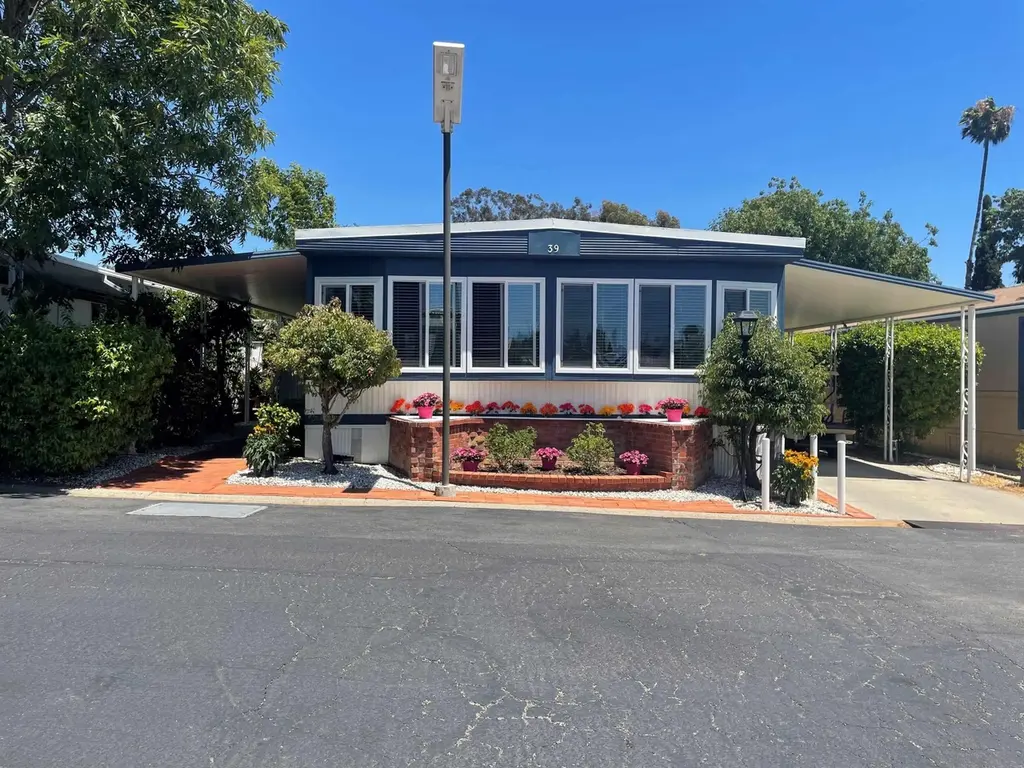
1120 E Mission Rd #39 · Fallbrook, CA
Flood risk 1/10 · Minimal
- FEMA flood zone
- X (unshaded)
- Chance of flooding over 30 yrs
- 0.0%
- Est. flood insurance / yr
- $507 – $1,088
Fire risk 7/10 · Major
- Est. fire insurance / yr
- $659 – $1,223
Heat risk 6/10 · Moderate
- Hot days now (above 94°F)
- 5 days/yr
- Hot days in 30 yrs
- 15 days/yr
Wind risk 1/10 · Minimal
- Chance of severe wind over 30 yrs
- —
Air-quality risk 4/10 · Minor
- Unhealthy air days now
- 5 days/yr
- Unhealthy air days in 30 yrs
- 6 days/yr
Risk factors via First Street. Map © Google.
Why this score? — see what drove the B grade
The composite is a weighted blend of 9 inputs, each scored 0–100. Each bar is that input's sub-score; the figure is the points it added to the 100-point composite (weight × sub-score).
- Cash flow +30.0/30.0
- ARV discount +12.3/15.0
- 1% rule +10.0/10.0
- DSCR +10.0/10.0
- Schools +3.9/10.0
- Condition / age +2.5/5.0
- Rent growth +2.4/5.0
- Livability +2.1/5.0
- Appreciation +0.0/10.0
$129,700
🖨 Deal sheet (PDF) 📄 Offer letter ✓ Due diligence
Listing remarks
Currently offering Three months of Free Space rent to new move ins, do not miss out this amazing deal! Beautiful 2 bedroom, 2 bathroom home with with brand new hardwood flooring throughout entire home. Spacious and bright kitchen with abundance of storage and counter space. Brand new windows throughout living room and dining room areas which bring natural lighting and lots of great views. Walk in closet off master bedroom. Large area off kitchen features laundry area and large space for office or multi purpose room. Beautiful fenced backyard with covered porch, large deck, and storage shed. Low maintenance yard features automatic drip sprinkler system, planter to flowers and fruit trees. Fu
Key facts
- Hardwood flooring
- Natural lighting
- Laundry area
Tags
Property features AI
Finance
- HOA & community: Senior community; Mobile home on land lease
Exterior
- Parking: 2 parking spaces
- Utilities: Public water; Public sewer
- Home design: Mobile home; Single-story
- Construction: Metal roof; Mobile home construction
- Exterior features: Community pool; Metal roof; Common-interest lot (land lease community)
Interior
- Kitchen: Dishwasher; Refrigerator; Built-in range; Gas oven; Gas cooktop; Disposal
- Bedrooms: 2 possible bedrooms
- Bathrooms: 2 full bathrooms
- Heating & cooling: Forced air heating (natural gas); Central air; Evaporative cooling; Wall/window unit(s); Whole house fan
- Interior features: Built-in range; Gas oven; Gas cooktop; Disposal; Shed(s)
- Laundry & utility: Washer; Dryer
Neighborhood map
What this means for you Summary
Snapshot
- This is a 2-bed/2.0-bath manufactured listed at $130k.
Deal economics
- At list price, monthly cash flow is $1k ($18k/yr) — positive.
- The deal already cash-flows at list — no discount required.
- Meets the 1% rule at list price ($3k rent vs $130k).
- Recommended offer: $126k (3.0% below list) — sets the bar for market timing.
- Cap rate 19.8% vs local median 2.3% in Fallbrook — top-decile yield for the area; either an underpriced asset or a hidden risk that comps aren't pricing in. Stress-test before assuming the spread holds.
Location & tenants
- Location reads 42/100 on livability (#1,364 in CA) — a working-class tenant base; expect higher turnover. Watch: schools D+, crime D-, amenities F.
- Fallbrook Union High (suburban): math 32% / reading 58% proficiency, ranked #183 of 517 in CA (top 35%) — families likely to look elsewhere, expect single-tenant / working-renter base with shorter leases.
- Market conditions: Rents soft (-0.3%/yr); 345 active listings in the ZIP; 5 comparable units currently listed for rent nearby; rentals leasing fast (median 4d on market — plan ~1-2 weeks tenant-placement turnaround); high-income renter base; 11,759 units permitted in San Diego County in 2024 (7,244 in 5+ unit buildings).
- This rent runs 32% of the median local income ($111k/yr) — at the standard rent-burdened threshold; future hikes will face affordability resistance.
Forward outlook
- Local home prices are declining (-3.0%/yr); year-one equity from $897 of loan paydown is wiped out by about $4k of value loss. Plan a longer hold.
- San Diego County population projected at +20% by 2050 — long-run rental-demand tailwind backs the buy-and-hold thesis.
- At projected returns (-3.0% appreciation + 0.0% rent growth), your $36k cash investment doubles in ~3 years — after that, you're playing with house money.
Negotiation context
- It's been on market 55 days — a 3% lower offer ($126k) is reasonable based on typical stale-listing flexibility.
- 10 sale attempts since 18y ago with the ask held roughly flat each time — persistent listings suggest the price (not the market) is what's stuck; bring a comps-based counter.
Risks & watch-outs
- Climate carrying-cost: major wildfire risk; extreme-heat days projected 5→15/yr by 2055 (HVAC capex compounding) — expect insurance premiums to compound above CPI over the hold.
Questions for the listing agent
- It's been on market 55 days. Have you received any prior offers? Is the seller open to a 3% concession, seller financing, or rate buy-down credit?
- Built in 1968 — when were the roof, HVAC, electrical panel, plumbing, and water heater last replaced?
- Is there a deadline driving the sale (1031 exchange, divorce, estate, relocation)? That informs how much negotiation room exists.
- Schools are D-rated, which usually means shorter tenancies and higher turnover. Who's the typical renter profile here, and what's been the actual vacancy rate?
- Crime grade is D in this area — have there been break-ins, vandalism, or insurance claims at this property in the last 3 years? What carrier currently insures it and at what premium?
- What's the average days-on-market for RENTAL listings here right now (not sales)? A rising rental-DOM trend means longer vacancies and softer asking-rent achievability than the comps imply.
- What's the recent tenant-quality profile in this submarket — average credit score on applications, eviction rate, late-payment / NSF rate, and stable-employment percentage? A property-management company in the area should have these aggregated.
- How much new for-sale + rental construction is in the pipeline within 1–3 miles? Heavy new supply typically softens prices + rents 12–24 months out; constrained supply supports both.
Investment metrics
- 1% rule
- 2.30% ✓
- Cap rate
- 19.79%
- Cash-on-cash
- 48.22%
- DSCR
- 3.15
- GRM
- 3.6
CMA / ARV
- ARV (on-the-fly)
- $145,152
- Comps found
- 4
Show comp detail 4 sales within ~0.75 mi
| Address | Dist | Beds/Ba | Sqft | Sold | Price | $/sf | Match |
|---|---|---|---|---|---|---|---|
| 1120 E Mission Rd #27 | 0.00mi | 2/2.0 | 1,400 (+4%) | 8mo | $139,000 | $99 | 86 |
| 1120 E Mission Rd #102 | 0.00mi | 2/2.0 | 1,440 (+7%) | 2mo | $429,000 | $298 | 86 |
| 1120 E Mission Rd #37 | 0.03mi | 2/2.0 | 1,440 (+7%) | 6mo | $75,000 | $52 | 82 |
| 1120 E Mission Rd Space 94 | 0.03mi | 2/2.0 | 1,440 (+7%) | 23mo | $155,000 | $108 | 68 |
Match score weights: distance 35% · size 25% · config 20% · recency 20%. Top-matched comps best support the ARV.
Projected returns pro-forma
-3.0% appreciation · 0.0% rent growth · sell at horizon
- IRR
- 42.3%
- Equity multiple
- 2.74×
- Total profit
- $63,224
- Equity at exit
- $19,339
- IRR
- 47.0%
- Equity multiple
- 4.89×
- Total profit
- $141,136
- Equity at exit
- $11,214
Cash invested: $36,316 (down + closing). Projections, not guarantees.
Landlord ↔ Tenant lean methodology
- Overall (STATE)
- 18 Strongly Tenant-Friendly
- State California
- 18 Strongly Tenant-Friendly · D+13
- County
- — inherits STATE
- City
- — inherits STATE
ZIP-level market 92028
- Rents YoY
- -0.3%
- Active inventory
- 345
- Price-to-rent
- 3.6×
Monthly cashflow live
- Estimated rent
- $2,982 high interval (Pro) →
- Mortgage (P&I)
- −$680
- Tax est. 1.5%
- −$162 /mo · $1,946/yr
- Insurance
- −$54
- HOA
- −$0
- Vacancy / Maint / Mgmt
- −$626
- Net cashflow
- $1,459
Break-even live
Sensitivity live
| Price | -10% $1,549 | -5% $1,504 | +0% $1,459 | +5% $1,414 | +10% $1,370 |
|---|---|---|---|---|---|
| Rent | -10% $1,224 | -5% $1,341 | +0% $1,459 | +5% $1,577 | +10% $1,695 |
| Rate | -1.0pp $1,524 | -0.5pp $1,492 | base $1,459 | +0.5pp $1,426 | +1.0pp $1,391 |
UW: 25.0% down · 7.5% · 30yr · 1.5% tax · 5.0% vac · 8.0% maint · 8.0% mgmt
Financing live
Cash to close
- Down payment
- $32,425
- Closing costs
- $3,891
- Reserves months
- —
- Total cash needed
- —
Loan-product check · same deal, 3 products live
Conventional
25% down · 7.5% · 30yr
- Down + closing
- —
- Monthly P&I
- —
- Monthly cashflow
- —
- DSCR
- —
- Eligible?
- —
Personal DTI + credit; lowest rate.
DSCR
20% down · 8.5% · 30yr
- Down + closing
- —
- Monthly P&I
- —
- Monthly cashflow
- —
- DSCR
- —
- Eligible?
- —
No personal income docs; deal must DSCR.
Hard money
10% down · 12.0% · 12mo
- Down + closing
- —
- Monthly P&I
- —
- Monthly cashflow
- —
- DSCR
- —
- Eligible?
- —
Short-term bridge; refi at stabilization.
Rent comps 5 comps
| Address | Beds | Baths | Sqft | Rent | $/sqft | DOM | Units | Dist |
|---|---|---|---|---|---|---|---|---|
| 421 Potter St Fallbrook, CA | 1.0–2.0 | 1.0–2.0 | 726 | $2,100 | $2.89 | 0d | 2 | 0.69mi |
| 757 N Stage Coach Ln Fallbrook, CA | 3.0 | 2.0 | 1508 | $3,900 | $2.59 | 22d | 1 | 0.70mi |
| 338 E Fallbrook St Fallbrook, CA | 2.0 | 2.0 | 976 | $2,495 | $2.56 | 3d | 1 | 0.91mi |
| 611 Summit Ave Fallbrook, CA | 3.0 | 2.0 | 1506 | $3,500 | $2.32 | 11d | 1 | 1.28mi |
| 744 W Fallbrook St Fallbrook, CA | 1.0–2.0 | 1.0–2.0 | 780 | $2,200 | $2.82 | 0d | 1 | 1.40mi |
Listing history 45 events
-
2026-06-18days on market $129,700 Active 55 DOM
-
2026-06-17days on market $129,700 Active 54 DOM
-
2026-06-16days on market $129,700 Active 53 DOM
-
2026-06-15days on market $129,700 Active 52 DOM
-
2026-06-13days on market $129,700 Active 50 DOM
-
2026-06-13days on market $129,700 Active 49 DOM
-
2026-06-09pricedays on market $129,700 Active 46 DOM
-
2026-06-08days on market $133,800 Active 45 DOM
-
2026-06-07days on market $133,800 Active 44 DOM
-
2026-06-04days on market $133,800 Active 41 DOM
-
2026-06-03days on market $133,800 Active 40 DOM
-
2026-06-02days on market $133,800 Active 39 DOM
-
2026-06-01days on market $133,800 Active 38 DOM
-
2026-05-31days on market $133,800 Active 37 DOM
-
2026-04-24$133,800 Active
-
2026-04-16historical
-
2026-04-13price $132,800
-
2026-04-06price $135,800
-
2026-01-27status Active
-
2026-01-27$138,800 Active
-
2025-12-12status Pending
-
2025-12-12historical
-
2025-12-11status Pending
-
2025-12-05historical
-
2025-09-08price $138,800
-
2025-08-04price $146,800
-
2025-07-24$158,888 Active
-
2024-09-27soldstatus $134,000 Closed Sale
-
2024-09-25status Pending Sale
-
2024-09-18status Active
-
2024-09-05status Pending Sale
-
2024-09-02price $139,000
-
2024-08-21$144,000 Active
-
2023-10-16soldstatus $110,000 Closed Sale
-
2023-09-06historical Active Under Contract
-
2023-08-07status Active
-
2023-07-24status Pending Sale
-
2023-05-09price $119,000
-
2023-04-13price $139,900
-
2023-03-10$149,900 Active
-
2023-02-01historical
-
2022-12-28price $155,000
-
2022-12-03$160,000 Active
-
2008-03-03soldstatus $58,000
-
2008-02-02$59,000
ⓘ Source: listings_history table (triggers on properties + properties_extension) + one-shot
backfill from property_details.listing_events for pre-trigger history.
Climate risk First Street
- Flood 1/10 Low FEMA zone X (unshaded) · 0% chance over 30 yrs
- Wildfire 7/10 Severe
- Heat 6/10 Major 5 d/yr ≥94°F today · 15 d/yr by 30 yrs out
- Wind 1/10 Low
- Air quality 4/10 Moderate 5 unhealthy d/yr today · 6 by 30 yrs out
Nearby sold comps map
Loading sold comps map…
Walkable amenities ~0.75 mi
Loading nearby amenities…
Taxation est. · year 1
- Rental income
- $35,779
- − Mortgage interest
- −$7,265
- − Property taxes
- −$1,946
- − Insurance
- −$648
- − Repairs & maintenance
- −$2,862
- − Management
- −$2,862
- − Depreciation
- −$3,773
- Taxable income
- $16,422
- Est. tax owed @ 24.0%
- −$3,941
- After-tax cash flow
- $13,568/yr
For passive investors: Depreciation is non-cash, so a rental often shows a tax loss while cash-flowing — sheltering income. Rental losses are passive: they offset passive income freely, and up to $25,000/yr can offset ordinary (W-2) income if you actively participate and your MAGI is under $100k (phasing out to $0 by $150k); unused losses carry forward. On sale, claimed depreciation is recaptured at up to 25%, and gains may owe capital-gains tax (a 1031 exchange can defer both). Figures are a year-1 estimate at your 24.0% rate — not tax advice; consult a CPA.
Schools (NCES district)
- District
- Fallbrook Union High
- NCES district ID
- 0613530
- Math proficiency
- 32% ▲ 11.00%
- Reading proficiency
- 58% ▲ 9.00%
- Median HH income
- $56,644
- Composite
- 39.17/100
- National rank
- #4025
- State rank
- #183 of 517 in CA
Livability — Fallbrook
- Score
- 42/100
- State rank
- #1364
- US rank
- #27057
Category grades
Schools grade is shown separately in the Schools card above.
Census & demographics
- Census place
- Fallbrook, CA
- County
- San Diego County · 3,178,799 people
- City population
- 52,227
- Metro
- San Diego-Chula Vista-Carlsbad, CA
- Population (ZIP)
- 52,227
- Household income
- $111,290
- Rent vs Own
- Severe rent burden
- 1384.0
Population outlook (San Diego County) Hauer SSP2
- Today (2025)
- 3,678,185 people
- By 2030
- 3,856,546 · +4.8%
- By 2040
- 4,171,407 · +13.4%
- By 2050
- 4,421,607 · +20.2%
- By 2075
- 4,831,599 · +31.4%
- By 2100
- 4,832,502 · +31.4%
Race, ethnicity, and origin ACS 2023
- Neighborhood character
- Diverse neighborhood (Simpson 0.59)
- Race & ethnicity
- White 48% Hispanic / Latino 42% Two or more races 21% Asian 4% Black 2% Native American 1%
- Hispanic origin (detail)
- Mexican 35%
- Common ancestry
- Slovak 2% Italian 2% Romanian 2%
- Foreign-born
- 21% · Canada, Vietnam, China
- Languages at home
- 66% English-only · Spanish 29% Tagalog/Filipino 1% Other Asian/Pacific 1%
Political lean MEDSL · San Diego
- 2024 margin
- D (+16.8) · D 56.9% · R 40.1% · Other 2.9%
- 2008→2024 swing
- +6.6pp toward D · 2008: 10.2pp · 2024: 16.8pp
- All cycles
- 2024: D+16.8 2020: D+22.8 2016: D+17.8 2012: D+5.1 2008: D+10.2
Not yet ingested
- Civics
- —
Market trends
- HPI YoY
- ▼ -533.50%
- Current HPI
- 320.7162
- Rent YoY
- ▼ -0.35%
- Metro
- San Diego-Chula Vista-Carlsbad, CA
- State GDP YoY
- ▲ 3.21%
- F500 in state
- 116
Industry mix (Fortune 500 HQ in CA)
| Industry | F500 HQs | Revenue |
|---|---|---|
| Technology | 27 | $1,492B |
|
||
| Financial Services | 3 | $174B |
|
||
| Retail | 3 | $44B |
|
||
| Insurance | 3 | $26B |
|
||
| Media / Entertainment | 2 | $115B |
|
||
| Pharmaceuticals / Biotech | 2 | $62B |
|
||
Price history
+126.8% since first listed31 events — show timeline
- 2026-04-24 Listed $133,800 SDMLS
- 2026-04-16 Listing Removed — SDMLS
- 2026-04-13 Price Changed $132,800 SDMLS
- 2026-04-06 Price Changed $135,800 SDMLS
- 2026-01-27 Relisted — SDMLS
- 2026-01-27 Listed $138,800 SDMLS
- 2025-12-12 Pending — SDMLS
- 2025-12-12 Listing Removed — SDMLS
- 2025-12-11 Pending — SDMLS
- 2025-12-05 Listing Removed — SDMLS
- 2025-09-08 Price Changed $138,800 SDMLS
- 2025-08-04 Price Changed $146,800 SDMLS
- 2025-07-24 Listed $158,888 SDMLS
- 2024-09-27 Sold (MLS) $134,000 CRMLS
- 2024-09-25 Pending — CRMLS
- 2024-09-18 Relisted — CRMLS
- 2024-09-05 Pending — CRMLS
- 2024-09-02 Price Changed $139,000 CRMLS
- 2024-08-21 Listed $144,000 CRMLS
- 2023-10-16 Sold (MLS) $110,000 CRMLS
- 2023-09-06 Contingent — CRMLS
- 2023-08-07 Relisted — CRMLS
- 2023-07-24 Pending — CRMLS
- 2023-05-09 Price Changed $119,000 CRMLS
- 2023-04-13 Price Changed $139,900 CRMLS
- 2023-03-10 Listed $149,900 CRMLS
- 2023-02-01 Listing Removed — SDMLS
- 2022-12-28 Price Changed $155,000 SDMLS
- 2022-12-03 Listed $160,000 SDMLS
- 2008-03-03 Sold (MLS) $58,000 CRMLS
- 2008-02-02 Listed $59,000 CRMLS
Cash-flow waterfall
monthlySold comps — $/sqft
last 12 mo · ≤1 miLoading sold comps…