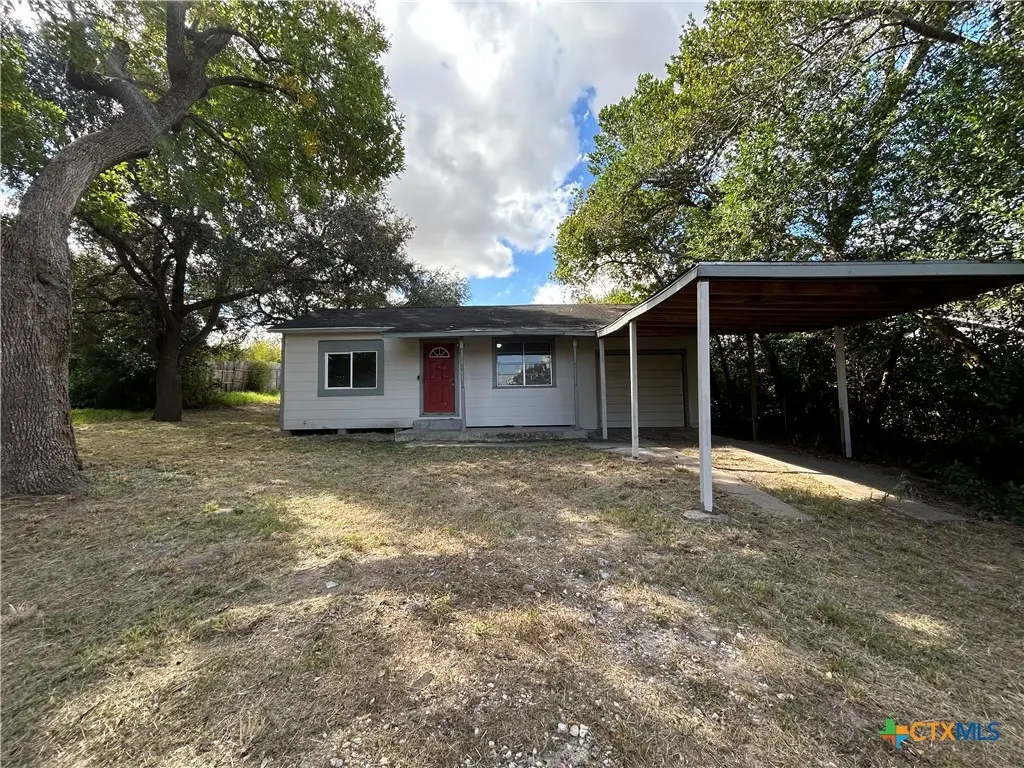
236 Hilltop Dr · Bloomington, TX
Flood risk 1/10 · Minimal
- FEMA flood zone
- X
- Chance of flooding over 30 yrs
- 0.0%
- Est. flood insurance / yr
- $507 – $1,088
Fire risk 6/10 · Moderate
- Est. fire insurance / yr
- $1,222 – $2,270
Heat risk 9/10 · Severe
- Hot days now (above 111°F)
- 7 days/yr
- Hot days in 30 yrs
- 23 days/yr
Wind risk 9/10 · Severe
- Chance of severe wind over 30 yrs
- 99.0%
Air-quality risk 1/10 · Minimal
- Unhealthy air days now
- 0 days/yr
- Unhealthy air days in 30 yrs
- 0 days/yr
Risk factors via First Street. Map © Google.
Why this score? — see what drove the C- grade
The composite is a weighted blend of 9 inputs, each scored 0–100. Each bar is that input's sub-score; the figure is the points it added to the 100-point composite (weight × sub-score).
- Cash flow +22.7/30.0
- ARV discount +7.5/15.0
- DSCR +7.3/10.0
- 1% rule +4.9/10.0
- Livability +3.0/5.0
- Rent growth +2.5/5.0
- Schools +2.5/10.0
- Condition / age +2.5/5.0
- Appreciation +0.0/10.0
$155,000
🖨 Deal sheet (PDF) 📄 Offer letter ✓ Due diligence
Listing remarks
Come take a look at this charming 2 Bedroom 2 Bath home in Crescent Valley. With updated paint, cabinets, countertops, and carpet along with a new roof! Surrounded by mature trees that provide shade beauty and a sense of established charm. Covered parking adds valuable convenience and an added layer of comfort for everyday ease. Great location for country living with plenty of room for relaxation or entertaining. This home qualifies for a zero percent down USDA loan with approved credit.
Key facts
- Updated cabinets
- Covered parking
- Updated paint
Tags
Property features AI
Exterior
- Parking: 1-car garage; 1-car carport
- Utilities: Septic tank
- Home design: Single-story; Resale property
- Construction: Board and batten siding; Shingle/composition roof; Slab foundation; Built (year per assessor)
- Exterior features: Covered porch
Interior
- Kitchen: Dishwasher; Oven
- Flooring: Carpet; Ceramic tile
- Bathrooms: 2 full bathrooms
- Heating & cooling: Central cooling (one unit)
- Interior features: All bedrooms on one level; Ceiling fan(s); Tub with shower; Kitchen and dining combined
- Laundry & utility: Laundry in garage
Neighborhood map
What this means for you Summary
Snapshot
- This is a 3-bed/2.0-bath single-family listed at $155k.
Deal economics
- At list price, monthly cash flow is $265 ($3k/yr) — positive.
- The deal already cash-flows at list — no discount required.
- To meet the 1% rule (rent ≥ 1% of price), the offer needs to be $154k (0.7% below list).
- Recommended offer: $153k (1.5% below list) — sets the bar for market timing.
Location & tenants
- Location reads 59/100 on livability (#1,163 in TX) — a working-class tenant base; expect higher turnover. Strengths: cost of living A+, crime B+; Watch: health & safety C-, amenities F, commute F.
- Victoria ISD (urban): math 24% / reading 33% proficiency, ranked #645 of 826 in TX (top 78%) — low school quality limits family demand, transient renter base, plan for 1-2y turnover.
- Zoned schools: Howell Middle (math 28% / reading 37%, grade F, #947 of 1,662 statewide, top 58%, 757 students, 68% FRL); Victoria East H S (math 23% / reading 38%, grade F, #1,085 of 1,632 statewide, top 67%, 1,845 students, 65% FRL).
- Market conditions: 148 active listings in the ZIP; 43 units permitted in Victoria County in 2024 (0 in 5+ unit buildings).
Forward outlook
- Local home prices are declining (-3.0%/yr); year-one equity from $1k of loan paydown is wiped out by about $5k of value loss. Plan a longer hold.
- Victoria County population projected at +34% by 2050 — long-run rental-demand tailwind backs the buy-and-hold thesis.
Negotiation context
- It's been on market 26 days — a 2% lower offer ($153k) is reasonable based on typical stale-listing flexibility.
- 3 sale attempts with the ask held roughly flat each time — persistent listings suggest the price (not the market) is what's stuck; bring a comps-based counter.
- Current owner paid $30k; list at $155k implies a 417% gain — meaningful room to come down on a strong offer.
Risks & watch-outs
- Watch-outs: built in 1957 — expect roof / HVAC / electrical / plumbing capex.
- Climate carrying-cost: severe wind risk, 99% chance of damaging wind over 30y; major wildfire risk; extreme-heat days projected 7→23/yr by 2055 (HVAC capex compounding) — expect insurance premiums to compound above CPI over the hold.
Questions for the listing agent
- Built in 1957 — when were the roof, HVAC, electrical panel, plumbing, and water heater last replaced?
- Is there a deadline driving the sale (1031 exchange, divorce, estate, relocation)? That informs how much negotiation room exists.
- Schools are F-rated, which usually means shorter tenancies and higher turnover. Who's the typical renter profile here, and what's been the actual vacancy rate?
- What's the average days-on-market for RENTAL listings here right now (not sales)? A rising rental-DOM trend means longer vacancies and softer asking-rent achievability than the comps imply.
- What's the recent tenant-quality profile in this submarket — average credit score on applications, eviction rate, late-payment / NSF rate, and stable-employment percentage? A property-management company in the area should have these aggregated.
- How much new for-sale + rental construction is in the pipeline within 1–3 miles? Heavy new supply typically softens prices + rents 12–24 months out; constrained supply supports both.
Investment metrics
- 1% rule
- 0.99% ✗
- Cap rate
- 8.35%
- Cash-on-cash
- 7.34%
- DSCR
- 1.33
- GRM
- 8.4
CMA / ARV
- ARV (median comp)
- $59,913
- List price
- $155,000
- Delta
- 100.12%
- Verdict
- OVERPRICED
- Comps
- 1 within 2.0 mi
Projected returns pro-forma
-3.0% appreciation · 3.0% rent growth · sell at horizon
- IRR
- -5.1%
- Equity multiple
- 0.81×
- Total profit
- $-8,269
- Equity at exit
- $23,111
- IRR
- 4.5%
- Equity multiple
- 1.33×
- Total profit
- $14,352
- Equity at exit
- $13,402
Cash invested: $43,400 (down + closing). Projections, not guarantees.
Landlord ↔ Tenant lean methodology
- Overall (STATE)
- 87 Strongly Landlord-Friendly
- State Texas
- 87 Strongly Landlord-Friendly · R+5
- County
- — inherits STATE
- City
- — inherits STATE
ZIP-level market 77905
- Home prices YoY
- -33.0%
- Active inventory
- 148
- Price-to-rent
- 8.4×
Monthly cashflow live
- Estimated rent
- $1,539 medium interval (Pro) →
- Mortgage (P&I)
- −$813
- Tax from tax record
- −$73 /mo · $876/yr
- Insurance
- −$65
- HOA
- −$0
- Vacancy / Maint / Mgmt
- −$323
- Net cashflow
- $265
Break-even live
Sensitivity live
| Price | -10% $353 | -5% $309 | +0% $265 | +5% $221 | +10% $178 |
|---|---|---|---|---|---|
| Rent | -10% $144 | -5% $205 | +0% $265 | +5% $326 | +10% $387 |
| Rate | -1.0pp $343 | -0.5pp $305 | base $265 | +0.5pp $225 | +1.0pp $184 |
UW: 25.0% down · 7.5% · 30yr · 1.5% tax · 5.0% vac · 8.0% maint · 8.0% mgmt
Financing live
Cash to close
- Down payment
- $38,750
- Closing costs
- $4,650
- Reserves months
- —
- Total cash needed
- —
Loan-product check · same deal, 3 products live
Conventional
25% down · 7.5% · 30yr
- Down + closing
- —
- Monthly P&I
- —
- Monthly cashflow
- —
- DSCR
- —
- Eligible?
- —
Personal DTI + credit; lowest rate.
DSCR
20% down · 8.5% · 30yr
- Down + closing
- —
- Monthly P&I
- —
- Monthly cashflow
- —
- DSCR
- —
- Eligible?
- —
No personal income docs; deal must DSCR.
Hard money
10% down · 12.0% · 12mo
- Down + closing
- —
- Monthly P&I
- —
- Monthly cashflow
- —
- DSCR
- —
- Eligible?
- —
Short-term bridge; refi at stabilization.
Listing history 25 events
-
2026-06-21days on market $155,000 Active 26 DOM
-
2026-06-19days on market $155,000 Active 24 DOM
-
2026-06-18days on market $155,000 Active 23 DOM
-
2026-06-17days on market $155,000 Active 22 DOM
-
2026-06-16days on market $155,000 Active 21 DOM
-
2026-06-15days on market $155,000 Active 20 DOM
-
2026-06-14days on market $155,000 Active 18 DOM
-
2026-06-13days on market $155,000 Active 17 DOM
-
2026-06-10days on market $155,000 Active 15 DOM
-
2026-06-09days on market $155,000 Active 14 DOM
-
2026-06-08days on market $155,000 Active 13 DOM
-
2026-06-07days on market $155,000 Active 12 DOM
-
2026-06-03days on market $155,000 Active 8 DOM
-
2026-06-02days on market $155,000 Active 7 DOM
-
2026-06-01days on market $155,000 Active 6 DOM
-
2026-05-31days on market $155,000 Active 5 DOM
-
2026-05-30days on market $155,000 Active 4 DOM
-
2026-05-04historical
-
2026-02-19price $119,900
-
2025-12-03price $124,900
-
2025-11-13$129,900 Active
-
2025-11-13historical
-
2025-10-20soldstatus
-
2025-10-07$129,900 Active
-
2005-09-07soldstatus $30,000
ⓘ Source: listings_history table (triggers on properties + properties_extension) + one-shot
backfill from property_details.listing_events for pre-trigger history.
Tax reassessment forecast TX · Resets to sale price
- Current annual tax
- $876 · $73/mo
- Projected year-2 tax
- $2,836 · $236/mo
- Expected delta
- +$1,961/yr (+$163/mo · 223.9%)
ⓘ Screening estimate from a state-policy table — verify with the county assessor before closing.
Climate risk First Street
- Flood 1/10 Low FEMA zone X · 0% chance over 30 yrs
- Wildfire 6/10 Major
- Heat 9/10 Extreme 7 d/yr ≥111°F today · 23 d/yr by 30 yrs out
- Wind 9/10 Extreme 99% chance of damaging wind over 30 yrs
- Air quality 1/10 Low 0 unhealthy d/yr today · 0 by 30 yrs out
Nearby sold comps map
Loading sold comps map…
Walkable amenities ~0.75 mi
Loading nearby amenities…
Taxation est. · year 1
- Rental income
- $18,467
- − Mortgage interest
- −$8,682
- − Property taxes
- −$876
- − Insurance
- −$775
- − Repairs & maintenance
- −$1,477
- − Management
- −$1,477
- − Depreciation
- −$4,509
- Taxable income
- $670
- Est. tax owed @ 24.0%
- −$161
- After-tax cash flow
- $3,023/yr
For passive investors: Depreciation is non-cash, so a rental often shows a tax loss while cash-flowing — sheltering income. Rental losses are passive: they offset passive income freely, and up to $25,000/yr can offset ordinary (W-2) income if you actively participate and your MAGI is under $100k (phasing out to $0 by $150k); unused losses carry forward. On sale, claimed depreciation is recaptured at up to 25%, and gains may owe capital-gains tax (a 1031 exchange can defer both). Figures are a year-1 estimate at your 24.0% rate — not tax advice; consult a CPA.
Schools (NCES district)
- District
- Victoria ISD
- NCES district ID
- 4844150
- Math proficiency
- 24% ▼ -12.00%
- Reading proficiency
- 33% ▼ -2.00%
- Median HH income
- $50,534
- Composite
- 24.98/100
- National rank
- #7562
- State rank
- #645 of 826 in TX
Livability — Bloomington
- Score
- 59/100
- State rank
- #1163
- US rank
- #20339
Category grades
Schools grade is shown separately in the Schools card above.
Census & demographics
- City population
- 1,442
- Population (ZIP)
- 16,346
Population outlook (Victoria County) Hauer SSP2
- Today (2025)
- 106,119 people
- By 2030
- 113,161 · +6.6%
- By 2040
- 127,402 · +20.1%
- By 2050
- 141,953 · +33.8%
- By 2075
- 179,410 · +69.1%
- By 2100
- 200,127 · +88.6%
Race, ethnicity, and origin ACS 2023
- Neighborhood character
- Majority White (63%)
- Race & ethnicity
- White 63% Hispanic / Latino 30% Two or more races 18% Black 4%
- Hispanic origin (detail)
- Mexican 27%
- Common ancestry
- Slovak 2% Serbian 2% Lithuanian 1%
- Foreign-born
- 3% · Canada
- Languages at home
- 87% English-only · Spanish 12%
Political lean MEDSL · Victoria
- 2024 margin
- Solid R (+42.6) · D 28.4% · R 71.0%
- 2008→2024 swing
- -9.0pp toward R · 2008: -33.6pp · 2024: -42.6pp
- All cycles
- 2024: R+42.6 2020: R+38.0 2016: R+40.0 2012: R+37.8 2008: R+33.6
Not yet ingested
- Civics
- —
Market trends
- HPI YoY
- ▼ -68.60%
- Current HPI
- 139.4036
- Rent YoY
- —
- Metro
- —
- State GDP YoY
- ▲ 3.95%
- F500 in state
- 110
Industry mix (Fortune 500 HQ in TX)
| Industry | F500 HQs | Revenue |
|---|---|---|
| Energy | 16 | $1,198B |
|
||
| Technology | 5 | $198B |
|
||
| Engineering / Construction | 4 | $72B |
|
||
| Energy Services | 3 | $60B |
|
||
| Utilities | 3 | $41B |
|
||
| Healthcare | 2 | $330B |
|
||
Price history
+416.7% since first listed9 events — show timeline
- 2026-05-25 Listed $155,000 CTXMLS
- 2026-05-04 Listing Removed — CTXMLS
- 2026-02-19 Price Changed $119,900 CTXMLS
- 2025-12-03 Price Changed $124,900 CTXMLS
- 2025-11-13 Listing Removed — CTXMLS
- 2025-11-13 Listed $129,900 CTXMLS
- 2025-10-20 Sold (Public Records) — Public Records
- 2025-10-07 Listed $129,900 CTXMLS
- 2005-09-07 Sold (Public Records) $30,000 Public Records
Property tax history
-2.3%/yrLatest (2025): $876 · -31.7% YoY. Source: county tax records.
Cash-flow waterfall
monthlySold comps — $/sqft
last 12 mo · ≤1 miLoading sold comps…