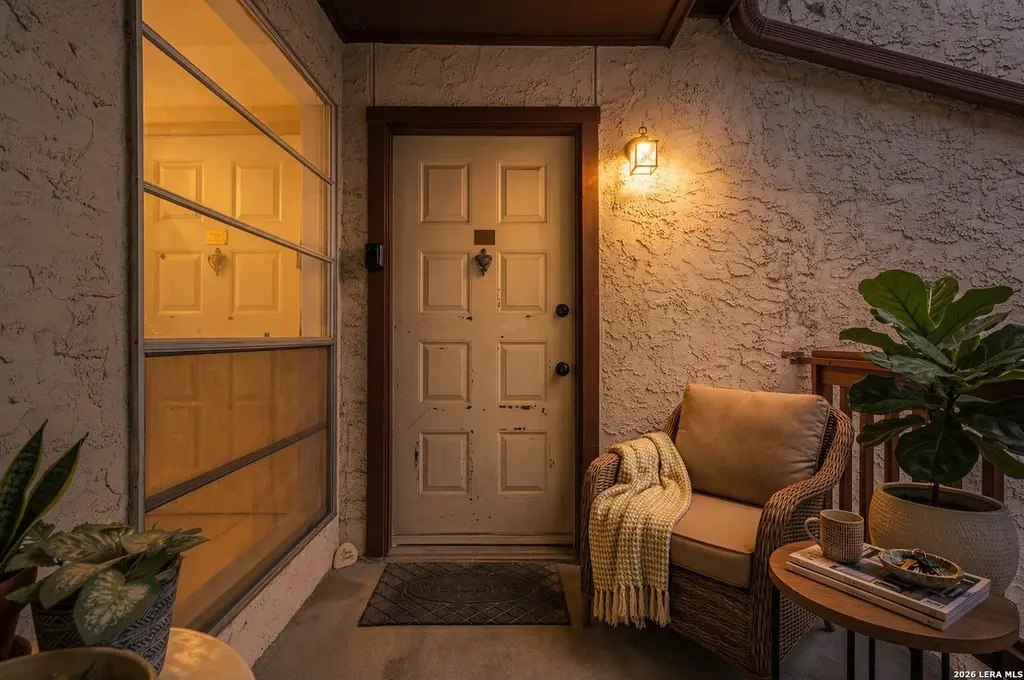
10527 Perrin Beitel Unit C211 · San Antonio, TX
Flood risk No data
- FEMA flood zone
- —
- Chance of flooding over 30 yrs
- —
- Est. flood insurance / yr
- —
Fire risk No data
- Est. fire insurance / yr
- —
Heat risk No data
- Hot days now (above threshold)
- —
- Hot days in 30 yrs
- —
Wind risk No data
- Chance of severe wind over 30 yrs
- —
Air-quality risk No data
- Unhealthy air days now
- —
- Unhealthy air days in 30 yrs
- —
Risk factors via First Street. Map © Google.
Why this score? — see what drove the D grade
The composite is a weighted blend of 9 inputs, each scored 0–100. Each bar is that input's sub-score; the figure is the points it added to the 100-point composite (weight × sub-score).
- ARV discount +15.0/15.0
- Cash flow +6.6/30.0
- 1% rule +5.2/10.0
- Livability +4.0/5.0
- Schools +3.8/10.0
- Condition / age +3.8/5.0
- Rent growth +2.4/5.0
- DSCR +0.9/10.0
- Appreciation +0.0/10.0
$110,000
🖨 Deal sheet (PDF) 📄 Offer letter ✓ Due diligence
Listing remarks MLS
Dont qualify for traditional loans? This home qualifies for rent to own! If you've been thinking about buying but weren't sure where to start-this is your opportunity. This well-maintained condo at 10527 Perrin Beitel #C211 offers a smart, affordable path into homeownership or a strong addition to an investment portfolio. With a functional layout and comfortable living space, it's designed for low-maintenance living and everyday convenience. For first-time buyers, this is your chance to own for less than you may be paying in rent, while building equity instead of paying a landlord. For investors, the value is just as clear-high rental demand, low entry price, and strong long-term potential in an established area. Low-maintenance lifestyle Affordable entry point into ownership Ideal for rental or personal use Convenient access to major roads, shopping, and everyday essentials Whether you're looking for your first home or your next investment, this property offers flexibility and opportunity in one of the most accessible price points in the city.
Key facts
- $310 HOA
- Community pool
- Built 1996
Neighborhood map
What this means for you Summary
Snapshot
- This is a 2-bed/2.0-bath condo listed at $110k. Condition is rated good.
Deal economics
- At list price, monthly cash flow is $-181 ($-2k/yr) — negative.
- To cash-flow at today's rent, offer at most $84k (23.8% below list).
- Meets the 1% rule at list price ($1k rent vs $110k).
- Recommended offer: $84k (23.8% below list) — sets the bar for cash-flow.
Location & tenants
- Location reads 80/100 on livability (#31 in TX, #1,616 nationally) — a professional / high-income tenant draw. Strengths: amenities A+, commute A+, cost of living A+; Watch: crime F.
- North East ISD (urban): math 38% / reading 49% proficiency, ranked #276 of 826 in TX (top 33%) — families likely to look elsewhere, expect single-tenant / working-renter base with shorter leases.
- Zoned schools: Clear Spring El (math 17% / reading 22%, grade F, #3,583 of 4,322 statewide, top 86%, 318 students, 89% FRL); Krueger Middle (math 37% / reading 34%, grade F, #827 of 1,662 statewide, top 51%, 813 students, 77% FRL); Roosevelt H S (math 20% / reading 40%, grade F, #1,096 of 1,632 statewide, top 68%, 2,599 students, 72% FRL) — zoned schools average 79% FRL vs 41% district-wide (38 pts higher); higher-poverty schools than district average — tighter screening recommended.
- Zoned-school proficiency averages 28% at this address vs 44% district-wide (-15 pts) — the specific schools serving this property underperform the North East ISD average; the district grade overstates school quality for this exact location.
- Market conditions: Rents soft (-0.4%/yr); 144 active listings in the ZIP; 40 comparable units currently listed for rent nearby; rentals at typical pace (median 18d on market — plan ~3-4 weeks tenant-placement turnaround); 8,308 units permitted in Bexar County in 2024 (2,506 in 5+ unit buildings).
Forward outlook
- Local home prices are declining (-3.0%/yr); year-one equity from $761 of loan paydown is wiped out by about $3k of value loss. Plan a longer hold.
- Bexar County population projected at +50% by 2050 — long-run rental-demand tailwind backs the buy-and-hold thesis.
Negotiation context
- It's been on market 102 days — a 9% lower offer ($100k) is reasonable based on typical stale-listing flexibility.
Risks & watch-outs
- Watch-outs: HOA is 28% of rent.
Questions for the listing agent
- What do current leases actually rent for vs. the listed asking? Can we see a recent rent roll and the last 12 months of T-12 income?
- It's been on market 102 days. Have you received any prior offers? Is the seller open to a 24% concession, seller financing, or rate buy-down credit?
- What does the HOA fee cover, when was the last increase, and are there any pending special assessments or reserve-fund shortfalls?
- Any open or pending special assessments — roof, HVAC, plumbing, elevator, façade? What's the per-unit balance and payoff schedule, and is the seller paying it off at close or rolling it to the buyer?
- Why hasn't it sold? Are there any deal-killer items the seller is aware of (foundation, flood, title, zoning, code violations)?
- Is there a deadline driving the sale (1031 exchange, divorce, estate, relocation)? That informs how much negotiation room exists.
- Crime grade is F in this area — have there been break-ins, vandalism, or insurance claims at this property in the last 3 years? What carrier currently insures it and at what premium?
- The area grade is low — what's the realistic commute time and amenity access for the typical tenant pool here? Any planned neighborhood developments (good or bad) we should know about?
- What's the average days-on-market for RENTAL listings here right now (not sales)? A rising rental-DOM trend means longer vacancies and softer asking-rent achievability than the comps imply.
- What's the recent tenant-quality profile in this submarket — average credit score on applications, eviction rate, late-payment / NSF rate, and stable-employment percentage? A property-management company in the area should have these aggregated.
- How much new apartment / multifamily construction is in the pipeline within 1–3 miles? Heavy new supply (>2% of stock underway) typically softens rents 12–24 months out; light construction supports rent growth.
Investment metrics
- 1% rule
- 1.02% ✓
- Cap rate
- 4.32%
- Cash-on-cash
- -7.04%
- DSCR
- 0.69
- GRM
- 8.1
CMA / ARV
- ARV (median comp)
- $132,921
- List price
- $110,000
- Delta
- -17.24%
- Verdict
- UNDERPRICED
- Comps
- 14 within 1.0 mi
Projected returns pro-forma
-3.0% appreciation · 0.0% rent growth · sell at horizon
- IRR
- -33.5%
- Equity multiple
- -0.05×
- Total profit
- $-32,420
- Equity at exit
- $16,401
- IRR
- -77.3%
- Equity multiple
- -0.78×
- Total profit
- $-54,953
- Equity at exit
- $9,511
Cash invested: $30,800 (down + closing). Projections, not guarantees.
Landlord ↔ Tenant lean methodology
- Overall (STATE)
- 87 Strongly Landlord-Friendly
- State Texas
- 87 Strongly Landlord-Friendly · R+5
- County
- — inherits STATE
- City
- — inherits STATE
ZIP-level market 78217
- Home prices YoY
- -30.2%
- Rents YoY
- -0.4%
- Active inventory
- 144
- Price-to-rent
- 8.1×
Monthly cashflow live
- Estimated rent
- $1,126 high interval (Pro) →
- Mortgage (P&I)
- −$577
- Tax est. 1.5%
- −$138 /mo · $1,650/yr
- Insurance
- −$46
- HOA
- −$310
- Vacancy / Maint / Mgmt
- −$236
- Net cashflow
- $-181
Break-even live
Sensitivity live
| Price | -10% $-105 | -5% $-143 | +0% $-181 | +5% $-219 | +10% $-257 |
|---|---|---|---|---|---|
| Rent | -10% $-270 | -5% $-225 | +0% $-181 | +5% $-136 | +10% $-92 |
| Rate | -1.0pp $-125 | -0.5pp $-153 | base $-181 | +0.5pp $-209 | +1.0pp $-238 |
UW: 25.0% down · 7.5% · 30yr · 1.5% tax · 5.0% vac · 8.0% maint · 8.0% mgmt
Financing live
Cash to close
- Down payment
- $27,500
- Closing costs
- $3,300
- Reserves months
- —
- Total cash needed
- —
Loan-product check · same deal, 3 products live
Conventional
25% down · 7.5% · 30yr
- Down + closing
- —
- Monthly P&I
- —
- Monthly cashflow
- —
- DSCR
- —
- Eligible?
- —
Personal DTI + credit; lowest rate.
DSCR
20% down · 8.5% · 30yr
- Down + closing
- —
- Monthly P&I
- —
- Monthly cashflow
- —
- DSCR
- —
- Eligible?
- —
No personal income docs; deal must DSCR.
Hard money
10% down · 12.0% · 12mo
- Down + closing
- —
- Monthly P&I
- —
- Monthly cashflow
- —
- DSCR
- —
- Eligible?
- —
Short-term bridge; refi at stabilization.
Rent comps 40 comps
| Address | Beds | Baths | Sqft | Rent | $/sqft | DOM | Units | Dist |
|---|---|---|---|---|---|---|---|---|
| 10527 Perrin Beitel Rd San Antonio, TX | 1.0–2.0 | 1.0–2.0 | 899 | $1,200 | $1.33 | 0d | 2 | 0.06mi |
| 3919 Perrin Central Blvd San Antonio, TX | 1.0–2.0 | 1.0–2.0 | 778 | $1,185 | $1.52 | 0d | 42 | 0.23mi |
| 3787 Perrin Central Blvd Apt 710 San Antonio, TX | 2.0 | 2.0 | 892 | $961 | $1.08 | 0d | 1 | 0.28mi |
| 3787 Perrin Central Blvd Apt 610 San Antonio, TX | 1.0 | 1.0 | 648 | $824 | $1.27 | 0d | 1 | 0.28mi |
| 3902 Perrin Central Blvd San Antonio, TX | 1.0–2.0 | 1.0–2.0 | 777 | $1,424 | $1.83 | 0d | 29 | 0.34mi |
| 3902 Perrin Central Blvd Unit 710 San Antonio, TX | 2.0 | 2.0 | 976 | $940 | $0.96 | 23d | 1 | 0.35mi |
| 11206 Center Point Rd San Antonio, TX | 2.0 | 2.0 | 1000 | $1,225 | $1.23 | 23d | 1 | 0.36mi |
| 3800 Perrin Central Blvd Unit 610 San Antonio, TX | 1.0 | 1.0 | 610 | $823 | $1.35 | 0d | 1 | 0.40mi |
| 3800 Perrin Central Blvd Unit 710 San Antonio, TX | 2.0 | 2.0 | 742 | $913 | $1.23 | 0d | 1 | 0.40mi |
| 3800 Perrin Central Blvd San Antonio, TX | 1.0–3.0 | 1.0–2.0 | 940 | $1,244 | $1.32 | 25d | 35 | 0.43mi |
| 3800 Perrin Central Blvd San Antonio, TX | 1.0–3.0 | 1.0–2.0 | 940 | $1,219 | $1.30 | 45d | 38 | 0.43mi |
| 4409 Terra Summit Rd San Antonio, TX | 2.0 | 2.0 | 982 | $1,195 | $1.22 | 45d | 1 | 0.43mi |
| 11235 Terra Loop Rd San Antonio, TX | 2.0 | 2.0 | 982 | $1,225 | $1.25 | 25d | 1 | 0.46mi |
| 11207 Terra Loop Rd San Antonio, TX | 2.0 | 2.0 | 980 | $1,225 | $1.25 | 23d | 1 | 0.46mi |
| 11211 Terra Loop Rd San Antonio, TX | 2.0 | 2.0 | 982 | $1,225 | $1.25 | 25d | 1 | 0.47mi |
| 11607 Capotillo St Unit 4 San Antonio, TX | 2.0 | 1.5 | 968 | $1,020 | $1.05 | 17d | 1 | 0.60mi |
| 4502 Longvale Dr San Antonio, TX | 3.0 | 2.0 | 1092 | $1,600 | $1.47 | 6d | 1 | 0.67mi |
| 4530 Longvale Dr San Antonio, TX | 3.0 | 1.0 | 1000 | $1,375 | $1.38 | 16d | 1 | 0.72mi |
| 9511 Perrin Beitel Apt 710 San Antonio, TX | 2.0 | 2.0 | 1000 | $973 | $0.97 | 0d | 1 | 0.73mi |
| 9511 Perrin Beitel Apt 610 San Antonio, TX | 1.0 | 1.0 | 600 | $673 | $1.12 | 0d | 1 | 0.73mi |
| 4527 Clear Spring Dr San Antonio, TX | 3.0 | 1.5 | 1098 | $1,350 | $1.23 | 25d | 1 | 0.74mi |
| 4518 Clear Spring Dr San Antonio, TX | 3.0 | 1.0 | 864 | $1,275 | $1.48 | 16d | 1 | 0.74mi |
| 4306 Limpio St San Antonio, TX | 3.0 | 1.0 | 976 | $1,195 | $1.22 | 15d | 1 | 0.77mi |
| 4620 Thousand Oaks Dr San Antonio, TX | 1.0–2.0 | 1.0–2.0 | 717 | $1,205 | $1.68 | 9d | 19 | 0.83mi |
| 9338 Perrin Beitel Unit 606 San Antonio, TX | 2.0 | 1.0 | 850 | $799 | $0.94 | 25d | 1 | 0.84mi |
| 9338 Perrin Beitel Apt 411 San Antonio, TX | 1.0 | 1.0 | 750 | $1,100 | $1.47 | 25d | 1 | 0.84mi |
| 9338 Perrin Beitel Unit 407 San Antonio, TX | 1.0 | 1.0 | 750 | $649 | $0.87 | 45d | 1 | 0.84mi |
| 9338 Perrin Beitel Unit 405 San Antonio, TX | 1.0 | 1.0 | 750 | $799 | $1.07 | 45d | 1 | 0.84mi |
| 9338 Perrin Beitel Unit 1102 San Antonio, TX | 2.0 | 1.0 | 950 | $1,275 | $1.34 | 45d | 1 | 0.84mi |
| 9338 Perrin Beitel Apt 1108 San Antonio, TX | 2.0 | 1.0 | 950 | $799 | $0.84 | 45d | 1 | 0.84mi |
| 3903 Barrington St Apt 710 San Antonio, TX | 2.0 | 2.0 | 1004 | $919 | $0.92 | 0d | 1 | 0.98mi |
| 3903 Barrington St Unit 610 San Antonio, TX | 1.0 | 1.0 | 740 | $749 | $1.01 | 0d | 1 | 0.98mi |
| 11906 Las Vegas St San Antonio, TX | 3.0 | 1.0 | 976 | $1,195 | $1.22 | 3d | 1 | 0.99mi |
| 10631 Nacogdoches Rd San Antonio, TX | 1.0–2.0 | 1.0–2.0 | 748 | $1,280 | $1.71 | 3d | 12 | 0.99mi |
| 10631 Nacogdoches Rd Unit 710 San Antonio, TX | 2.0 | 2.0 | 929 | $1,414 | $1.52 | 12d | 1 | 1.01mi |
| 10631 Nacogdoches Rd Unit 610 San Antonio, TX | 1.0 | 1.0 | 750 | $1,094 | $1.46 | 12d | 1 | 1.01mi |
| 3843 Barrington St Unit 242K San Antonio, TX | 2.0 | 2.0 | 884 | $1,495 | $1.69 | 17d | 1 | 1.05mi |
| 3843 Barrington St San Antonio, TX | 1.0 | 1.0 | 918 | $995 | $1.08 | 25d | 1 | 1.05mi |
| 3843 Barrington St Unit 165Q San Antonio, TX | 2.0 | 2.0 | 888 | $995 | $1.12 | 45d | 1 | 1.05mi |
| 3843 Barrington St Unit 160P San Antonio, TX | 1.0 | 1.0 | 631 | $925 | $1.47 | 23d | 1 | 1.05mi |
HOA detail condo
- Monthly dues
- $310 · $3,720/yr
- Assessments
- None detected in remarks — confirm with the listing agent.
Listing history 15 events
-
2026-06-21days on market $110,000 Active 102 DOM
-
2026-06-18days on market $110,000 Active 99 DOM
-
2026-06-17days on market $110,000 Active 98 DOM
-
2026-06-16days on market $110,000 Active 97 DOM
-
2026-06-13days on market $110,000 Active 94 DOM
-
2026-06-13days on market $110,000 Active 93 DOM
-
2026-06-09statusdays on market $110,000 Active 90 DOM
-
2026-06-08days on market $110,000 Price Change 89 DOM
-
2026-06-07days on market $110,000 Price Change 88 DOM
-
2026-06-04days on market $110,000 Price Change 85 DOM
-
2026-06-03days on market $110,000 Price Change 84 DOM
-
2026-06-02days on market $110,000 Price Change 83 DOM
-
2026-06-01days on market $110,000 Price Change 82 DOM
-
2026-05-31days on market $110,000 Price Change 81 DOM
-
2026-03-11$120,000 New 1068-char remark
Show marketing remark (1068 chars)
Dont qualify for traditional loans? This home qualifies for rent to own! If you've been thinking about buying but weren't sure where to start-this is your opportunity. This well-maintained condo at 10527 Perrin Beitel #C211 offers a smart, affordable path into homeownership or a strong addition to an investment portfolio. With a functional layout and comfortable living space, it's designed for low-maintenance living and everyday convenience. For first-time buyers, this is your chance to own for less than you may be paying in rent, while building equity instead of paying a landlord. For investors, the value is just as clear-high rental demand, low entry price, and strong long-term potential in an established area. Low-maintenance lifestyle Affordable entry point into ownership Ideal for rental or personal use Convenient access to major roads, shopping, and everyday essentials Whether you're looking for your first home or your next investment, this property offers flexibility and opportunity in one of the most accessible price points in the city.
ⓘ Source: listings_history table (triggers on properties + properties_extension) + one-shot
backfill from property_details.listing_events for pre-trigger history.
Nearby sold comps map
Loading sold comps map…
Walkable amenities ~0.75 mi
Loading nearby amenities…
Taxation est. · year 1
- Rental income
- $13,513
- − Mortgage interest
- −$6,162
- − Property taxes
- −$1,650
- − Insurance
- −$550
- − Repairs & maintenance
- −$1,081
- − Management
- −$1,081
- − HOA
- −$3,720
- − Depreciation
- −$3,200
- Taxable loss
- −$3,931
- Est. tax savings @ 24.0%
- +$943
- After-tax cash flow
- $-1,224/yr
For passive investors: Depreciation is non-cash, so a rental often shows a tax loss while cash-flowing — sheltering income. Rental losses are passive: they offset passive income freely, and up to $25,000/yr can offset ordinary (W-2) income if you actively participate and your MAGI is under $100k (phasing out to $0 by $150k); unused losses carry forward. On sale, claimed depreciation is recaptured at up to 25%, and gains may owe capital-gains tax (a 1031 exchange can defer both). Figures are a year-1 estimate at your 24.0% rate — not tax advice; consult a CPA.
Condition & rehab AI · 12 photos
This well-maintained condo is in good condition with minor repairs needed. It offers a smart, affordable path into homeownership or a strong addition to an investment portfolio.
Repairs flagged
- Minor Kitchen cabinets — Slight wear on the cabinets.
- Minor Bathroom vanity — Slight wear on the vanity.
Value-add opportunities
- Resale Paint interior walls — Fresh paint can make a significant difference in the home's appearance.
- Resale Replace kitchen cabinets — New cabinets can improve the kitchen's functionality and aesthetics.
- Resale Replace bathroom vanity — A new vanity can enhance the bathroom's functionality and appearance.
- Rental Landscaping and patio furniture — A well-maintained patio and landscaping can attract more renters and increase rental value.
Renovation cost estimate screening
| Repair item | Severity | Est. cost |
|---|---|---|
| Kitchen cabinets · Slight wear on the cabinets. | Minor | $500–3,000 |
| Bathroom vanity · Slight wear on the vanity. | Minor | $500–3,000 |
| Total estimated repair cost · 2 items | $1,000–6,000 |
Value-add ROI direction
- Resale Paint interior walls — Fresh paint can make a significant difference in the home's appearance. ↑
- Resale Replace kitchen cabinets — New cabinets can improve the kitchen's functionality and aesthetics. ↑
- Resale Replace bathroom vanity — A new vanity can enhance the bathroom's functionality and appearance. ↑
- Rental Landscaping and patio furniture — A well-maintained patio and landscaping can attract more renters and increase rental value. ↑
ⓘ Cost ranges are severity-bucket heuristics (US national rule-of-thumb). Get contractor quotes + a written scope before underwriting a rehab budget.
Schools (NCES district)
- District
- North East ISD
- NCES district ID
- 4832940
- Math proficiency
- 38% ▼ -14.00%
- Reading proficiency
- 49% ▼ -4.00%
- Median HH income
- $57,715
- Composite
- 38.1/100
- National rank
- #4276
- State rank
- #276 of 826 in TX
Livability — San Antonio
- Score
- 80/100
- State rank
- #31
- US rank
- #1616
Category grades
Schools grade is shown separately in the Schools card above.
Census & demographics
- Census place
- San Antonio, TX
- County
- Bexar County · 1,990,555 people
- City population
- 1,806,925
- Metro
- San Antonio-New Braunfels, TX
- Population (ZIP)
- 34,055
- Household income
- $60,988
- Rent vs Own
- Severe rent burden
- 2444.0
Population outlook (Bexar County) Hauer SSP2
- Today (2025)
- 2,336,851 people
- By 2030
- 2,560,728 · +9.6%
- By 2040
- 3,020,569 · +29.3%
- By 2050
- 3,493,522 · +49.5%
- By 2075
- 4,668,459 · +99.8%
- By 2100
- 5,533,242 · +136.8%
Race, ethnicity, and origin ACS 2023
- Neighborhood character
- Diverse neighborhood (Simpson 0.62)
- Race & ethnicity
- Hispanic / Latino 52% White 32% Two or more races 25% Black 10% Native American 2% Asian 2%
- Hispanic origin (detail)
- Mexican 41% Puerto Rican 2%
- Common ancestry
- Slovak 2% Lithuanian 2% Italian 1%
- Foreign-born
- 12% · Canada, Vietnam, Philippines
- Languages at home
- 71% English-only · Spanish 26% German/W. Germanic 1% Russian/Polish/Slavic 1%
Political lean MEDSL · Bexar
- 2024 margin
- Lean D (+9.8) · D 54.3% · R 44.6% · Other 1.1%
- 2008→2024 swing
- +4.2pp toward D · 2008: 5.6pp · 2024: 9.8pp
- All cycles
- 2024: D+9.8 2020: D+18.2 2016: D+13.5 2012: D+4.6 2008: D+5.6
Not yet ingested
- Civics
- —
Market trends
- HPI YoY
- ▼ -113.03%
- Current HPI
- 261.2279
- Rent YoY
- ▼ -0.42%
- Metro
- San Antonio-New Braunfels, TX
- State GDP YoY
- ▲ 3.95%
- F500 in state
- 110
Industry mix (Fortune 500 HQ in TX)
| Industry | F500 HQs | Revenue |
|---|---|---|
| Energy | 16 | $1,198B |
|
||
| Technology | 5 | $198B |
|
||
| Engineering / Construction | 4 | $72B |
|
||
| Energy Services | 3 | $60B |
|
||
| Utilities | 3 | $41B |
|
||
| Healthcare | 2 | $330B |
|
||
Price history
1 event — show timeline
- 2026-03-11 Listed $120,000 LERA
Cash-flow waterfall
monthlySold comps — $/sqft
last 12 mo · ≤1 miLoading sold comps…