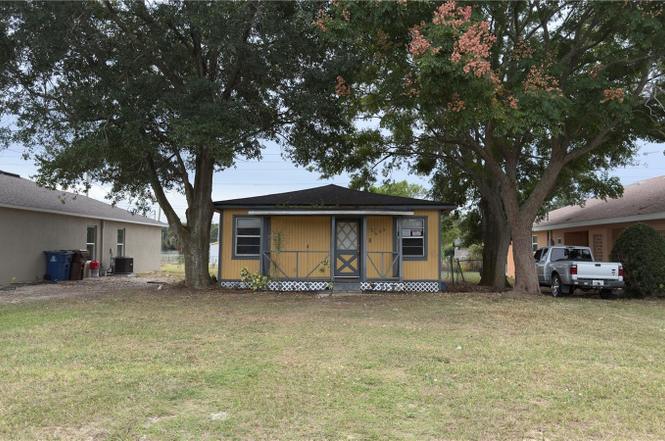
603 DR J A Wiltshire Ave W · Lake Wales, FL
Flood risk 1/10 · Minimal
- FEMA flood zone
- X (unshaded)
- Chance of flooding over 30 yrs
- 0.0%
- Est. flood insurance / yr
- $507 – $1,088
Fire risk 4/10 · Minor
- Est. fire insurance / yr
- $947 – $1,759
Heat risk 8/10 · Major
- Hot days now (above 108°F)
- 7 days/yr
- Hot days in 30 yrs
- 24 days/yr
Wind risk 9/10 · Severe
- Chance of severe wind over 30 yrs
- 99.0%
Air-quality risk 2/10 · Minimal
- Unhealthy air days now
- 0 days/yr
- Unhealthy air days in 30 yrs
- 2 days/yr
Risk factors via First Street. Map © Google.
Why this score? — see what drove the D grade
The composite is a weighted blend of 9 inputs, each scored 0–100. Each bar is that input's sub-score; the figure is the points it added to the 100-point composite (weight × sub-score).
- Cash flow +13.4/30.0
- ARV discount +7.5/15.0
- DSCR +4.0/10.0
- 1% rule +3.5/10.0
- Schools +3.5/10.0
- Livability +3.4/5.0
- Rent growth +2.5/5.0
- Condition / age +2.5/5.0
- Appreciation +0.0/10.0
$101,900
🖨 Deal sheet (PDF) 📄 Offer letter ✓ Due diligence
Listing remarks
Quaint 2 bedroom/1 bath home is ready for a new owner. Roof is 2022, freshly painted and has newer carpet and luxury vinyl plank flooring. Convenient to highways 60 and 27. Enjoy an afternoon at one of several state parks or Bok Tower Gardens.
Key facts
- State parks
- Bok tower gardens
- Newer carpet
Tags
Property features AI
Finance
- Other: Property type listed as residential, single family; Unfurnished
- HOA & community: No HOA indicated
Exterior
- Utilities: Public water; Public sewer; Electricity connected; Water connected; Sewer connected
- Home design: Single-family residence; One story; Faces north; Residential zoning (R-1C)
- Construction: Frame construction with wood siding; Shingle roof; Crawlspace foundation; Built on a lot of about 0.17 acres
- Exterior features: Private mailbox; Asphalt road access; Lot dimensions approximately 50 x 150
Interior
- Kitchen: Range; Range hood; Refrigerator; Electric water heater
- Bedrooms: 2 bedrooms
- Flooring: Carpet
- Bathrooms: 1 full bathroom
- Heating & cooling: Ductless heating; Wall/window air conditioning units
- Interior features: Window treatments; 5 total rooms
- Laundry & utility: Laundry room with washer and electric dryer hookups
Neighborhood map
What this means for you Summary
Snapshot
- This is a 2-bed/1.0-bath single-family listed at $102k.
Deal economics
- At list price, monthly cash flow is $1 ($17/yr) — positive.
- The deal already cash-flows at list — no discount required.
- To meet the 1% rule (rent ≥ 1% of price), the offer needs to be $87k (14.5% below list).
- Recommended offer: $87k (14.5% below list) — sets the bar for 1% rule.
Location & tenants
- Location reads 68/100 on livability (#535 in FL) — a middle-class / working-renter tenant base. Strengths: cost of living A+, housing A+; Watch: employment D+, amenities F, commute F.
- Polk (suburban): math 39% / reading 43% proficiency, ranked #62 of 73 in FL (top 85%) — families likely to look elsewhere, expect single-tenant / working-renter base with shorter leases.
- Zoned schools: Spook Hill Elementary School (math 28% / reading 33%, grade F, #1,862 of 2,144 statewide, top 88%, 584 students, 67% FRL); Mclaughlin Academy of Excellence (math 34% / reading 32%, grade F, #437 of 571 statewide, top 77%, 542 students, 68% FRL).
- Market conditions: 185 active listings in the ZIP; 16 comparable units currently listed for rent nearby; rentals at typical pace (median 25d on market — plan ~3-4 weeks tenant-placement turnaround); 10,384 units permitted in Polk County in 2024 (1,716 in 5+ unit buildings).
Forward outlook
- Local home prices are declining (-3.0%/yr); year-one equity from $705 of loan paydown is wiped out by about $3k of value loss. Plan a longer hold.
- Polk County population projected at +33% by 2050 — long-run rental-demand tailwind backs the buy-and-hold thesis.
Negotiation context
- It's been on market 179 days — a 12% lower offer ($90k) is reasonable based on typical stale-listing flexibility.
- 3 sale attempts since 2y ago; this cycle's ask has dropped $23k (18%) from the opening price — seller is motivated, your offer sets the floor, not the list.
Risks & watch-outs
- Watch-outs: built in 1958 — expect roof / HVAC / electrical / plumbing capex.
- Climate carrying-cost: severe wind risk, 99% chance of damaging wind over 30y; extreme-heat days projected 7→24/yr by 2055 (HVAC capex compounding) — expect insurance premiums to compound above CPI over the hold.
Questions for the listing agent
- It's been on market 179 days. Have you received any prior offers? Is the seller open to a 15% concession, seller financing, or rate buy-down credit?
- Built in 1958 — when were the roof, HVAC, electrical panel, plumbing, and water heater last replaced?
- Why hasn't it sold? Are there any deal-killer items the seller is aware of (foundation, flood, title, zoning, code violations)?
- Is there a deadline driving the sale (1031 exchange, divorce, estate, relocation)? That informs how much negotiation room exists.
- Schools are D-rated, which usually means shorter tenancies and higher turnover. Who's the typical renter profile here, and what's been the actual vacancy rate?
- The area grade is low — what's the realistic commute time and amenity access for the typical tenant pool here? Any planned neighborhood developments (good or bad) we should know about?
- What's the average days-on-market for RENTAL listings here right now (not sales)? A rising rental-DOM trend means longer vacancies and softer asking-rent achievability than the comps imply.
- What's the recent tenant-quality profile in this submarket — average credit score on applications, eviction rate, late-payment / NSF rate, and stable-employment percentage? A property-management company in the area should have these aggregated.
- How much new for-sale + rental construction is in the pipeline within 1–3 miles? Heavy new supply typically softens prices + rents 12–24 months out; constrained supply supports both.
Investment metrics
- 1% rule
- 0.85% ✗
- Cap rate
- 6.31%
- Cash-on-cash
- 0.06%
- DSCR
- 1.00
- GRM
- 9.7
CMA / ARV
No comps found within radius.
Projected returns pro-forma
-3.0% appreciation · 3.0% rent growth · sell at horizon
- IRR
- -16.2%
- Equity multiple
- 0.42×
- Total profit
- $-16,420
- Equity at exit
- $15,194
- IRR
- -7.9%
- Equity multiple
- 0.50×
- Total profit
- $-14,174
- Equity at exit
- $8,810
Cash invested: $28,532 (down + closing). Projections, not guarantees.
Landlord ↔ Tenant lean methodology
- Overall (STATE)
- 87 Strongly Landlord-Friendly
- State Florida
- 87 Strongly Landlord-Friendly · R+3
- County
- — inherits STATE
- City
- — inherits STATE
ZIP-level market 33853
- Home prices YoY
- -9.2%
- Active inventory
- 185
- Price-to-rent
- 9.7×
Monthly cashflow live
- Estimated rent
- $871 high interval (Pro) →
- Mortgage (P&I)
- −$534
- Tax from tax record
- −$110 /mo · $1,318/yr
- Insurance
- −$42
- HOA
- −$0
- Vacancy / Maint / Mgmt
- −$183
- Net cashflow
- $1
Break-even live
Sensitivity live
| Price | -10% $59 | -5% $30 | +0% $1 | +5% $-27 | +10% $-56 |
|---|---|---|---|---|---|
| Rent | -10% $-67 | -5% $-33 | +0% $1 | +5% $36 | +10% $70 |
| Rate | -1.0pp $53 | -0.5pp $27 | base $1 | +0.5pp $-25 | +1.0pp $-52 |
UW: 25.0% down · 7.5% · 30yr · 1.5% tax · 5.0% vac · 8.0% maint · 8.0% mgmt
Financing live
Cash to close
- Down payment
- $25,475
- Closing costs
- $3,057
- Reserves months
- —
- Total cash needed
- —
Loan-product check · same deal, 3 products live
Conventional
25% down · 7.5% · 30yr
- Down + closing
- —
- Monthly P&I
- —
- Monthly cashflow
- —
- DSCR
- —
- Eligible?
- —
Personal DTI + credit; lowest rate.
DSCR
20% down · 8.5% · 30yr
- Down + closing
- —
- Monthly P&I
- —
- Monthly cashflow
- —
- DSCR
- —
- Eligible?
- —
No personal income docs; deal must DSCR.
Hard money
10% down · 12.0% · 12mo
- Down + closing
- —
- Monthly P&I
- —
- Monthly cashflow
- —
- DSCR
- —
- Eligible?
- —
Short-term bridge; refi at stabilization.
Rent comps 16 comps
| Address | Beds | Baths | Sqft | Rent | $/sqft | DOM | Units | Dist |
|---|---|---|---|---|---|---|---|---|
| 622 Booker Ave Unit B Lake Wales, FL | 2.0 | 1.0 | 640 | $895 | $1.40 | 25d | 1 | 0.13mi |
| 522 Washington Ave Unit 1 Lake Wales, FL | 2.0 | 1.0 | 612 | $1,200 | $1.96 | 25d | 1 | 0.25mi |
| 131 B St Unit 3 Lake Wales, FL | 1.0 | 1.0 | 425 | $600 | $1.41 | 25d | 1 | 0.28mi |
| 318 Pearl St Lake Wales, FL | 1.0 | 1.0 | 600 | $875 | $1.46 | 25d | 1 | 0.30mi |
| 115 Washington Ave Lake Wales, FL | 2.0 | 1.0 | 600 | $600 | $1.00 | 25d | 1 | 0.30mi |
| 315 D St Unit 2 Lake Wales, FL | 2.0 | 1.0 | 624 | $900 | $1.44 | 20d | 1 | 0.31mi |
| 238 C St Lake Wales, FL | 2.0 | 1.0 | 600 | $700 | $1.17 | 25d | 1 | 0.32mi |
| 242 C St Lake Wales, FL | 1.0 | 1.0 | 600 | $600 | $1.00 | 25d | 1 | 0.32mi |
| 324 Pearl St Unit 2 Lake Wales, FL | 1.0 | 1.0 | 500 | $795 | $1.59 | 25d | 1 | 0.32mi |
| 104 W Stuart Ave Lake Wales, FL | 2.0 | 1.0 | 720 | $1,100 | $1.53 | 5d | 1 | 0.59mi |
| 244 E Park Ave Unit 203 Lake Wales, FL | 1.0 | 1.0 | 614 | $1,400 | $2.28 | 25d | 1 | 0.75mi |
| 157 E Northside Dr #1 Lake Wales, FL | 2.0 | 1.0 | 624 | $1,000 | $1.60 | 25d | 1 | 0.88mi |
| 335 E Central Ave Lake Wales, FL | 2.0 | 1.0 | 450 | $995 | $2.21 | 15d | 1 | 0.95mi |
| 414 1/2 S Miami St Unit A Lake Wales, FL | 1.0 | 1.0 | 544 | $700 | $1.29 | 25d | 1 | 1.01mi |
| 414 1/2 S Miami St Unit B Lake Wales, FL | 1.0 | 1.0 | 544 | $650 | $1.19 | 25d | 1 | 1.01mi |
| 711 Springer Dr Lake Wales, FL | 1.0–2.0 | 1.0–2.0 | 848 | $1,400 | $1.65 | 5d | 2 | 1.21mi |
Listing history 38 events
-
2026-06-22pricedays on market $101,900 Active 179 DOM
-
2026-06-18days on market $102,900 Active 176 DOM
-
2026-06-17days on market $102,900 Active 175 DOM
-
2026-06-16days on market $102,900 Active 174 DOM
-
2026-06-15days on market $102,900 Active 173 DOM
-
2026-06-13pricedays on market $102,900 Active 171 DOM
-
2026-06-10days on market $103,900 Active 168 DOM
-
2026-06-09days on market $103,900 Active 167 DOM
-
2026-06-08days on market $103,900 Active 166 DOM
-
2026-06-07days on market $103,900 Active 165 DOM
-
2026-06-05pricedays on market $103,900 Active 162 DOM
-
2026-06-03days on market $104,900 Active 160 DOM
-
2026-06-01days on market $104,900 Active 159 DOM
-
2026-05-31days on market $104,900 Active 158 DOM
-
2026-05-21price $105,900
-
2026-05-14price $106,900
-
2026-05-07price $107,900
-
2026-05-01price $108,900
-
2026-04-27price $109,900
-
2026-04-16price $111,900
-
2026-04-10price $112,900
-
2026-04-01price $113,900
-
2026-03-26price $114,900
-
2026-03-19price $115,900
-
2026-03-12price $116,900
-
2026-03-04status Active
-
2026-03-03status Pending
-
2026-02-27price $117,900
-
2026-02-20price $118,900
-
2026-02-13price $119,900
-
2026-02-05price $121,900
-
2026-02-02price $122,900
-
2026-01-22price $123,900
-
2025-12-23$125,000 Active
-
2024-10-02historical $1,150
-
2024-08-29$1,150
-
2017-03-01soldstatus $455,600
-
1983-05-01soldstatus $5,800
ⓘ Source: listings_history table (triggers on properties + properties_extension) + one-shot
backfill from property_details.listing_events for pre-trigger history.
Tax reassessment forecast FL · Resets to sale price
- Current annual tax
- $1,318 · $110/mo
- Projected year-2 tax
- $1,318 · $110/mo
- Expected delta
- $0/yr ($0/mo · 0.0%)
ⓘ Screening estimate from a state-policy table — verify with the county assessor before closing.
Climate risk First Street
- Flood 1/10 Low FEMA zone X (unshaded) · 0% chance over 30 yrs
- Wildfire 4/10 Moderate
- Heat 8/10 Severe 7 d/yr ≥108°F today · 24 d/yr by 30 yrs out
- Wind 9/10 Extreme 99% chance of damaging wind over 30 yrs
- Air quality 2/10 Low 0 unhealthy d/yr today · 2 by 30 yrs out
Nearby sold comps map
Loading sold comps map…
Walkable amenities ~0.75 mi
Loading nearby amenities…
Taxation est. · year 1
- Rental income
- $10,452
- − Mortgage interest
- −$5,708
- − Property taxes
- −$1,318
- − Insurance
- −$510
- − Repairs & maintenance
- −$836
- − Management
- −$836
- − Depreciation
- −$2,964
- Taxable loss
- −$1,720
- Est. tax savings @ 24.0%
- +$413
- After-tax cash flow
- $430/yr
For passive investors: Depreciation is non-cash, so a rental often shows a tax loss while cash-flowing — sheltering income. Rental losses are passive: they offset passive income freely, and up to $25,000/yr can offset ordinary (W-2) income if you actively participate and your MAGI is under $100k (phasing out to $0 by $150k); unused losses carry forward. On sale, claimed depreciation is recaptured at up to 25%, and gains may owe capital-gains tax (a 1031 exchange can defer both). Figures are a year-1 estimate at your 24.0% rate — not tax advice; consult a CPA.
Schools (NCES district)
- District
- Polk
- NCES district ID
- 1201590
- Math proficiency
- 39% ▼ -11.00%
- Reading proficiency
- 43% ▼ -4.00%
- Median HH income
- $43,979
- Composite
- 34.74/100
- National rank
- #5132
- State rank
- #62 of 73 in FL
Livability — Lake Wales
- Score
- 68/100
- State rank
- #535
- US rank
- #10036
Category grades
Schools grade is shown separately in the Schools card above.
Census & demographics
- Census place
- Lake Wales, FL
- City population
- 30,351
- Population (ZIP)
- 12,385
Population outlook (Polk County) Hauer SSP2
- Today (2025)
- 752,975 people
- By 2030
- 804,621 · +6.9%
- By 2040
- 906,117 · +20.3%
- By 2050
- 1,000,476 · +32.9%
- By 2075
- 1,197,520 · +59.0%
- By 2100
- 1,271,518 · +68.9%
Race, ethnicity, and origin ACS 2023
- Neighborhood character
- Diverse neighborhood (Simpson 0.65)
- Race & ethnicity
- White 42% Hispanic / Latino 36% Black 19% Two or more races 16%
- Hispanic origin (detail)
- Mexican 10% Puerto Rican 18% Cuban 2% Dominican 1%
- Common ancestry
- Romanian 2% Slovak 1% Lithuanian 1%
- Foreign-born
- 10% · Canada
- Languages at home
- 72% English-only · Spanish 27%
Political lean MEDSL · Polk
- 2024 margin
- Strong R (+20.7) · D 39.2% · R 59.9%
- 2008→2024 swing
- -14.6pp toward R · 2008: -6.1pp · 2024: -20.7pp
- All cycles
- 2024: R+20.7 2020: R+14.4 2016: R+14.1 2012: R+6.8 2008: R+6.1
Not yet ingested
- Civics
- —
Market trends
- HPI YoY
- ▼ -33.98%
- Current HPI
- 333.8292
- Rent YoY
- —
- Metro
- —
- State GDP YoY
- ▲ 3.28%
- F500 in state
- 36
Industry mix (Fortune 500 HQ in FL)
| Industry | F500 HQs | Revenue |
|---|---|---|
| Industrial Technology | 2 | $29B |
|
||
| Insurance | 2 | $17B |
|
||
| Retail | 1 | $60B |
|
||
| Technology Distribution | 1 | $58B |
|
||
| Homebuilding | 1 | $35B |
|
||
| Technology Manufacturing | 1 | $35B |
|
||
Price history
+1725.9% since first listed24 events — show timeline
- 2026-05-21 Price Changed $105,900 Stellar MLS as Distributed by MLS Grid
- 2026-05-14 Price Changed $106,900 Stellar MLS as Distributed by MLS Grid
- 2026-05-07 Price Changed $107,900 Stellar MLS as Distributed by MLS Grid
- 2026-05-01 Price Changed $108,900 Stellar MLS as Distributed by MLS Grid
- 2026-04-27 Price Changed $109,900 Stellar MLS as Distributed by MLS Grid
- 2026-04-16 Price Changed $111,900 Stellar MLS as Distributed by MLS Grid
- 2026-04-10 Price Changed $112,900 Stellar MLS as Distributed by MLS Grid
- 2026-04-01 Price Changed $113,900 Stellar MLS as Distributed by MLS Grid
- 2026-03-26 Price Changed $114,900 Stellar MLS as Distributed by MLS Grid
- 2026-03-19 Price Changed $115,900 Stellar MLS as Distributed by MLS Grid
- 2026-03-12 Price Changed $116,900 Stellar MLS as Distributed by MLS Grid
- 2026-03-04 Relisted — Stellar MLS as Distributed by MLS Grid
- 2026-03-03 Pending — Stellar MLS as Distributed by MLS Grid
- 2026-02-27 Price Changed $117,900 Stellar MLS as Distributed by MLS Grid
- 2026-02-20 Price Changed $118,900 Stellar MLS as Distributed by MLS Grid
- 2026-02-13 Price Changed $119,900 Stellar MLS as Distributed by MLS Grid
- 2026-02-05 Price Changed $121,900 Stellar MLS as Distributed by MLS Grid
- 2026-02-02 Price Changed $122,900 Stellar MLS as Distributed by MLS Grid
- 2026-01-22 Price Changed $123,900 Stellar MLS as Distributed by MLS Grid
- 2025-12-23 Listed $125,000 Stellar MLS as Distributed by MLS Grid
- 2024-10-02 Rental Removed $1,150 STELLARMLS
- 2024-08-29 Listed for Rent $1,150 STELLARMLS
- 2017-03-01 Sold (Public Records) $455,600 Public Records
- 1983-05-01 Sold (Public Records) $5,800 Public Records
Property tax history
+12.8%/yrLatest (2025): $1,318 · +12.3% YoY. Source: county tax records.
Cash-flow waterfall
monthlySold comps — $/sqft
last 12 mo · ≤1 miLoading sold comps…