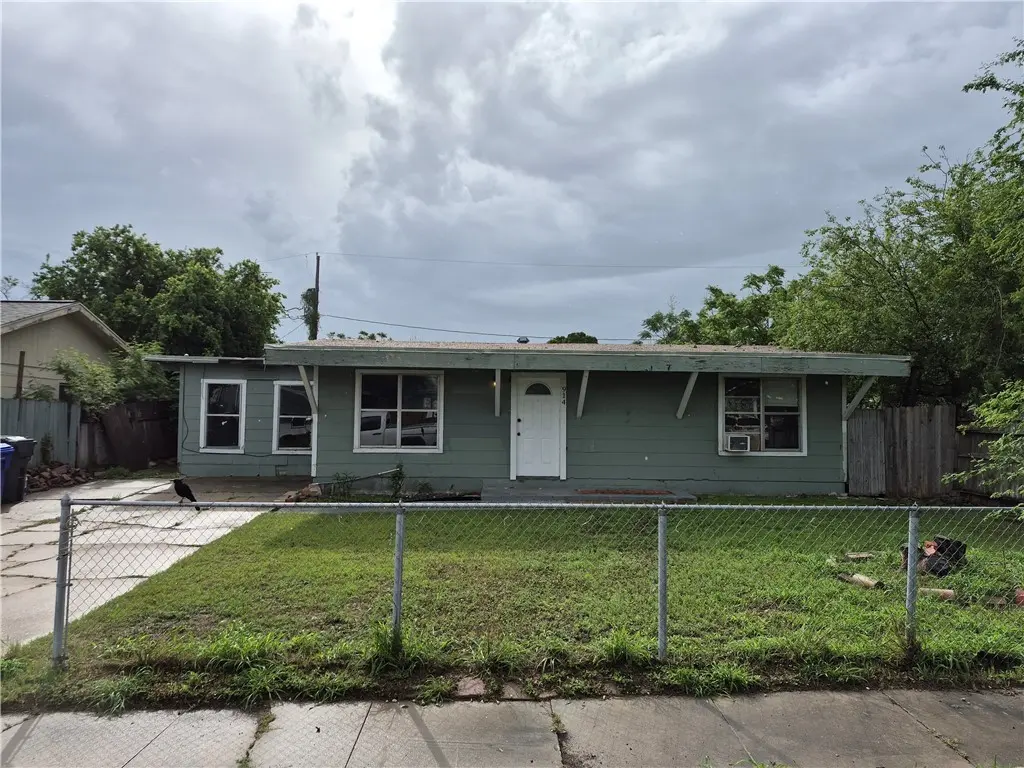
914 Susan Dr · Corpus Christi, TX
Flood risk 5/10 · Moderate
- FEMA flood zone
- X (unshaded)
- Chance of flooding over 30 yrs
- 0.37%
- Est. flood insurance / yr
- $507 – $1,088
Fire risk 2/10 · Minimal
- Est. fire insurance / yr
- $1,222 – $2,270
Heat risk 10/10 · Severe
- Hot days now (above 107°F)
- 7 days/yr
- Hot days in 30 yrs
- 27 days/yr
Wind risk 9/10 · Severe
- Chance of severe wind over 30 yrs
- 99.0%
Air-quality risk 1/10 · Minimal
- Unhealthy air days now
- 0 days/yr
- Unhealthy air days in 30 yrs
- 0 days/yr
Risk factors via First Street. Map © Google.
Why this score? — see what drove the B grade
The composite is a weighted blend of 9 inputs, each scored 0–100. Each bar is that input's sub-score; the figure is the points it added to the 100-point composite (weight × sub-score).
- Cash flow +28.4/30.0
- ARV discount +15.0/15.0
- DSCR +10.0/10.0
- 1% rule +8.1/10.0
- Livability +3.9/5.0
- Schools +2.8/10.0
- Condition / age +2.5/5.0
- Rent growth +2.1/5.0
- Appreciation +0.0/10.0
$149,000
🖨 Deal sheet 📄 Offer letter ✓ Due diligence
Listing remarks MLS
Price REDUCED- 4 bedroom 1 bathe with office or media room. Lots of space in this home. Does need some TLC. Large kitchen area. You'll have your own dinning room. You can have an office or workout room. Back yard is spacious. INVESTORS- this property can be a great investment rental. Great area of town. Seller is will to help FHA qualified buyers. Come take a look if you're looking for lots of rooms and space at a great price. SELLER IS LOOKING AT ALL OFFERS. investors welcome. Great cash flow potential.
Key facts
- 6,991 sq ft lot
- Built 1955
- Listed 65 days
Neighborhood map
What this means for you Summary
Snapshot
- This is a 4-bed/1.0-bath single-family listed at $149k.
Deal economics
- At list price, monthly cash flow is $484 ($6k/yr) — positive.
- The deal already cash-flows at list — no discount required.
- Meets the 1% rule at list price ($2k rent vs $149k).
- Recommended offer: $140k (6.0% below list) — sets the bar for market timing.
- Cap rate 10.2% vs local median 3.6% in Corpus Christi — top-decile yield for the area; either an underpriced asset or a hidden risk that comps aren't pricing in. Stress-test before assuming the spread holds.
Location & tenants
- Location reads 78/100 on livability (#66 in TX, #2,404 nationally) — a middle-class / working-renter tenant base. Strengths: commute A+, cost of living A+, housing A+; Watch: crime F.
- Corpus Christi ISD (urban): math 31% / reading 35% proficiency, ranked #562 of 826 in TX (top 68%) — families likely to look elsewhere, expect single-tenant / working-renter base with shorter leases; 63% free/reduced lunch — lower-income household profile, screen leases tightly.
- Market conditions: Rents soft (-1.5%/yr); 207 active listings in the ZIP; 14 comparable units currently listed for rent nearby; rentals at typical pace (median 21d on market — plan ~3-4 weeks tenant-placement turnaround); 1,397 units permitted in Nueces County in 2024 (47 in 5+ unit buildings).
- This rent runs 38% of the median local income ($61k/yr) — at the standard rent-burdened threshold; future hikes will face affordability resistance.
Forward outlook
- Local home prices are declining (-3.0%/yr); year-one equity from $1k of loan paydown is wiped out by about $4k of value loss. Plan a longer hold.
- Nueces County population projected at +36% by 2050 — long-run rental-demand tailwind backs the buy-and-hold thesis.
Negotiation context
- It's been on market 65 days — a 6% lower offer ($140k) is reasonable based on typical stale-listing flexibility.
- 4 sale attempts since 21y ago; this cycle's ask has dropped $10k (7%) from the opening price — seller is motivated, your offer sets the floor, not the list.
Risks & watch-outs
- Watch-outs: built in 1955 — expect roof / HVAC / electrical / plumbing capex.
- Climate carrying-cost: moderate flood risk; severe wind risk, 99% chance of damaging wind over 30y; extreme-heat days projected 7→27/yr by 2055 (HVAC capex compounding) — expect insurance premiums to compound above CPI over the hold.
Questions for the listing agent
- It's been on market 65 days. Have you received any prior offers? Is the seller open to a 6% concession, seller financing, or rate buy-down credit?
- Built in 1955 — when were the roof, HVAC, electrical panel, plumbing, and water heater last replaced?
- Why hasn't it sold? Are there any deal-killer items the seller is aware of (foundation, flood, title, zoning, code violations)?
- Is there a deadline driving the sale (1031 exchange, divorce, estate, relocation)? That informs how much negotiation room exists.
- Crime grade is F in this area — have there been break-ins, vandalism, or insurance claims at this property in the last 3 years? What carrier currently insures it and at what premium?
- What's the average days-on-market for RENTAL listings here right now (not sales)? A rising rental-DOM trend means longer vacancies and softer asking-rent achievability than the comps imply.
- What's the recent tenant-quality profile in this submarket — average credit score on applications, eviction rate, late-payment / NSF rate, and stable-employment percentage? A property-management company in the area should have these aggregated.
- How much new for-sale + rental construction is in the pipeline within 1–3 miles? Heavy new supply typically softens prices + rents 12–24 months out; constrained supply supports both.
Investment metrics
- 1% rule
- 1.31% ✓
- Cap rate
- 10.19%
- Cash-on-cash
- 13.91%
- DSCR
- 1.62
- GRM
- 6.4
CMA / ARV
- ARV (median comp)
- $199,142
- List price
- $149,000
- Delta
- -25.18%
- Verdict
- UNDERPRICED
- Comps
- 20 within 1.0 mi
Show comp detail 12 sales within ~0.75 mi
| Address | Dist | Beds/Ba | Sqft | Sold | Price | $/sf | Match |
|---|---|---|---|---|---|---|---|
| 533 Parade Dr | 0.55mi | 4/2.0 | 2,017 (+2%) | 1mo | $250,000 | $124 | 66 |
| 933 Egyptian Dr | 0.34mi | 4/2.0 | 2,122 (+7%) | 4mo | $329,500 | $155 | 64 |
| 1118 Stratton Dr | 0.40mi | 3/2.0 (-1) | 1,837 (-7%) | 4mo | $279,500 | $152 | 57 |
| 479 Homecrest St | 0.65mi | 3/2.0 (-1) | 1,918 (-3%) | 0mo | $139,995 | $73 | 55 |
| 484 Palmetto St | 0.65mi | 3/2.0 (-1) | 2,013 (+2%) | 6mo | $269,900 | $134 | 52 |
| 466 Palmetto St | 0.70mi | 3/2.0 (-1) | 1,956 (-1%) | 8mo | $329,900 | $169 | 50 |
| 445 Haroldson Dr | 0.70mi | 3/2.0 (-1) | 1,893 (-4%) | 5mo | $205,900 | $109 | 47 |
| 534 Parade Dr | 0.57mi | 3/2.0 (-1) | 1,724 (-13%) | 3mo | $219,900 | $128 | 40 |
| 513 Poenisch Dr | 0.60mi | 4/2.0 | 2,273 (+15%) | 5mo | $299,900 | $132 | 39 |
| 450 Poenisch Dr | 0.72mi | 3/2.0 (-1) | 2,236 (+13%) | 4mo | $325,000 | $145 | 33 |
| 450 University Dr | 0.72mi | 3/2.0 (-1) | 2,266 (+15%) | 2mo | $339,000 | $150 | 32 |
| 6721 Sahara Dr | 0.69mi | 4/2.5 | 2,252 (+14%) | 11mo | $325,000 | $144 | 30 |
Match score weights: distance 35% · size 25% · config 20% · recency 20%. Top-matched comps best support the ARV.
Projected returns pro-forma
-3.0% appreciation · 0.0% rent growth · sell at horizon
- IRR
- 0.7%
- Equity multiple
- 1.02×
- Total profit
- $1,000
- Equity at exit
- $22,216
- IRR
- 6.9%
- Equity multiple
- 1.45×
- Total profit
- $18,661
- Equity at exit
- $12,883
Cash invested: $41,720 (down + closing). Projections, not guarantees.
Landlord ↔ Tenant lean methodology
- Overall (STATE)
- 87 Strongly Landlord-Friendly
- State Texas
- 87 Strongly Landlord-Friendly · R+5
- County
- — inherits STATE
- City
- — inherits STATE
ZIP-level market 78412
- Rents YoY
- -1.5%
- Active inventory
- 207
- Price-to-rent
- 6.4×
Monthly cashflow live
- Estimated rent
- $1,948 high interval (Pro) →
- Mortgage (P&I)
- −$781
- Tax from tax record
- −$212 /mo · $2,542/yr
- Insurance
- −$62
- HOA
- −$0
- Vacancy / Maint / Mgmt
- −$409
- Net cashflow
- $484
Break-even live
UW: 25.0% down · 7.5% · 30yr · 1.5% tax · 5.0% vac · 8.0% maint · 8.0% mgmt
Financing live
Cash to close
- Down payment
- $37,250
- Closing costs
- $4,470
- Reserves months
- —
- Total cash needed
- —
Loan-product check · same deal, 3 products live
Conventional
25% down · 7.5% · 30yr
- Down + closing
- —
- Monthly P&I
- —
- Monthly cashflow
- —
- DSCR
- —
- Eligible?
- —
Personal DTI + credit; lowest rate.
DSCR
20% down · 8.5% · 30yr
- Down + closing
- —
- Monthly P&I
- —
- Monthly cashflow
- —
- DSCR
- —
- Eligible?
- —
No personal income docs; deal must DSCR.
Hard money
10% down · 12.0% · 12mo
- Down + closing
- —
- Monthly P&I
- —
- Monthly cashflow
- —
- DSCR
- —
- Eligible?
- —
Short-term bridge; refi at stabilization.
Rent comps 14 comps
| Address | Beds | Baths | Sqft | Rent | $/sqft | DOM | Units | Dist |
|---|---|---|---|---|---|---|---|---|
| 857 Belmeade Dr Corpus Christi, TX | 3.0 | 2.0 | 1573 | $1,800 | $1.14 | 43d | 1 | 0.60mi |
| 449 Parade Dr Corpus Christi, TX | 4.0 | 2.0 | 2085 | $1,895 | $0.91 | 13d | 1 | 0.74mi |
| 441 Montclair Dr Corpus Christi, TX | 3.0 | 2.0 | 2271 | $2,200 | $0.97 | 13d | 1 | 0.75mi |
| 6433 Aspenwood Dr Corpus Christi, TX | 3.0 | 2.0 | 1465 | $1,750 | $1.19 | 43d | 1 | 1.00mi |
| 1137 Bradshaw Dr Corpus Christi, TX | 3.0 | 2.0 | 1424 | $1,900 | $1.33 | 13d | 1 | 1.02mi |
| 1066 Burkshire Dr Corpus Christi, TX | 3.0 | 2.0 | 2063 | $1,900 | $0.92 | 44d | 1 | 1.13mi |
| 6629 Rhine Dr Unit A Corpus Christi, TX | 3.0 | 2.0 | 1350 | $1,695 | $1.26 | 13d | 1 | 1.23mi |
| 6530 Ample Arbor Ct Corpus Christi, TX | 3.0 | 2.5 | 2256 | $2,400 | $1.06 | 43d | 1 | 1.23mi |
| 2001 Woodbend Dr Corpus Christi, TX | 2.0–3.0 | 2.0 | 1267 | $2,204 | $1.74 | 13d | 17 | 1.29mi |
| 2006 Melisa Ln Corpus Christi, TX | 3.0 | 1.0 | 1324 | $1,450 | $1.10 | 21d | 1 | 1.32mi |
| 2006 Melisa Ln Corpus Christi, TX | 3.0 | 1.0 | 1324 | $1,450 | $1.10 | 13d | 1 | 1.32mi |
| 16 Rock Creek Dr Corpus Christi, TX | 3.0 | 2.5 | 2450 | $1,950 | $0.80 | 21d | 1 | 1.33mi |
| 16 Rock Creek Dr #16 Corpus Christi, TX | 3.0 | 3.0 | 2450 | $1,955 | $0.80 | 21d | 1 | 1.33mi |
| 6845 Rhine Dr Corpus Christi, TX | 3.0 | 1.5 | 1518 | $1,695 | $1.12 | 43d | 1 | 1.38mi |
Listing history 27 events
-
2026-06-18days on market $149,000 Active 65 DOM
-
2026-06-17days on market $149,000 Active 64 DOM
-
2026-06-16days on market $149,000 Active 63 DOM
-
2026-06-15days on market $149,000 Active 62 DOM
-
2026-06-14days on market $149,000 Active 60 DOM
-
2026-06-10days on market $149,000 Active 57 DOM
-
2026-06-09days on market $149,000 Active 56 DOM
-
2026-06-08days on market $149,000 Active 55 DOM
-
2026-06-07days on market $149,000 Active 54 DOM
-
2026-06-05days on market $149,000 Active 51 DOM
-
2026-06-03days on market $149,000 Active 50 DOM
-
2026-06-02days on market $149,000 Active 49 DOM
-
2026-06-01days on market $149,000 Active 48 DOM
-
2026-05-31days on market $149,000 Active 47 DOM
-
2026-05-30days on market $149,000 Active 46 DOM
-
2026-05-02price $149,000 509-char remark
Show marketing remark (509 chars)
Price REDUCED- 4 bedroom 1 bathe with office or media room. Lots of space in this home. Does need some TLC. Large kitchen area. You'll have your own dinning room. You can have an office or workout room. Back yard is spacious. INVESTORS- this property can be a great investment rental. Great area of town. Seller is will to help FHA qualified buyers. Come take a look if you're looking for lots of rooms and space at a great price. SELLER IS LOOKING AT ALL OFFERS. investors welcome. Great cash flow potential.
-
2026-04-10$159,500 Active 509-char remark
Show marketing remark (509 chars)
Price REDUCED- 4 bedroom 1 bathe with office or media room. Lots of space in this home. Does need some TLC. Large kitchen area. You'll have your own dinning room. You can have an office or workout room. Back yard is spacious. INVESTORS- this property can be a great investment rental. Great area of town. Seller is will to help FHA qualified buyers. Come take a look if you're looking for lots of rooms and space at a great price. SELLER IS LOOKING AT ALL OFFERS. investors welcome. Great cash flow potential.
-
2017-08-31soldstatus
-
2014-04-25soldstatus
-
2014-04-22soldstatus
-
2008-07-31soldstatus
-
2008-07-16soldstatus 44-char remark
Show marketing remark (44 chars)
SOLD IN AS WHERE IS CONDITION. .. MAKE OFFER
-
2008-01-14$49,900 44-char remark
Show marketing remark (44 chars)
SOLD IN AS WHERE IS CONDITION. .. MAKE OFFER
-
2006-09-14soldstatus
-
2006-09-12soldstatus
-
2006-04-17$55,000
-
2005-01-17$49,900
ⓘ Source: listings_history table (triggers on properties + properties_extension) + one-shot
backfill from property_details.listing_events for pre-trigger history.
Tax reassessment forecast TX · Resets to sale price
- Current annual tax
- $2,542 · $212/mo
- Projected year-2 tax
- $2,727 · $227/mo
- Expected delta
- +$185/yr (+$15/mo · 7.3%)
ⓘ Screening estimate from a state-policy table — verify with the county assessor before closing.
Climate risk First Street
- Flood 5/10 Major FEMA zone X (unshaded) · 37% chance over 30 yrs
- Wildfire 2/10 Low
- Heat 10/10 Extreme 7 d/yr ≥107°F today · 27 d/yr by 30 yrs out
- Wind 9/10 Extreme 99% chance of damaging wind over 30 yrs
- Air quality 1/10 Low 0 unhealthy d/yr today · 0 by 30 yrs out
Nearby sold comps map
Loading sold comps map…
Walkable amenities ~0.75 mi
Loading nearby amenities…
Taxation est. · year 1
- Rental income
- $23,377
- − Mortgage interest
- −$8,346
- − Property taxes
- −$2,542
- − Insurance
- −$745
- − Repairs & maintenance
- −$1,870
- − Management
- −$1,870
- − Depreciation
- −$4,335
- Taxable income
- $3,669
- Est. tax owed @ 24.0%
- −$881
- After-tax cash flow
- $4,924/yr
For passive investors: Depreciation is non-cash, so a rental often shows a tax loss while cash-flowing — sheltering income. Rental losses are passive: they offset passive income freely, and up to $25,000/yr can offset ordinary (W-2) income if you actively participate and your MAGI is under $100k (phasing out to $0 by $150k); unused losses carry forward. On sale, claimed depreciation is recaptured at up to 25%, and gains may owe capital-gains tax (a 1031 exchange can defer both). Figures are a year-1 estimate at your 24.0% rate — not tax advice; consult a CPA.
Schools (NCES district)
- District
- Corpus Christi ISD
- NCES district ID
- 4815270
- Math proficiency
- 31% ▼ -18.00%
- Reading proficiency
- 35% ▼ -7.00%
- Median HH income
- $45,672
- Composite
- 28.27/100
- National rank
- #6793
- State rank
- #562 of 826 in TX
Livability — Corpus Christi
- Score
- 78/100
- State rank
- #66
- US rank
- #2404
Category grades
Schools grade is shown separately in the Schools card above.
Census & demographics
- Census place
- Corpus Christi, TX
- County
- Nueces County · 296,836 people
- City population
- 296,836
- Metro
- Corpus Christi, TX
- Population (ZIP)
- 38,631
- Household income
- $61,215
- Rent vs Own
- Severe rent burden
- 1932.0
Population outlook (Nueces County) Hauer SSP2
- Today (2025)
- 418,037 people
- By 2030
- 447,123 · +7.0%
- By 2040
- 505,911 · +21.0%
- By 2050
- 567,522 · +35.8%
- By 2075
- 729,686 · +74.6%
- By 2100
- 847,087 · +102.6%
Race, ethnicity, and origin ACS 2023
- Neighborhood character
- Diverse neighborhood (Simpson 0.56)
- Race & ethnicity
- Hispanic / Latino 57% White 34% Two or more races 29% Asian 4% Black 3%
- Hispanic origin (detail)
- Mexican 52%
- Common ancestry
- Slovak 2% Romanian 1% Lithuanian 1%
- Foreign-born
- 8% · Canada, China, Vietnam
- Languages at home
- 74% English-only · Spanish 22% Other Indo-European 1% Vietnamese 1%
Political lean MEDSL · Nueces
- 2024 margin
- R (+11.5) · D 43.8% · R 55.3%
- 2008→2024 swing
- -7.1pp toward R · 2008: -4.4pp · 2024: -11.5pp
- All cycles
- 2024: R+11.5 2020: R+2.9 2016: R+1.5 2012: R+3.2 2008: R+4.4
Not yet ingested
- Civics
- —
Market trends
- HPI YoY
- ▼ -255.29%
- Current HPI
- 177.36
- Rent YoY
- ▼ -1.53%
- Metro
- Corpus Christi, TX
- State GDP YoY
- ▲ 3.95%
- F500 in state
- 110
Industry mix (Fortune 500 HQ in TX)
| Industry | F500 HQs | Revenue |
|---|---|---|
| Energy | 16 | $1,198B |
|
||
| Technology | 5 | $198B |
|
||
| Engineering / Construction | 4 | $72B |
|
||
| Energy Services | 3 | $60B |
|
||
| Utilities | 3 | $41B |
|
||
| Healthcare | 2 | $330B |
|
||
Price history
+198.6% since first listed12 events — show timeline
- 2026-05-02 Price Changed $149,000 CBMLS
- 2026-04-10 Listed $159,500 CBMLS
- 2017-08-31 Sold (Public Records) — Public Records
- 2014-04-25 Sold (Public Records) — Public Records
- 2014-04-22 Sold (Public Records) — Public Records
- 2008-07-31 Sold (Public Records) — Public Records
- 2008-07-16 Sold (MLS) — CBMLS
- 2008-01-14 Listed $49,900 CBMLS
- 2006-09-14 Sold (Public Records) — Public Records
- 2006-09-12 Sold (MLS) — CBMLS
- 2006-04-17 Listed $55,000 CBMLS
- 2005-01-17 Listed $49,900 CBMLS
Property tax history
-0.2%/yrLatest (2025): $2,542 · -32.8% YoY. Source: county tax records.
Cash-flow waterfall
monthlySold comps — $/sqft
last 12 mo · ≤1 miLoading sold comps…