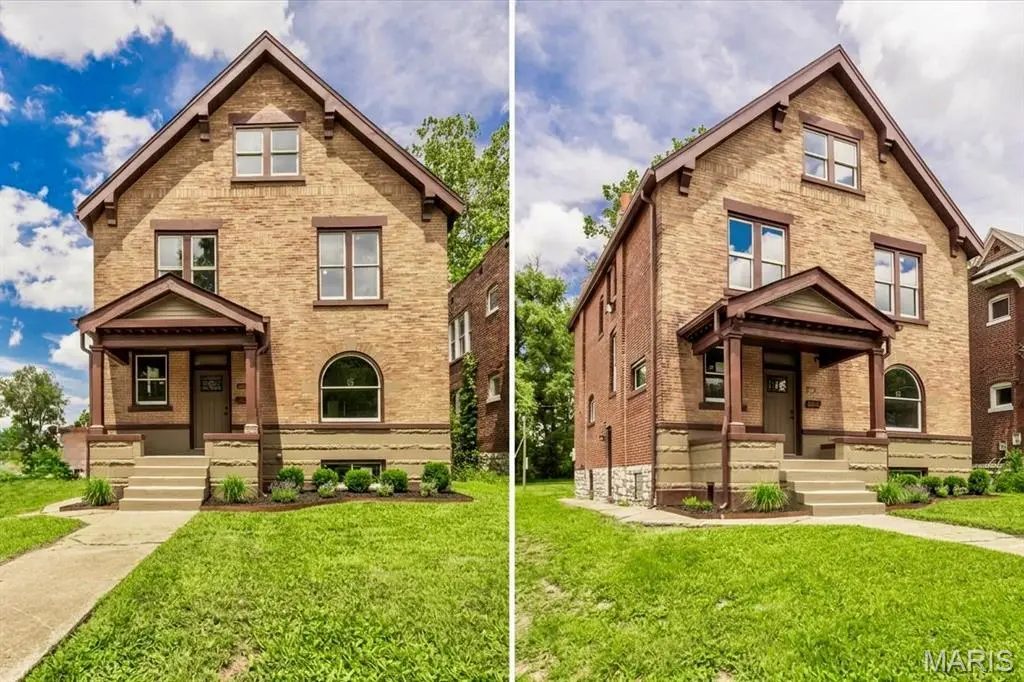
6027 Etzel Ave · St. Louis, MO
Flood risk 1/10 · Minimal
- FEMA flood zone
- X (unshaded)
- Chance of flooding over 30 yrs
- 0.0%
- Est. flood insurance / yr
- $473 – $860
Fire risk 1/10 · Minimal
- Est. fire insurance / yr
- $1,054 – $1,958
Heat risk 5/10 · Moderate
- Hot days now (above 107°F)
- 7 days/yr
- Hot days in 30 yrs
- 21 days/yr
Wind risk 2/10 · Minimal
- Chance of severe wind over 30 yrs
- 1.0%
Air-quality risk 4/10 · Minor
- Unhealthy air days now
- 4 days/yr
- Unhealthy air days in 30 yrs
- 5 days/yr
Risk factors via First Street. Map © Google.
Why this score? — see what drove the B grade
The composite is a weighted blend of 9 inputs, each scored 0–100. Each bar is that input's sub-score; the figure is the points it added to the 100-point composite (weight × sub-score).
- Cash flow +30.0/30.0
- ARV discount +15.0/15.0
- 1% rule +10.0/10.0
- DSCR +10.0/10.0
- Rent growth +3.1/5.0
- Livability +2.5/5.0
- Condition / age +2.5/5.0
- Schools +1.2/10.0
- Appreciation +0.0/10.0
$165,000
🖨 Deal sheet (PDF) 📄 Offer letter ✓ Due diligence
Listing remarks
Step into the possibilities of this impressive three story historic home, ideally situated in one of the city's most up and coming neighborhoods, The West End. Situated perfectly behind the sought after Delmar Loop and just 2 miles from the incredible Delmar Maker District, this incredible home is rich with character, charm, and architectural detail, this property offers the rare opportunity to complete a stunning restoration while benefiting from the peace of mind that comes with the major improvements already being done. Positioned on an oversized double lot, the home boasts an incredible footprint with the potential to become a spacious SIX bedroom, FOUR bathroom residence. Many of the c
Key facts
- Oversized double lot
- Large yard
- Spacious footprint
Tags
Property features AI
Exterior
- Utilities: Public water; Public sewer; Electric service by Ameren; Cable available
- Home design: Single-family residence; Residential property; Three or more levels; Estimated 2,800 above-grade finished area
- Construction: Brick construction
- Exterior features: Back yard; Cleared lot; Corner lot
Interior
- Bedrooms: Six bedrooms (all on upper level)
- Bathrooms: Three full bathrooms; One half bathroom (main level)
- Heating & cooling: No heating specified; No cooling specified
- Interior features: Walk-out basement
Neighborhood map
What this means for you Summary
Snapshot
- This is a 6-bed/3.5-bath single-family listed at $165k.
Deal economics
- At list price, monthly cash flow is $852 ($10k/yr) — positive.
- The deal already cash-flows at list — no discount required.
- Meets the 1% rule at list price ($3k rent vs $165k).
- Recommended offer: $163k (1.5% below list) — sets the bar for market timing.
- Cap rate 12.5% vs local median 5.0% in St. Louis — top-decile yield for the area; either an underpriced asset or a hidden risk that comps aren't pricing in. Stress-test before assuming the spread holds.
Location & tenants
- Location reads: area grade B — affects rentability + tenant quality, not the cash-flow math above.
- St. Louis City (urban): math 10% / reading 18% proficiency, ranked #312 of 324 in MO (top 96%) — low school quality limits family demand, transient renter base, plan for 1-2y turnover; 80% free/reduced lunch — lower-income household profile, screen leases tightly.
- Zoned schools: Adams Elem. (math 2% / reading 8%, grade F, #1,072 of 1,115 statewide, top 98%, 174 students, 98% FRL); Gateway Middle (math 0% / reading 8%, grade F, #389 of 391 statewide, top 100%, 506 students, 99% FRL); Beaumont Cte High School (math 5% / reading 5%, grade F, #517 of 521 statewide, top 100%, 236 students, 99% FRL) — zoned schools average 99% FRL vs 80% district-wide (18 pts higher); higher-poverty schools than district average — tighter screening recommended.
- Market conditions: Rents rising (+2.4%/yr); 122 active listings in the ZIP; 4 comparable units currently listed for rent nearby; rentals at typical pace (median 26d on market — plan ~3-4 weeks tenant-placement turnaround); 294 units permitted in St. Louis city in 2024 (227 in 5+ unit buildings).
Forward outlook
- Local home prices are declining (-3.0%/yr); year-one equity from $1k of loan paydown is wiped out by about $5k of value loss. Plan a longer hold.
- St. Louis County population projected to shrink 6% by 2050 — rents likely to lag national; underwrite the cash flow, not the appreciation.
- At projected returns (-3.0% appreciation + 2.4% rent growth), your $46k cash investment doubles in ~6 years — after that, you're playing with house money.
Negotiation context
- It's been on market 16 days — a 2% lower offer ($163k) is reasonable based on typical stale-listing flexibility.
- 2 sale attempts with the ask held roughly flat each time — persistent listings suggest the price (not the market) is what's stuck; bring a comps-based counter.
- Current owner paid $82k; list at $165k implies a 100% gain — meaningful room to come down on a strong offer.
Risks & watch-outs
- Watch-outs: built in 1911 — expect roof / HVAC / electrical / plumbing capex.
- Climate carrying-cost: extreme-heat days projected 7→21/yr by 2055 (HVAC capex compounding) — expect insurance premiums to compound above CPI over the hold.
Questions for the listing agent
- Built in 1911 — when were the roof, HVAC, electrical panel, plumbing, and water heater last replaced?
- Is there a deadline driving the sale (1031 exchange, divorce, estate, relocation)? That informs how much negotiation room exists.
- What's the average days-on-market for RENTAL listings here right now (not sales)? A rising rental-DOM trend means longer vacancies and softer asking-rent achievability than the comps imply.
- What's the recent tenant-quality profile in this submarket — average credit score on applications, eviction rate, late-payment / NSF rate, and stable-employment percentage? A property-management company in the area should have these aggregated.
- How much new for-sale + rental construction is in the pipeline within 1–3 miles? Heavy new supply typically softens prices + rents 12–24 months out; constrained supply supports both.
Investment metrics
- 1% rule
- 1.53% ✓
- Cap rate
- 12.49%
- Cash-on-cash
- 22.12%
- DSCR
- 1.98
- GRM
- 5.5
CMA / ARV
- ARV (on-the-fly)
- $220,200
- Comps found
- 8
Show comp detail 8 sales within ~0.75 mi
| Address | Dist | Beds/Ba | Sqft | Sold | Price | $/sf | Match |
|---|---|---|---|---|---|---|---|
| 6027 Etzel Ave | 0.00mi | 6/2.0 | 2,202 (0%) | 5mo | $83,000 | $38 | 90 |
| 6018 Horton Pl | 0.22mi | 5/1.5 (-1) | 2,105 (-4%) | 9mo | $210,000 | $100 | 62 |
| 5735 Page Blvd | 0.50mi | 7/3.0 (+1) | 2,252 (+2%) | 17mo | $29,900 | $13 | 52 |
| 5828 Julian Ave | 0.33mi | 6/3.5 | 2,496 (+13%) | 16mo | $119,900 | $48 | 49 |
| 6012 Clemens Ave | 0.59mi | 5/3.5 (-1) | 2,296 (+4%) | 15mo | $300,000 | $131 | 48 |
| 5911 Enright Ave | 0.65mi | 5/3.5 (-1) | 2,106 (-4%) | 14mo | $399,900 | $190 | 46 |
| 5647 Chamberlain Ave | 0.53mi | 5/2.5 (-1) | 2,502 (+14%) | 1mo | $265,000 | $106 | 42 |
| 5929 Cates Ave | 0.49mi | 5/1.5 (-1) | 1,980 (-10%) | 11mo | $100,000 | $51 | 38 |
Match score weights: distance 35% · size 25% · config 20% · recency 20%. Top-matched comps best support the ARV.
Projected returns pro-forma
-3.0% appreciation · 2.39% rent growth · sell at horizon
- IRR
- 14.2%
- Equity multiple
- 1.56×
- Total profit
- $26,000
- Equity at exit
- $24,602
- IRR
- 22.5%
- Equity multiple
- 2.87×
- Total profit
- $86,399
- Equity at exit
- $14,266
Cash invested: $46,200 (down + closing). Projections, not guarantees.
Landlord ↔ Tenant lean methodology
- Overall (STATE)
- 81 Strongly Landlord-Friendly
- State Missouri
- 81 Strongly Landlord-Friendly · R+10
- County
- — inherits STATE
- City
- — inherits STATE
ZIP-level market 63112
- Rents YoY
- 2.4%
- Active inventory
- 122
- Price-to-rent
- 5.5×
Monthly cashflow live
- Estimated rent
- $2,521 medium interval (Pro) →
- Mortgage (P&I)
- −$865
- Tax est. 1.5%
- −$206 /mo · $2,475/yr
- Insurance
- −$69
- HOA
- −$0
- Vacancy / Maint / Mgmt
- −$529
- Net cashflow
- $852
Break-even live
Sensitivity live
| Price | -10% $966 | -5% $909 | +0% $852 | +5% $795 | +10% $738 |
|---|---|---|---|---|---|
| Rent | -10% $652 | -5% $752 | +0% $852 | +5% $951 | +10% $1,051 |
| Rate | -1.0pp $935 | -0.5pp $894 | base $852 | +0.5pp $809 | +1.0pp $765 |
UW: 25.0% down · 7.5% · 30yr · 1.5% tax · 5.0% vac · 8.0% maint · 8.0% mgmt
Financing live
Cash to close
- Down payment
- $41,250
- Closing costs
- $4,950
- Reserves months
- —
- Total cash needed
- —
Loan-product check · same deal, 3 products live
Conventional
25% down · 7.5% · 30yr
- Down + closing
- —
- Monthly P&I
- —
- Monthly cashflow
- —
- DSCR
- —
- Eligible?
- —
Personal DTI + credit; lowest rate.
DSCR
20% down · 8.5% · 30yr
- Down + closing
- —
- Monthly P&I
- —
- Monthly cashflow
- —
- DSCR
- —
- Eligible?
- —
No personal income docs; deal must DSCR.
Hard money
10% down · 12.0% · 12mo
- Down + closing
- —
- Monthly P&I
- —
- Monthly cashflow
- —
- DSCR
- —
- Eligible?
- —
Short-term bridge; refi at stabilization.
Rent comps 4 comps
| Address | Beds | Baths | Sqft | Rent | $/sqft | DOM | Units | Dist |
|---|---|---|---|---|---|---|---|---|
| 14 Parkland Pl Saint Louis, MO | 5.0 | 3.0 | 2830 | $2,500 | $0.88 | 9d | 1 | 0.24mi |
| 14 Parkland Pl Saint Louis, MO | 5.0 | 3.0 | 2830 | $2,500 | $0.88 | 25d | 1 | 0.24mi |
| 14 Parkland Pl Unit NA St. Louis, MO | 5.0 | 3.0 | 2830 | $2,700 | $0.95 | 45d | 1 | 0.24mi |
| 14 Parkland Pl Unit 1 St. Louis, MO | 5.0 | 3.0 | 2830 | $2,700 | $0.95 | 25d | 1 | 0.24mi |
Listing history 10 events
-
2026-06-21days on market $165,000 Active 16 DOM
-
2026-06-18days on market $165,000 Active 13 DOM
-
2026-06-17days on market $165,000 Active 12 DOM
-
2026-06-16days on market $165,000 Active 11 DOM
-
2026-06-15days on market $165,000 Active 10 DOM
-
2026-06-13days on market $165,000 Active 8 DOM
-
2026-06-09days on market $165,000 Active 4 DOM
-
2026-06-08days on market $165,000 Active 3 DOM
-
2026-06-07remarks 699-char remark
-
2026-06-07$165,000 Active 2 DOM
ⓘ Source: listings_history table (triggers on properties + properties_extension) + one-shot
backfill from property_details.listing_events for pre-trigger history.
Climate risk First Street
- Flood 1/10 Low FEMA zone X (unshaded) · 0% chance over 30 yrs
- Wildfire 1/10 Low
- Heat 5/10 Major 7 d/yr ≥107°F today · 21 d/yr by 30 yrs out
- Wind 2/10 Low 100% chance of damaging wind over 30 yrs
- Air quality 4/10 Moderate 4 unhealthy d/yr today · 5 by 30 yrs out
Nearby sold comps map
Loading sold comps map…
Walkable amenities ~0.75 mi
Loading nearby amenities…
Taxation est. · year 1
- Rental income
- $30,256
- − Mortgage interest
- −$9,243
- − Property taxes
- −$2,475
- − Insurance
- −$825
- − Repairs & maintenance
- −$2,420
- − Management
- −$2,420
- − Depreciation
- −$4,800
- Taxable income
- $8,072
- Est. tax owed @ 24.0%
- −$1,937
- After-tax cash flow
- $8,281/yr
For passive investors: Depreciation is non-cash, so a rental often shows a tax loss while cash-flowing — sheltering income. Rental losses are passive: they offset passive income freely, and up to $25,000/yr can offset ordinary (W-2) income if you actively participate and your MAGI is under $100k (phasing out to $0 by $150k); unused losses carry forward. On sale, claimed depreciation is recaptured at up to 25%, and gains may owe capital-gains tax (a 1031 exchange can defer both). Figures are a year-1 estimate at your 24.0% rate — not tax advice; consult a CPA.
Schools (NCES district)
- District
- St. Louis City
- NCES district ID
- 2929280
- Math proficiency
- 10% ▼ -6.00%
- Reading proficiency
- 18% ▼ -3.00%
- Median HH income
- $35,685
- Composite
- 11.54/100
- National rank
- #9699
- State rank
- #312 of 324 in MO
Livability — St. Louis
No livability data for this city. (Only ~50 U.S. cities are tracked.)
Census & demographics
- Census place
- St. Louis, MO
- County
- Saint Louis City · 254,015 people
- City population
- 283,259
- Metro
- St. Louis, MO-IL
- Population (ZIP)
- 17,985
- Household income
- $45,542
- Rent vs Own
- Severe rent burden
- 1457.0
Population outlook (St. Louis County) Hauer SSP2
- Today (2025)
- 315,737 people
- By 2030
- 313,865 · -0.6%
- By 2040
- 305,439 · -3.3%
- By 2050
- 296,529 · -6.1%
- By 2075
- 271,028 · -14.2%
- By 2100
- 255,359 · -19.1%
Race, ethnicity, and origin ACS 2023
- Neighborhood character
- Majority Black (63%)
- Race & ethnicity
- Black 63% White 24% Asian 6% Two or more races 5% Hispanic / Latino 4%
- Common ancestry
- Lithuanian 1% Scotch-Irish 1% Romanian 1%
- Foreign-born
- 9% · China, South Korea, Canada
- Languages at home
- 88% English-only · Spanish 3% Chinese 2% Korean 2%
Political lean MEDSL · St. Louis
- 2024 margin
- Solid D (+64.7) · D 81.4% · R 16.7% · Other 2.0%
- 2008→2024 swing
- -3.5pp toward R · 2008: 68.2pp · 2024: 64.7pp
- All cycles
- 2024: D+64.7 2020: D+66.2 2016: D+63.7 2012: D+66.6 2008: D+68.2
Not yet ingested
- Civics
- —
Market trends
- HPI YoY
- ▼ -158.94%
- Current HPI
- 115.1863
- Rent YoY
- ▲ 2.39%
- Metro
- St. Louis, MO-IL
- State GDP YoY
- ▲ 1.84%
- F500 in state
- 20
Industry mix (Fortune 500 HQ in MO)
| Industry | F500 HQs | Revenue |
|---|---|---|
| Healthcare | 1 | $163B |
|
||
| Insurance | 1 | $21B |
|
||
| Industrial Technology | 1 | $17B |
|
||
| Retail | 1 | $16B |
|
||
| Industrial Distribution | 1 | $10B |
|
||
| Utilities | 1 | $9B |
|
||
Price history
+100.0% since first listed6 events — show timeline
- 2026-06-05 Listed $165,000 MARIS as Distributed by MLS Grid
- 2026-06-05 Coming Soon $165,000 MARIS as Distributed by MLS Grid
- 2026-01-23 Sold (MLS) — MARIS as Distributed by MLS Grid
- 2025-12-23 Pending — MARIS as Distributed by MLS Grid
- 2025-12-22 Listed $83,000 MARIS as Distributed by MLS Grid
- 2023-03-29 Sold (Public Records) $82,500 Public Records
Property tax history
+1.5%/yrLatest (2024): $277 · +4.6% YoY. Source: county tax records.
Cash-flow waterfall
monthlySold comps — $/sqft
last 12 mo · ≤1 miLoading sold comps…