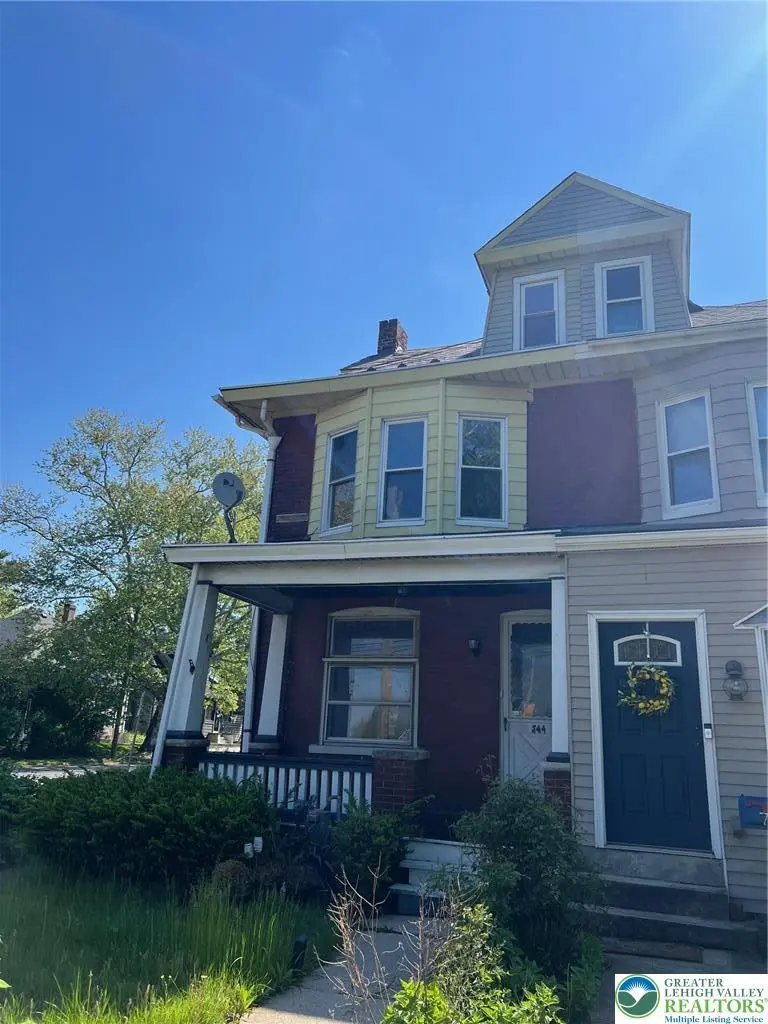
744 8th Ave · Bethlehem, PA
Flood risk 1/10 · Minimal
- FEMA flood zone
- X (unshaded)
- Chance of flooding over 30 yrs
- 0.0%
- Est. flood insurance / yr
- $473 – $860
Fire risk 4/10 · Minor
- Est. fire insurance / yr
- $511 – $949
Heat risk 5/10 · Moderate
- Hot days now (above 100°F)
- 7 days/yr
- Hot days in 30 yrs
- 15 days/yr
Wind risk 4/10 · Minor
- Chance of severe wind over 30 yrs
- 15.0%
Air-quality risk 4/10 · Minor
- Unhealthy air days now
- 3 days/yr
- Unhealthy air days in 30 yrs
- 6 days/yr
Risk factors via First Street. Map © Google.
Why this score? — see what drove the C- grade
The composite is a weighted blend of 9 inputs, each scored 0–100. Each bar is that input's sub-score; the figure is the points it added to the 100-point composite (weight × sub-score).
- Cash flow +15.1/30.0
- ARV discount +14.3/15.0
- DSCR +4.6/10.0
- 1% rule +4.4/10.0
- Livability +4.1/5.0
- Schools +3.5/10.0
- Rent growth +2.7/5.0
- Condition / age +2.5/5.0
- Appreciation +0.0/10.0
$249,900
🖨 Deal sheet 📄 Offer letter ✓ Due diligence
Listing remarks MLS
Large twin in West Bethlehem in need of mostly cosmetic updating. 3 bedrooms, 1 bath home with expandable attic which could be converted into 2 additional bedrooms. Off street parking. Full basement. Mud room which could accomodate extra bath or first floor laundry. CO ordered. Home being sold AS IS.
Key facts
- Parking
- Built 1910
- Listed 44 days
Property features AI
Finance
- HOA & community: Curbs
Exterior
- Parking: Driveway; Off-street parking
- Utilities: Public water; Public sewer; Gas water heater
- Home design: 3 stories; Brick construction; Slate roof
- Construction: Brick construction; Slate roof; 3-story building
- Exterior features: Porch; Yard fenced; Corner lot; Has a view
Interior
- Kitchen: Dishwasher; Electric oven; Refrigerator; Eat-in kitchen
- Bedrooms: Bedroom on second level; Bedroom on second level; Bedroom on third level; Den on third level
- Flooring: Hardwood flooring
- Bathrooms: 1 full bathroom
- Heating & cooling: Forced air heating (gas)
- Interior features: Dining area; Separate/formal dining room; Eat-in kitchen; Home office; Full basement
- Laundry & utility: Laundry/mud room on first level; Additional laundry area on first level (could convert to half bath); Gas water heater
Neighborhood map
What this means for you Summary
Snapshot
- This is a 3-bed/1.0-bath townhouse listed at $250k.
Deal economics
- At list price, monthly cash flow is $80 ($962/yr) — positive.
- The deal already cash-flows at list — no discount required.
- To meet the 1% rule (rent ≥ 1% of price), the offer needs to be $235k (5.8% below list).
- Recommended offer: $235k (5.8% below list) — sets the bar for 1% rule.
- Cap rate 6.7% vs local median 4.3% in Bethlehem — top-decile yield for the area; either an underpriced asset or a hidden risk that comps aren't pricing in. Stress-test before assuming the spread holds.
Location & tenants
- Location reads 82/100 on livability (#138 in PA, #1,122 nationally) — a professional / high-income tenant draw. Strengths: amenities A+, cost of living A+, housing A+; Watch: commute F.
- Bethlehem Area SD (urban): math 31% / reading 49% proficiency, ranked #342 of 539 in PA (top 64%) — families likely to look elsewhere, expect single-tenant / working-renter base with shorter leases.
- Market conditions: Rents flat; 103 active listings in the ZIP; 28 comparable units currently listed for rent nearby; rentals at typical pace (median 24d on market — plan ~3-4 weeks tenant-placement turnaround); solid renter incomes; 765 units permitted in Lehigh County in 2024 (286 in 5+ unit buildings).
- This rent runs 37% of the median local income ($75k/yr) — at the standard rent-burdened threshold; future hikes will face affordability resistance.
Forward outlook
- Local home prices are declining (-3.0%/yr); year-one equity from $2k of loan paydown is wiped out by about $7k of value loss. Plan a longer hold.
- Lehigh County population projected at +21% by 2050 — long-run rental-demand tailwind backs the buy-and-hold thesis.
Negotiation context
- It's been on market 44 days — a 3% lower offer ($242k) is reasonable based on typical stale-listing flexibility.
- 2 sale attempts since 18y ago; this cycle's ask has dropped $20k (7%) from the opening price — seller is motivated, your offer sets the floor, not the list.
- Current owner paid $105k; list at $250k implies a 138% gain — meaningful room to come down on a strong offer.
Risks & watch-outs
- Watch-outs: built in 1910 — expect roof / HVAC / electrical / plumbing capex.
- Climate carrying-cost: extreme-heat days projected 7→15/yr by 2055 (HVAC capex compounding) — expect insurance premiums to compound above CPI over the hold.
Questions for the listing agent
- It's been on market 44 days. Have you received any prior offers? Is the seller open to a 6% concession, seller financing, or rate buy-down credit?
- Built in 1910 — when were the roof, HVAC, electrical panel, plumbing, and water heater last replaced?
- Is there a deadline driving the sale (1031 exchange, divorce, estate, relocation)? That informs how much negotiation room exists.
- Schools are B-rated — typically a magnet for longer-tenancy family renters. What's the average tenant stay here, and is there a school-zone premium baked into asking?
- What's the average days-on-market for RENTAL listings here right now (not sales)? A rising rental-DOM trend means longer vacancies and softer asking-rent achievability than the comps imply.
- What's the recent tenant-quality profile in this submarket — average credit score on applications, eviction rate, late-payment / NSF rate, and stable-employment percentage? A property-management company in the area should have these aggregated.
- How much new for-sale + rental construction is in the pipeline within 1–3 miles? Heavy new supply typically softens prices + rents 12–24 months out; constrained supply supports both.
Investment metrics
- 1% rule
- 0.94% ✗
- Cap rate
- 6.68%
- Cash-on-cash
- 1.37%
- DSCR
- 1.06
- GRM
- 8.9
CMA / ARV
- ARV (median comp)
- $294,363
- List price
- $249,900
- Delta
- -15.10%
- Verdict
- UNDERPRICED
- Comps
- 20 within 1.0 mi
Show comp detail 12 sales within ~0.75 mi
| Address | Dist | Beds/Ba | Sqft | Sold | Price | $/sf | Match |
|---|---|---|---|---|---|---|---|
| 731 6th Ave | 0.11mi | 3/1.0 | 2,000 (+1%) | 3mo | $265,000 | $133 | 90 |
| 709 6th Ave | 0.13mi | 3/1.5 | 2,012 (+2%) | 1mo | $315,000 | $157 | 88 |
| 720 7th Ave | 0.08mi | 3/1.5 | 1,906 (-3%) | 3mo | $285,000 | $150 | 86 |
| 531 9th Ave | 0.25mi | 3/1.5 | 1,884 (-4%) | 7mo | $355,000 | $188 | 73 |
| 514 2nd Ave | 0.50mi | 4/1.0 (+1) | 1,935 (-2%) | 9mo | $299,900 | $155 | 61 |
| 1007 Main St | 0.69mi | 3/1.0 | 1,944 (-1%) | 8mo | $165,000 | $85 | 58 |
| 420 2nd Ave | 0.55mi | 3/1.0 | 2,157 (+9%) | 2mo | $350,000 | $162 | 57 |
| 629 Terrace Ave | 0.53mi | 3/1.0 | 1,803 (-9%) | 11mo | $370,000 | $205 | 52 |
| 1032 Main St | 0.73mi | 3/1.5 | 1,865 (-5%) | 6mo | $315,000 | $169 | 50 |
| 350 6th Ave | 0.41mi | 4/1.0 (+1) | 1,754 (-11%) | 10mo | $293,611 | $167 | 49 |
| 231 7th Ave | 0.58mi | 3/3.0 | 1,782 (-10%) | 6mo | $343,000 | $192 | 44 |
| 227 W Lehigh | 0.74mi | 3/2.5 | 1,700 (-14%) | 9mo | $300,000 | $176 | 29 |
Match score weights: distance 35% · size 25% · config 20% · recency 20%. Top-matched comps best support the ARV.
Projected returns pro-forma
-3.0% appreciation · 0.85% rent growth · sell at horizon
- IRR
- -16.6%
- Equity multiple
- 0.42×
- Total profit
- $-40,308
- Equity at exit
- $37,261
- IRR
- -12.9%
- Equity multiple
- 0.32×
- Total profit
- $-47,841
- Equity at exit
- $21,607
Cash invested: $69,972 (down + closing). Projections, not guarantees.
Landlord ↔ Tenant lean methodology
- Overall (STATE)
- 62 Landlord-Friendly
- State Pennsylvania
- 62 Landlord-Friendly · EVEN
- County
- — inherits STATE
- City
- — inherits STATE
ZIP-level market 18018
- Rents YoY
- 0.8%
- Active inventory
- 103
- Price-to-rent
- 8.9×
Monthly cashflow live
- Estimated rent
- $2,353 high interval (Pro) →
- Mortgage (P&I)
- −$1,311
- Tax from tax record
- −$364 /mo · $4,370/yr
- Insurance
- −$104
- HOA
- −$0
- Vacancy / Maint / Mgmt
- −$494
- Net cashflow
- $80
Break-even live
UW: 25.0% down · 7.5% · 30yr · 1.5% tax · 5.0% vac · 8.0% maint · 8.0% mgmt
Financing live
Cash to close
- Down payment
- $62,475
- Closing costs
- $7,497
- Reserves months
- —
- Total cash needed
- —
Loan-product check · same deal, 3 products live
Conventional
25% down · 7.5% · 30yr
- Down + closing
- —
- Monthly P&I
- —
- Monthly cashflow
- —
- DSCR
- —
- Eligible?
- —
Personal DTI + credit; lowest rate.
DSCR
20% down · 8.5% · 30yr
- Down + closing
- —
- Monthly P&I
- —
- Monthly cashflow
- —
- DSCR
- —
- Eligible?
- —
No personal income docs; deal must DSCR.
Hard money
10% down · 12.0% · 12mo
- Down + closing
- —
- Monthly P&I
- —
- Monthly cashflow
- —
- DSCR
- —
- Eligible?
- —
Short-term bridge; refi at stabilization.
Rent comps 28 comps
| Address | Beds | Baths | Sqft | Rent | $/sqft | DOM | Units | Dist |
|---|---|---|---|---|---|---|---|---|
| 520 W Union Blvd Unit 2 Bethlehem, PA | 3.0 | 1.0 | 2225 | $2,150 | $0.97 | 23d | 1 | 0.25mi |
| 1345 Martin Ct Bethlehem, PA | 1.0–2.0 | 1.0–2.0 | 1184 | $2,370 | $2.00 | 2d | 8 | 0.45mi |
| 1210 Eaton Ave #201 Bethlehem, PA | 2.0 | 2.0 | 1350 | $2,350 | $1.74 | 43d | 1 | 0.63mi |
| 1718 Calypso Ave Bethlehem, PA | 4.0 | 1.5 | 1912 | $2,700 | $1.41 | 43d | 1 | 0.73mi |
| 68 W Union Blvd Bethlehem, PA | 4.0 | 1.5 | 1804 | $2,295 | $1.27 | 14d | 1 | 0.74mi |
| 56 W North St Bethlehem, PA | 2.0 | 2.0 | 1486 | $2,400 | $1.62 | 14d | 1 | 0.76mi |
| 1926 W Broad St Bethlehem, PA | 4.0 | 1.0 | 1492 | $2,000 | $1.34 | 14d | 1 | 0.93mi |
| 1136 N New St Bethlehem, PA | 3.0 | 1.0 | 1296 | $2,300 | $1.77 | 2d | 1 | 0.96mi |
| 1411 Greenview Dr Unit 12 Bethlehem, PA | 2.0 | 2.5 | 1380 | $2,500 | $1.81 | 43d | 1 | 1.01mi |
| 1411 Greenview Dr Unit 17 Bethlehem, PA | 2.0 | 2.5 | 1400 | $2,500 | $1.79 | 23d | 1 | 1.01mi |
| 42 E Wall St Bethlehem, PA | 4.0 | 1.0 | 1474 | $2,550 | $1.73 | 23d | 1 | 1.02mi |
| 1320 Chelsea Ave Bethlehem, PA | 3.0 | 2.0 | 1373 | $2,395 | $1.74 | 2d | 1 | 1.06mi |
| 1320 Chelsea Ave Bethlehem, PA | 3.0 | 2.0 | 1373 | $2,349 | $1.71 | 14d | 1 | 1.06mi |
| 129 E Goepp St Bethlehem, PA | 3.0 | 2.0 | 1648 | $2,600 | $1.58 | 2d | 1 | 1.11mi |
| 517 Seneca St Unit 1 Bethlehem, PA | 2.0 | 1.5 | 1500 | $2,200 | $1.47 | 43d | 1 | 1.11mi |
| 11 W 2nd St Bethlehem, PA | 2.0 | 2.0 | 1620 | $2,550 | $1.57 | 23d | 4 | 1.13mi |
| 239 E Church St Bethlehem, PA | 3.0 | 2.5 | 1724 | $2,950 | $1.71 | 23d | 1 | 1.29mi |
| 316 E Union Blvd Bethlehem, PA | 4.0 | 2.0 | 1460 | $2,145 | $1.47 | 43d | 1 | 1.32mi |
| 417 Linden St Bethlehem, PA | 3.0 | 1.5 | 1699 | $2,450 | $1.44 | 2d | 1 | 1.33mi |
| 326 E Frankford St Bethlehem, PA | 2.0 | 2.0 | 1250 | $2,300 | $1.84 | 23d | 1 | 1.35mi |
| 326 E Frankford St Bethlehem, PA | 2.0 | 2.0 | 1250 | $2,300 | $1.84 | 43d | 1 | 1.35mi |
| 311 E 3rd St Bethlehem, PA | 2.0 | 2.0 | 1189 | $2,330 | $1.96 | 2d | 3 | 1.39mi |
| 1214 Maple St Bethlehem, PA | 3.0 | 1.0 | 1462 | $2,000 | $1.37 | 43d | 1 | 1.44mi |
| 1818 Catasauqua Rd Bethlehem, PA | 1.0–3.0 | 1.0–2.0 | 1007 | $2,803 | $2.78 | 43d | 9 | 1.44mi |
| 1129 Russell Ave Fountain Hill, PA | 3.0 | 1.0 | 1376 | $1,750 | $1.27 | 23d | 1 | 1.47mi |
| 1129 Russell Ave Fountain Hill, PA | 3.0 | 1.0 | 1376 | $1,900 | $1.38 | 43d | 1 | 1.47mi |
| 822 Elm St Bethlehem, PA | 3.0 | 1.5 | 1406 | $2,195 | $1.56 | 14d | 1 | 1.50mi |
| 802 Elm St Bethlehem, PA | 4.0 | 1.5 | 1520 | $2,800 | $1.84 | 21d | 1 | 1.50mi |
Listing history 18 events
-
2026-06-18days on market $249,900 Active 44 DOM
-
2026-06-17days on market $249,900 Active 43 DOM
-
2026-06-16days on market $249,900 Active 42 DOM
-
2026-06-15days on market $249,900 Active 41 DOM
-
2026-06-14days on market $249,900 Active 39 DOM
-
2026-06-10days on market $249,900 Active 36 DOM
-
2026-06-09days on market $249,900 Active 35 DOM
-
2026-06-08days on market $249,900 Active 34 DOM
-
2026-06-07days on market $249,900 Active 33 DOM
-
2026-06-03days on market $249,900 Active 29 DOM
-
2026-06-02days on market $249,900 Active 28 DOM
-
2026-06-01pricedays on market $249,900 Active 27 DOM
-
2026-05-31days on market $270,000 Active 26 DOM
-
2026-05-31days on market $270,000 Active 25 DOM
-
2026-05-05$270,000 Active 1029-char remark
-
2008-03-27soldstatus $105,000 301-char remark
Show marketing remark (301 chars)
Large twin in West Bethlehem in need of mostly cosmetic updating. 3 bedrooms, 1 bath home with expandable attic which could be converted into 2 additional bedrooms. Off street parking. Full basement. Mud room which could accomodate extra bath or first floor laundry. CO ordered. Home being sold AS IS.
-
2008-03-27soldstatus $105,000
Show marketing remark (301 chars)
Large twin in West Bethlehem in need of mostly cosmetic updating. 3 bedrooms, 1 bath home with expandable attic which could be converted into 2 additional bedrooms. Off street parking. Full basement. Mud room which could accomodate extra bath or first floor laundry. CO ordered. Home being sold AS IS.
-
2008-02-06$99,900 301-char remark
Show marketing remark (301 chars)
Large twin in West Bethlehem in need of mostly cosmetic updating. 3 bedrooms, 1 bath home with expandable attic which could be converted into 2 additional bedrooms. Off street parking. Full basement. Mud room which could accomodate extra bath or first floor laundry. CO ordered. Home being sold AS IS.
ⓘ Source: listings_history table (triggers on properties + properties_extension) + one-shot
backfill from property_details.listing_events for pre-trigger history.
Tax reassessment forecast PA · Partial reset (capped growth)
- Current annual tax
- $4,370 · $364/mo
- Projected year-2 tax
- $4,370 · $364/mo
- Expected delta
- $0/yr ($0/mo · 0.0%)
ⓘ Screening estimate from a state-policy table — verify with the county assessor before closing.
Climate risk First Street
- Flood 1/10 Low FEMA zone X (unshaded) · 0% chance over 30 yrs
- Wildfire 4/10 Moderate
- Heat 5/10 Major 7 d/yr ≥100°F today · 15 d/yr by 30 yrs out
- Wind 4/10 Moderate 15% chance of damaging wind over 30 yrs
- Air quality 4/10 Moderate 3 unhealthy d/yr today · 6 by 30 yrs out
Nearby sold comps map
Loading sold comps map…
Walkable amenities ~0.75 mi
Loading nearby amenities…
Taxation est. · year 1
- Rental income
- $28,237
- − Mortgage interest
- −$13,998
- − Property taxes
- −$4,370
- − Insurance
- −$1,250
- − Repairs & maintenance
- −$2,259
- − Management
- −$2,259
- − Depreciation
- −$7,270
- Taxable loss
- −$3,169
- Est. tax savings @ 24.0%
- +$760
- After-tax cash flow
- $1,722/yr
For passive investors: Depreciation is non-cash, so a rental often shows a tax loss while cash-flowing — sheltering income. Rental losses are passive: they offset passive income freely, and up to $25,000/yr can offset ordinary (W-2) income if you actively participate and your MAGI is under $100k (phasing out to $0 by $150k); unused losses carry forward. On sale, claimed depreciation is recaptured at up to 25%, and gains may owe capital-gains tax (a 1031 exchange can defer both). Figures are a year-1 estimate at your 24.0% rate — not tax advice; consult a CPA.
Schools (NCES district)
- District
- Bethlehem Area SD
- NCES district ID
- 4203570
- Math proficiency
- 31% ▼ -2.00%
- Reading proficiency
- 49% ▼ -6.00%
- Median HH income
- $55,124
- Composite
- 34.92/100
- National rank
- #5068
- State rank
- #342 of 539 in PA
Livability — Bethlehem
- Score
- 82/100
- State rank
- #138
- US rank
- #1122
Category grades
Schools grade is shown separately in the Schools card above.
Census & demographics
- Census place
- Bethlehem, PA
- County
- Lehigh County · 333,019 people
- City population
- 129,661
- Metro
- Allentown-Bethlehem-Easton, PA-NJ
- Population (ZIP)
- 32,965
- Household income
- $75,417
- Rent vs Own
- Severe rent burden
- 1361.0
Population outlook (Lehigh County) Hauer SSP2
- Today (2025)
- 392,957 people
- By 2030
- 408,319 · +3.9%
- By 2040
- 440,007 · +12.0%
- By 2050
- 475,940 · +21.1%
- By 2075
- 590,448 · +50.3%
- By 2100
- 690,314 · +75.7%
Race, ethnicity, and origin ACS 2023
- Neighborhood character
- Majority White (65%)
- Race & ethnicity
- White 65% Hispanic / Latino 24% Two or more races 10% Black 6% Asian 2%
- Hispanic origin (detail)
- Mexican 2% Puerto Rican 14% Dominican 3%
- Common ancestry
- Romanian 4% Italian 2% Polish 2%
- Foreign-born
- 9% · Canada, Jamaica, China
- Languages at home
- 81% English-only · Spanish 15% Other Indo-European 2%
Political lean MEDSL · Lehigh
- 2024 margin
- Toss-up / Even · D 50.7% · R 48.0% · Other 1.2%
- 2008→2024 swing
- -12.9pp toward R · 2008: 15.6pp · 2024: 2.7pp
- All cycles
- 2024: D+2.7 2020: D+7.6 2016: D+4.4 2012: D+7.5 2008: D+15.6
Not yet ingested
- Civics
- —
Market trends
- HPI YoY
- ▼ -211.46%
- Current HPI
- 301.1699
- Rent YoY
- ▲ 0.85%
- Metro
- Allentown-Bethlehem-Easton, PA-NJ
- State GDP YoY
- ▲ 1.68%
- F500 in state
- 34
Industry mix (Fortune 500 HQ in PA)
| Industry | F500 HQs | Revenue |
|---|---|---|
| Healthcare | 2 | $309B |
|
||
| Insurance | 2 | $27B |
|
||
| Telecommunications / Media | 1 | $124B |
|
||
| Industrial Distribution | 1 | $22B |
|
||
| Financial Services | 1 | $20B |
|
||
| Chemicals / Materials | 1 | $18B |
|
||
Price history
+150.2% since first listed5 events — show timeline
- 2026-06-01 Price Changed $249,900 GLVRMLS
- 2026-05-05 Listed $270,000 GLVRMLS
- 2008-03-27 Sold (Public Records) $105,000 Public Records
- 2008-03-27 Sold (MLS) $105,000 GLVRMLS
- 2008-02-06 Listed $99,900 GLVRMLS
Property tax history
+1.6%/yrLatest (2026): $4,370 · +2.4% YoY. Source: county tax records.
Cash-flow waterfall
monthlySold comps — $/sqft
last 12 mo · ≤1 miLoading sold comps…