23500 Walden Center Dr #206 · Estero, FL
Flood risk 3/10 · Minor
- FEMA flood zone
- X (unshaded)
- Chance of flooding over 30 yrs
- 0.12%
- Est. flood insurance / yr
- $507 – $1,088
Fire risk 1/10 · Minimal
- Est. fire insurance / yr
- $947 – $1,759
Heat risk 10/10 · Severe
- Hot days now (above 107°F)
- 7 days/yr
- Hot days in 30 yrs
- 31 days/yr
Wind risk 10/10 · Severe
- Chance of severe wind over 30 yrs
- 99.0%
Air-quality risk 3/10 · Minor
- Unhealthy air days now
- 2 days/yr
- Unhealthy air days in 30 yrs
- 2 days/yr
Risk factors via First Street. Map © Google.
Why this score? — see what drove the D grade
The composite is a weighted blend of 9 inputs, each scored 0–100. Each bar is that input's sub-score; the figure is the points it added to the 100-point composite (weight × sub-score).
- Cash flow +11.8/30.0
- ARV discount +7.5/15.0
- 1% rule +4.6/10.0
- Schools +4.1/10.0
- Livability +4.0/5.0
- DSCR +3.5/10.0
- Rent growth +3.2/5.0
- Condition / age +2.5/5.0
- Appreciation +0.0/10.0
$195,000
🖨 Deal sheet (PDF) 📄 Offer letter ✓ Due diligence
Listing remarks
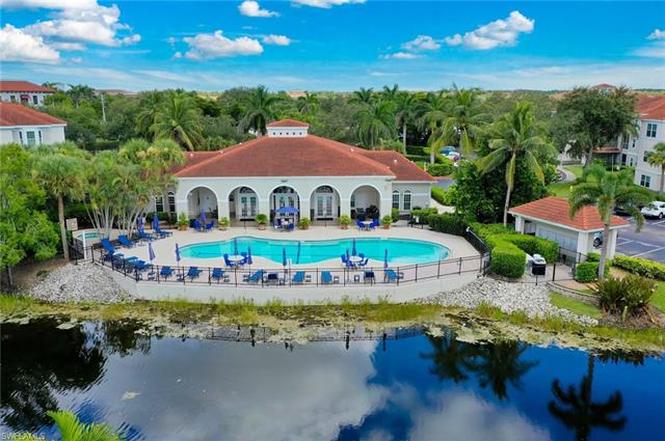
This move-in-ready, turnkey furnished one-bedroom, one-bath second-floor corner unit is located in the gated community of The Tides at Pelican Landing. The condo offers granite countertops in the kitchen and bath, updated flooring, and a bright, open layout that opens to a private patio with peaceful views—perfect for everyday living or relaxing after a long day. Residents enjoy access to a variety of amenities, including a community pool and spa, fitness center, and courts for tennis, pickleball, basketball, and sand volleyball. The community is in an ideal location, close to Coconut Point, Southwest Florida International Airport, pristine Gulf beaches, and a wide selection of restau
Key facts
- Sand volleyball
- Pickleball
- Tennis courts
Tags
Property features AI
Finance
- Other: Part of The Tides at Pelican Landing development; Zero lot line; Irrigation from lake/canal; Architectural and deeded restrictions
- HOA & community: Mandatory HOA (on-site management); Quarterly condo fee; Maintenance covers insurance, irrigation water, lawn/land maintenance, exterior pest control, reserves, and water; Community amenities include clubhouse, community pool, basketball, pickleball, BBQ/picnic area, and internet access; Gated community; Total annual recurring fees listed
Exterior
- Parking: Parking lot view
- Utilities: Central water; Central sewer; Cable available
- Home design: Residential low-rise building (1–3 stories); End-unit; Rear exposure faces east
- Construction: Concrete block and wood frame construction; Tile roof; Built in 1999
- Exterior features: Patio; Automatic sprinkler system; Stucco exterior; Impact resistant windows; Single-hung windows
Interior
- Kitchen: Dishwasher; Range; Refrigerator/Freezer
- Bedrooms: 1 bedroom
- Flooring: Vinyl
- Bathrooms: 1 full bathroom with combo tub and shower
- Heating & cooling: Central electric heat; Central electric cooling; Ceiling fans
- Interior features: Cable prewire; Fire sprinkler system; French doors; High-speed internet available; Dining area (family); Balcony; Screened lanai/porch; Turnkey furnished; Efficiency floor plan
- Laundry & utility: Washer/dryer hookup; Laundry in residence
Neighborhood map
What this means for you Summary
Snapshot
- This is a 1-bed/1.0-bath condo listed at $195k.
Deal economics
- At list price, monthly cash flow is $-55 ($-659/yr) — negative.
- To cash-flow at today's rent, offer at most $185k (5.0% below list).
- To meet the 1% rule (rent ≥ 1% of price), the offer needs to be $187k (3.9% below list).
- Recommended offer: $172k (12.0% below list) — sets the bar for market timing.
- Cap rate 6.0% vs local median 3.4% in Estero — top-decile yield for the area; either an underpriced asset or a hidden risk that comps aren't pricing in. Stress-test before assuming the spread holds.
Location & tenants
- Location reads 79/100 on livability (#149 in FL, #2,242 nationally) — a middle-class / working-renter tenant base. Strengths: crime A+, employment A+, housing A+; Watch: amenities F, commute F, cost of living D-.
- Lee (suburban): math 47% / reading 50% proficiency, ranked #42 of 73 in FL (top 58%) — families likely to look elsewhere, expect single-tenant / working-renter base with shorter leases.
- Zoned schools: Pinewoods Elementary School (math 81% / reading 74%, grade A, #163 of 2,144 statewide, top 8%, 1,089 students, 25% FRL); Lexington Middle School (math 55% / reading 54%, grade B-, #183 of 571 statewide, top 34%, 1,138 students, 44% FRL); South Fort Myers High School (math 23% / reading 30%, grade F, #489 of 667 statewide, top 74%, 1,917 students, 50% FRL) — zoned schools average 39% FRL vs 57% district-wide (18 pts lower); this property's tenant base skews higher-income than the district average.
- Market conditions: Rents rising (+2.9%/yr); 699 active listings in the ZIP; 9 comparable units currently listed for rent nearby; rentals at typical pace (median 21d on market — plan ~3-4 weeks tenant-placement turnaround); high-income renter base; 15,411 units permitted in Lee County in 2024 (4,686 in 5+ unit buildings).
- This rent is only 17% of the median local income ($131k/yr) — well below the 30% rent-burden line; pricing power to push rent on renewal without tenant pushback.
Forward outlook
- Local home prices are declining (-3.0%/yr); year-one equity from $1k of loan paydown is wiped out by about $6k of value loss. Plan a longer hold.
- Lee County population projected at +44% by 2050 — long-run rental-demand tailwind backs the buy-and-hold thesis.
Negotiation context
- It's been on market 298 days — a 12% lower offer ($172k) is reasonable based on typical stale-listing flexibility.
- 7 sale attempts since 3y ago; this cycle's ask is 12088% above the opening price — seller raised mid-cycle; expect resistance to lowballs.
Risks & watch-outs
- Climate carrying-cost: severe wind risk, 99% chance of damaging wind over 30y; extreme-heat days projected 7→31/yr by 2055 (HVAC capex compounding) — expect insurance premiums to compound above CPI over the hold.
Questions for the listing agent
- What do current leases actually rent for vs. the listed asking? Can we see a recent rent roll and the last 12 months of T-12 income?
- It's been on market 298 days. Have you received any prior offers? Is the seller open to a 12% concession, seller financing, or rate buy-down credit?
- What does the HOA fee cover, when was the last increase, and are there any pending special assessments or reserve-fund shortfalls?
- Any open or pending special assessments — roof, HVAC, plumbing, elevator, façade? What's the per-unit balance and payoff schedule, and is the seller paying it off at close or rolling it to the buyer?
- Why hasn't it sold? Are there any deal-killer items the seller is aware of (foundation, flood, title, zoning, code violations)?
- Is there a deadline driving the sale (1031 exchange, divorce, estate, relocation)? That informs how much negotiation room exists.
- Schools are A-rated — typically a magnet for longer-tenancy family renters. What's the average tenant stay here, and is there a school-zone premium baked into asking?
- The area grade is low — what's the realistic commute time and amenity access for the typical tenant pool here? Any planned neighborhood developments (good or bad) we should know about?
- What's the average days-on-market for RENTAL listings here right now (not sales)? A rising rental-DOM trend means longer vacancies and softer asking-rent achievability than the comps imply.
- What's the recent tenant-quality profile in this submarket — average credit score on applications, eviction rate, late-payment / NSF rate, and stable-employment percentage? A property-management company in the area should have these aggregated.
- How much new apartment / multifamily construction is in the pipeline within 1–3 miles? Heavy new supply (>2% of stock underway) typically softens rents 12–24 months out; light construction supports rent growth.
Investment metrics
- 1% rule
- 0.96% ✗
- Cap rate
- 5.96%
- Cash-on-cash
- -1.21%
- DSCR
- 0.95
- GRM
- 8.7
CMA / ARV
No comps found within radius.
Projected returns pro-forma
-3.0% appreciation · 2.85% rent growth · sell at horizon
- IRR
- -18.4%
- Equity multiple
- 0.35×
- Total profit
- $-35,234
- Equity at exit
- $29,075
- IRR
- -10.9%
- Equity multiple
- 0.35×
- Total profit
- $-35,756
- Equity at exit
- $16,860
Cash invested: $54,600 (down + closing). Projections, not guarantees.
Landlord ↔ Tenant lean methodology
- Overall (STATE)
- 87 Strongly Landlord-Friendly
- State Florida
- 87 Strongly Landlord-Friendly · R+3
- County
- — inherits STATE
- City
- — inherits STATE
ZIP-level market 34134
- Rents YoY
- 2.9%
- Active inventory
- 699
- Price-to-rent
- 8.7×
Monthly cashflow live
- Estimated rent
- $1,874 high interval (Pro) →
- Mortgage (P&I)
- −$1,023
- Tax from tax record
- −$151 /mo · $1,807/yr
- Insurance
- −$81
- HOA
- −$281
- Vacancy / Maint / Mgmt
- −$394
- Net cashflow
- $-55
Break-even live
Sensitivity live
| Price | -10% $55 | -5% $0 | +0% $-55 | +5% $-110 | +10% $-165 |
|---|---|---|---|---|---|
| Rent | -10% $-203 | -5% $-129 | +0% $-55 | +5% $19 | +10% $93 |
| Rate | -1.0pp $43 | -0.5pp $-5 | base $-55 | +0.5pp $-105 | +1.0pp $-157 |
UW: 25.0% down · 7.5% · 30yr · 1.5% tax · 5.0% vac · 8.0% maint · 8.0% mgmt
Financing live
Cash to close
- Down payment
- $48,750
- Closing costs
- $5,850
- Reserves months
- —
- Total cash needed
- —
Loan-product check · same deal, 3 products live
Conventional
25% down · 7.5% · 30yr
- Down + closing
- —
- Monthly P&I
- —
- Monthly cashflow
- —
- DSCR
- —
- Eligible?
- —
Personal DTI + credit; lowest rate.
DSCR
20% down · 8.5% · 30yr
- Down + closing
- —
- Monthly P&I
- —
- Monthly cashflow
- —
- DSCR
- —
- Eligible?
- —
No personal income docs; deal must DSCR.
Hard money
10% down · 12.0% · 12mo
- Down + closing
- —
- Monthly P&I
- —
- Monthly cashflow
- —
- DSCR
- —
- Eligible?
- —
Short-term bridge; refi at stabilization.
Rent comps 9 comps
| Address | Beds | Baths | Sqft | Rent | $/sqft | DOM | Units | Dist |
|---|---|---|---|---|---|---|---|---|
| 23500 Walden Center Dr Estero, FL | 1.0–2.0 | 1.0–2.0 | 803 | $1,500 | $1.87 | 17d | 3 | 0.01mi |
| 23660 Walden Center Dr Estero, FL | 1.0 | 1.0 | 649 | $1,522 | $2.34 | 16d | 1 | 0.06mi |
| 23660 Walden Center Dr Estero, FL | 1.0 | 1.0 | 557 | $1,498 | $2.69 | 23d | 1 | 0.06mi |
| 23540 Walden Center Dr #206 Estero, FL | 1.0 | 1.0 | 557 | $1,600 | $2.87 | 25d | 1 | 0.08mi |
| 23560 Walden Center Dr #207 Estero, FL | 1.0 | 1.0 | 557 | $1,475 | $2.65 | 5d | 1 | 0.13mi |
| 23580 Walden Center Dr #209 Estero, FL | 1.0 | 1.0 | 742 | $1,550 | $2.09 | 21d | 1 | 0.14mi |
| 22201 Fountain Lakes Blvd Estero, FL | 1.0–3.0 | 1.0–2.0 | 1000 | $1,299 | $1.30 | 25d | 1 | 1.10mi |
| 3100 Seasons Way Estero, FL | 1.0–2.0 | 1.0–2.0 | 842 | $1,300 | $1.54 | 5d | 4 | 1.38mi |
| 3100 Seasons Way Estero, FL | 1.0–2.0 | 1.0–2.0 | 842 | $1,339 | $1.59 | 20d | 4 | 1.38mi |
HOA detail condo
- Monthly dues
- $281 · $3,372/yr
- Likely covers
- poolgymsecurity
- Assessments
- None detected in remarks — confirm with the listing agent.
Listing history 27 events
-
2026-06-22days on market $195,000 Active 298 DOM
-
2026-06-17days on market $195,000 Active 294 DOM
-
2026-06-16days on market $195,000 Active 293 DOM
-
2026-06-16days on market $195,000 Active 292 DOM
-
2026-06-13days on market $195,000 Active 290 DOM
-
2026-06-09days on market $195,000 Active 286 DOM
-
2026-06-07days on market $195,000 Active 284 DOM
-
2026-06-02days on market $195,000 Active 279 DOM
-
2026-06-01days on market $195,000 Active 278 DOM
-
2026-06-01days on market $195,000 Active 277 DOM
-
2026-03-11$1,600
-
2026-02-25price $195,000
-
2025-10-02status Active
-
2025-08-25$200,000 Active
-
2025-07-04historical $1,775
-
2025-06-12$1,775
-
2024-09-30historical $1,750
-
2024-09-10price $1,750
-
2024-08-14price $1,775
-
2024-07-23$1,900
-
2024-06-01historical
-
2024-06-01historical
-
2023-11-14price $249,000
-
2023-11-14price $249,000
-
2023-09-19$270,000 Active
-
2023-09-19$270,000 Active
-
2004-09-30soldstatus $27,500,000
ⓘ Source: listings_history table (triggers on properties + properties_extension) + one-shot
backfill from property_details.listing_events for pre-trigger history.
Tax reassessment forecast FL · Resets to sale price
- Current annual tax
- $1,807 · $151/mo
- Projected year-2 tax
- $1,807 · $151/mo
- Expected delta
- $0/yr ($0/mo · 0.0%)
ⓘ Screening estimate from a state-policy table — verify with the county assessor before closing.
Climate risk First Street
- Flood 3/10 Moderate FEMA zone X (unshaded) · 12% chance over 30 yrs
- Wildfire 1/10 Low
- Heat 10/10 Extreme 7 d/yr ≥107°F today · 31 d/yr by 30 yrs out
- Wind 10/10 Extreme 99% chance of damaging wind over 30 yrs
- Air quality 3/10 Moderate 2 unhealthy d/yr today · 2 by 30 yrs out
Nearby sold comps map
Loading sold comps map…
Walkable amenities ~0.75 mi
Loading nearby amenities…
Taxation est. · year 1
- Rental income
- $22,490
- − Mortgage interest
- −$10,923
- − Property taxes
- −$1,807
- − Insurance
- −$975
- − Repairs & maintenance
- −$1,799
- − Management
- −$1,799
- − HOA
- −$3,372
- − Depreciation
- −$5,673
- Taxable loss
- −$3,859
- Est. tax savings @ 24.0%
- +$926
- After-tax cash flow
- $267/yr
For passive investors: Depreciation is non-cash, so a rental often shows a tax loss while cash-flowing — sheltering income. Rental losses are passive: they offset passive income freely, and up to $25,000/yr can offset ordinary (W-2) income if you actively participate and your MAGI is under $100k (phasing out to $0 by $150k); unused losses carry forward. On sale, claimed depreciation is recaptured at up to 25%, and gains may owe capital-gains tax (a 1031 exchange can defer both). Figures are a year-1 estimate at your 24.0% rate — not tax advice; consult a CPA.
Schools (NCES district)
- District
- Lee
- NCES district ID
- 1201080
- Math proficiency
- 47% ▼ -11.00%
- Reading proficiency
- 50% ▼ -4.00%
- Median HH income
- $49,518
- Composite
- 41.49/100
- National rank
- #3458
- State rank
- #42 of 73 in FL
Livability — Estero
- Score
- 79/100
- State rank
- #149
- US rank
- #2242
Category grades
Schools grade is shown separately in the Schools card above.
Census & demographics
- Census place
- Estero, FL
- County
- Lee County · 788,662 people
- City population
- 31,926
- Metro
- Cape Coral-Fort Myers, FL
- Population (ZIP)
- 16,475
- Household income
- $130,719
- Rent vs Own
- Severe rent burden
- 554.0
Population outlook (Lee County) Hauer SSP2
- Today (2025)
- 871,946 people
- By 2030
- 955,468 · +9.6%
- By 2040
- 1,113,587 · +27.7%
- By 2050
- 1,256,891 · +44.1%
- By 2075
- 1,560,270 · +78.9%
- By 2100
- 1,726,848 · +98.0%
Race, ethnicity, and origin ACS 2023
- Neighborhood character
- Predominantly White (91%)
- Race & ethnicity
- White 91% Hispanic / Latino 5% Two or more races 3% Asian 1%
- Common ancestry
- Slovak 5% Romanian 4% Serbian 2%
- Foreign-born
- 10% · Canada, Jamaica
- Languages at home
- 91% English-only · Spanish 4% German/W. Germanic 1% Other Indo-European 1%
Political lean MEDSL · Lee
- 2024 margin
- Strong R (+28.4) · D 35.5% · R 63.9%
- 2008→2024 swing
- -18.0pp toward R · 2008: -10.4pp · 2024: -28.4pp
- All cycles
- 2024: R+28.4 2020: R+19.2 2016: R+20.4 2012: R+16.6 2008: R+10.4
Not yet ingested
- Civics
- —
Market trends
- HPI YoY
- ▼ -236.48%
- Current HPI
- 237.4416
- Rent YoY
- ▲ 2.85%
- Metro
- Cape Coral-Fort Myers, FL
- State GDP YoY
- ▲ 3.28%
- F500 in state
- 36
Industry mix (Fortune 500 HQ in FL)
| Industry | F500 HQs | Revenue |
|---|---|---|
| Industrial Technology | 2 | $29B |
|
||
| Insurance | 2 | $17B |
|
||
| Retail | 1 | $60B |
|
||
| Technology Distribution | 1 | $58B |
|
||
| Homebuilding | 1 | $35B |
|
||
| Technology Manufacturing | 1 | $35B |
|
||
Price history
-100.0% since first listed17 events — show timeline
- 2026-03-11 Listed for Rent $1,600 FGCMLS
- 2026-02-25 Price Changed $195,000 BEARMLS
- 2025-10-02 Relisted — BEARMLS
- 2025-08-25 Listed $200,000 BEARMLS
- 2025-07-04 Rental Removed $1,775 NAPLESMLS
- 2025-06-12 Listed for Rent $1,775 NAPLESMLS
- 2024-09-30 Rental Removed $1,750 NAPLESMLS
- 2024-09-10 Price Changed $1,750 NAPLESMLS
- 2024-08-14 Price Changed $1,775 NAPLESMLS
- 2024-07-23 Listed for Rent $1,900 NAPLESMLS
- 2024-06-01 Listing Removed — Stellar MLS as Distributed by MLS Grid
- 2024-06-01 Listing Removed — FORTMLS
- 2023-11-14 Price Changed $249,000 FORTMLS
- 2023-11-14 Price Changed $249,000 Stellar MLS as Distributed by MLS Grid
- 2023-09-19 Listed $270,000 Stellar MLS as Distributed by MLS Grid
- 2023-09-19 Listed $270,000 FORTMLS
- 2004-09-30 Sold (Public Records) $27,500,000 Public Records
Property tax history
+4.0%/yrLatest (2025): $1,807 · -5.6% YoY. Source: county tax records.
Cash-flow waterfall
monthlySold comps — $/sqft
last 12 mo · ≤1 miLoading sold comps…