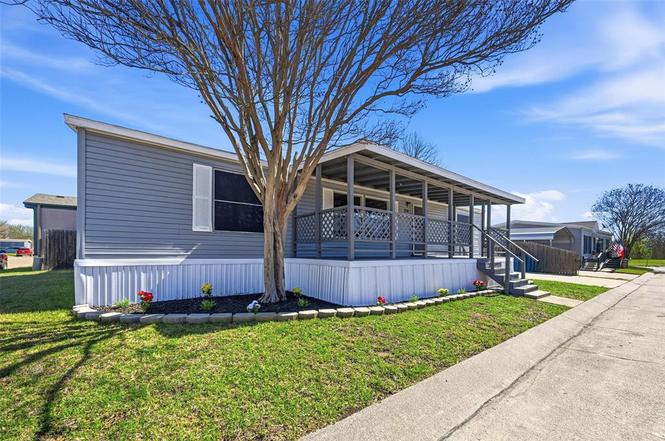
714 Parkview Dr · Forney, TX
Flood risk 1/10 · Minimal
- FEMA flood zone
- X (unshaded)
- Chance of flooding over 30 yrs
- 0.0%
- Est. flood insurance / yr
- $507 – $1,088
Fire risk 4/10 · Minor
- Est. fire insurance / yr
- $1,222 – $2,270
Heat risk 7/10 · Major
- Hot days now (above 110°F)
- 7 days/yr
- Hot days in 30 yrs
- 23 days/yr
Wind risk 6/10 · Moderate
- Chance of severe wind over 30 yrs
- 27.0%
Air-quality risk 2/10 · Minimal
- Unhealthy air days now
- 1 days/yr
- Unhealthy air days in 30 yrs
- 1 days/yr
Risk factors via First Street. Map © Google.
Why this score? — see what drove the B grade
The composite is a weighted blend of 9 inputs, each scored 0–100. Each bar is that input's sub-score; the figure is the points it added to the 100-point composite (weight × sub-score).
- Cash flow +29.0/30.0
- ARV discount +15.0/15.0
- DSCR +10.0/10.0
- 1% rule +7.7/10.0
- Schools +4.0/10.0
- Livability +3.8/5.0
- Rent growth +2.9/5.0
- Condition / age +2.5/5.0
- Appreciation +0.0/10.0
$159,900
🖨 Deal sheet 📄 Offer letter ✓ Due diligence
Listing remarks
Freshly updated and ready for its new owner! This 3-bedroom, 2-bath mobile home in Forney has been recently refreshed with improvements that make it move-in ready while still offering comfortable living space and a functional layout. The home features generous living areas, a practical floor plan, and updates that give it a clean, welcoming feel throughout. Whether you're a first-time buyer looking for an affordable home or an investor seeking a solid rental opportunity, this property offers both value and flexibility. Located in the growing Forney area with convenient access to nearby amenities, this home provides a great opportunity to own a refreshed property at an approachable price poi
Key facts
- Convenient access
- Refreshed property
- 4,487 sq ft lot
Tags
Property features AI
Finance
- Financial info: Accepts Cash, Conventional, FHA, and VA financing
- HOA & community: No homeowner association
Exterior
- Parking: Driveway
- Utilities: City water; City sewer; Electricity connected; Individual water meter; Not in a municipal utility district
- Home design: Single-family residence; Single story; Accessible approach with ramp and accessible grip
- Construction: Built in 1994; Preowned condition
- Exterior features: Fenced yard (wood); Storage structure; Corner lot
Interior
- Kitchen: Electric cooktop; Electric oven; Electric range
- Bedrooms: 3 bedrooms (all on the main level)
- Flooring: Combination flooring
- Bathrooms: 2 full bathrooms (main level)
- Heating & cooling: Central heating (electric); Central air conditioning (electric)
- Interior features: High-speed internet available; 9 total rooms; One living area; One dining area; One level (single story)
- Laundry & utility: Electric water heater; Utility room on the main level
Neighborhood map
What this means for you Summary
Snapshot
- This is a 3-bed/2.0-bath single-family listed at $160k.
Deal economics
- At list price, monthly cash flow is $545 ($7k/yr) — positive.
- The deal already cash-flows at list — no discount required.
- Meets the 1% rule at list price ($2k rent vs $160k).
- Recommended offer: $155k (3.0% below list) — sets the bar for market timing.
- Cap rate 10.4% vs local median 4.1% in Forney — top-decile yield for the area; either an underpriced asset or a hidden risk that comps aren't pricing in. Stress-test before assuming the spread holds.
Location & tenants
- Location reads 76/100 on livability (#98 in TX, #3,339 nationally) — a middle-class / working-renter tenant base. Strengths: crime A+, employment A+, cost of living A+; Watch: amenities C-, commute F.
- Forney ISD (rural): math 41% / reading 44% proficiency, ranked #234 of 826 in TX (top 28%) — families likely to look elsewhere, expect single-tenant / working-renter base with shorter leases.
- Zoned schools: Claybon El (math 55% / reading 58%, grade C+, #559 of 4,322 statewide, top 13%, 575 students, 35% FRL).
- Zoned-school proficiency averages 56% at this address vs 42% district-wide (+14 pts) — the actual schools serving this property are materially stronger than the Forney ISD average implies; a family-tenant draw the district grade alone would hide.
- Market conditions: Rents rising (+1.4%/yr); 2179 active listings in the ZIP; 40 comparable units currently listed for rent nearby; rentals at typical pace (median 15d on market — plan ~3-4 weeks tenant-placement turnaround); solid renter incomes; 1,747 units permitted in Kaufman County in 2024 (180 in 5+ unit buildings).
Forward outlook
- Local home prices are declining (-3.0%/yr); year-one equity from $1k of loan paydown is wiped out by about $5k of value loss. Plan a longer hold.
- Kaufman County population projected at +43% by 2050 — long-run rental-demand tailwind backs the buy-and-hold thesis.
- At projected returns (-3.0% appreciation + 1.4% rent growth), your $45k cash investment doubles in ~10 years — after that, you're playing with house money.
Negotiation context
- It's been on market 56 days — a 3% lower offer ($155k) is reasonable based on typical stale-listing flexibility.
- 2 sale attempts; this cycle's ask has dropped $15k (9%) from the opening price — seller is motivated, your offer sets the floor, not the list.
Risks & watch-outs
- Climate carrying-cost: major wind risk, 27% chance of damaging wind over 30y; extreme-heat days projected 7→23/yr by 2055 (HVAC capex compounding) — expect insurance premiums to compound above CPI over the hold.
Questions for the listing agent
- It's been on market 56 days. Have you received any prior offers? Is the seller open to a 3% concession, seller financing, or rate buy-down credit?
- Is there a deadline driving the sale (1031 exchange, divorce, estate, relocation)? That informs how much negotiation room exists.
- Schools are B-rated — typically a magnet for longer-tenancy family renters. What's the average tenant stay here, and is there a school-zone premium baked into asking?
- What's the average days-on-market for RENTAL listings here right now (not sales)? A rising rental-DOM trend means longer vacancies and softer asking-rent achievability than the comps imply.
- What's the recent tenant-quality profile in this submarket — average credit score on applications, eviction rate, late-payment / NSF rate, and stable-employment percentage? A property-management company in the area should have these aggregated.
- How much new for-sale + rental construction is in the pipeline within 1–3 miles? Heavy new supply typically softens prices + rents 12–24 months out; constrained supply supports both.
Investment metrics
- 1% rule
- 1.27% ✓
- Cap rate
- 10.38%
- Cash-on-cash
- 14.61%
- DSCR
- 1.65
- GRM
- 6.6
CMA / ARV
- ARV (on-the-fly)
- $262,080
- Comps found
- 12
Show comp detail 12 sales within ~0.75 mi
| Address | Dist | Beds/Ba | Sqft | Sold | Price | $/sf | Match |
|---|---|---|---|---|---|---|---|
| 714 Parkview Dr | 0.00mi | 3/2.0 | 1,344 (0%) | 1mo | $159,900 | $119 | 99 |
| 620 Park Creek Ave | 0.03mi | 3/2.0 | 1,216 (-10%) | 1mo | $120,000 | $99 | 82 |
| 1438 Merlin Buff St | 0.25mi | 3/2.0 | 1,302 (-3%) | 3mo | $234,999 | $180 | 81 |
| 1432 Merlin Buff St | 0.25mi | 3/2.0 | 1,302 (-3%) | 6mo | $243,699 | $187 | 78 |
| 207 Cornell Dr | 0.55mi | 3/2.0 | 1,356 (+1%) | 1mo | $264,900 | $195 | 72 |
| 102 Marquette St | 0.64mi | 3/2.0 | 1,388 (+3%) | 7mo | $274,999 | $198 | 58 |
| 104 Marquette St | 0.63mi | 3/2.0 | 1,317 (-2%) | 12mo | $275,000 | $209 | 57 |
| 124 Stanford | 0.54mi | 3/2.0 | 1,488 (+11%) | 4mo | $235,000 | $158 | 54 |
| 214 Centenary Dr | 0.56mi | 3/2.0 | 1,408 (+5%) | 15mo | $265,000 | $188 | 54 |
| 105 Windsor Dr | 0.56mi | 3/2.0 | 1,214 (-10%) | 10mo | $274,900 | $226 | 50 |
| 210 S Chestnut St | 0.67mi | 3/2.0 | 1,241 (-8%) | 9mo | $249,900 | $201 | 49 |
| 401 E Church St | 0.70mi | 3/2.0 | 1,530 (+14%) | 2mo | $315,000 | $206 | 43 |
Match score weights: distance 35% · size 25% · config 20% · recency 20%. Top-matched comps best support the ARV.
Projected returns pro-forma
-3.0% appreciation · 1.42% rent growth · sell at horizon
- IRR
- 3.3%
- Equity multiple
- 1.13×
- Total profit
- $5,631
- Equity at exit
- $23,842
- IRR
- 11.3%
- Equity multiple
- 1.83×
- Total profit
- $36,985
- Equity at exit
- $13,825
Cash invested: $44,772 (down + closing). Projections, not guarantees.
Landlord ↔ Tenant lean methodology
- Overall (STATE)
- 87 Strongly Landlord-Friendly
- State Texas
- 87 Strongly Landlord-Friendly · R+5
- County
- — inherits STATE
- City
- — inherits STATE
ZIP-level market 75126
- Rents YoY
- 1.4%
- Active inventory
- 2179
- Price-to-rent
- 6.6×
Monthly cashflow live
- Estimated rent
- $2,030 high interval (Pro) →
- Mortgage (P&I)
- −$839
- Tax from tax record
- −$154 /mo · $1,844/yr
- Insurance
- −$67
- HOA
- −$0
- Vacancy / Maint / Mgmt
- −$426
- Net cashflow
- $545
Break-even live
UW: 25.0% down · 7.5% · 30yr · 1.5% tax · 5.0% vac · 8.0% maint · 8.0% mgmt
Financing live
Cash to close
- Down payment
- $39,975
- Closing costs
- $4,797
- Reserves months
- —
- Total cash needed
- —
Loan-product check · same deal, 3 products live
Conventional
25% down · 7.5% · 30yr
- Down + closing
- —
- Monthly P&I
- —
- Monthly cashflow
- —
- DSCR
- —
- Eligible?
- —
Personal DTI + credit; lowest rate.
DSCR
20% down · 8.5% · 30yr
- Down + closing
- —
- Monthly P&I
- —
- Monthly cashflow
- —
- DSCR
- —
- Eligible?
- —
No personal income docs; deal must DSCR.
Hard money
10% down · 12.0% · 12mo
- Down + closing
- —
- Monthly P&I
- —
- Monthly cashflow
- —
- DSCR
- —
- Eligible?
- —
Short-term bridge; refi at stabilization.
Rent comps 40 comps
| Address | Beds | Baths | Sqft | Rent | $/sqft | DOM | Units | Dist |
|---|---|---|---|---|---|---|---|---|
| 404 Oak St Unit 1 Forney, TX | 2.0 | 2.0 | 1000 | $1,349 | $1.35 | 1d | 1 | 0.36mi |
| 300 Stanford Forney, TX | 3.0 | 2.0 | 1714 | $1,999 | $1.17 | 2d | 1 | 0.50mi |
| 201 Wildwood Blvd Forney, TX | 1.0–2.0 | 1.0–2.0 | 964 | $1,955 | $2.03 | 1d | 42 | 0.54mi |
| 124 Stanford Forney, TX | 3.0 | 2.0 | 1488 | $1,800 | $1.21 | 7d | 1 | 0.54mi |
| 300 Trailhouse Ln Forney, TX | 1.0–3.0 | 1.0–2.0 | 1041 | $2,115 | $2.03 | 1d | 40 | 0.58mi |
| 517 Burgett St Forney, TX | 3.0 | 2.0 | 1280 | $1,695 | $1.32 | 2d | 1 | 0.60mi |
| 304 Burgett St Forney, TX | 3.0 | 2.0 | 1417 | $1,595 | $1.13 | 43d | 1 | 0.64mi |
| 102 Galloping Trl Forney, TX | 3.0 | 2.0 | 1663 | $1,999 | $1.20 | 7d | 1 | 0.71mi |
| 113 Galloping Trl Forney, TX | 3.0 | 2.0 | 1482 | $1,769 | $1.19 | 16d | 1 | 0.74mi |
| 121 Princeton Cir Forney, TX | 3.0 | 2.0 | 1604 | $2,095 | $1.31 | 11d | 1 | 0.79mi |
| 407 S Bois D Arc St Forney, TX | 3.0 | 1.5 | 1008 | $1,500 | $1.49 | 43d | 1 | 0.82mi |
| 321 S Chestnut St Forney, TX | 4.0 | 2.0 | 1831 | $2,150 | $1.17 | 24d | 1 | 0.83mi |
| 308 Southlake Dr Forney, TX | 3.0 | 2.0 | 1491 | $1,965 | $1.32 | 2d | 1 | 0.86mi |
| 905 Royal St Forney, TX | 3.0 | 1.5 | 1250 | $1,750 | $1.40 | 43d | 1 | 0.91mi |
| 920 Royal St Forney, TX | 3.0 | 2.0 | 1296 | $1,870 | $1.44 | 3d | 1 | 0.92mi |
| 611 Orchard Ln Forney, TX | 4.0 | 2.0 | 1540 | $2,000 | $1.30 | 22d | 1 | 0.94mi |
| 110 Meadow Ct Forney, TX | 3.0 | 2.0 | 1840 | $1,795 | $0.98 | 12d | 1 | 0.95mi |
| 236 Pennridge Dr Forney, TX | 3.0 | 2.0 | 1871 | $2,295 | $1.23 | 24d | 1 | 0.97mi |
| 603 Woodcrest Way Forney, TX | 3.0 | 2.0 | 1234 | $1,805 | $1.46 | 24d | 1 | 0.99mi |
| 415 Southlake Dr Forney, TX | 3.0 | 2.0 | 1283 | $1,913 | $1.49 | 6d | 1 | 1.00mi |
| 415 Southlake Dr Forney, TX | 3.0 | 2.0 | 1283 | $1,723 | $1.34 | 43d | 1 | 1.00mi |
| 2201 Woodberry Dr Forney, TX | 3.0 | 2.0 | 1839 | $2,050 | $1.11 | 43d | 1 | 1.02mi |
| 2105 Cardinal Dr Forney, TX | 4.0 | 2.0 | 1763 | $2,200 | $1.25 | 22d | 1 | 1.04mi |
| 404 Woodcrest Way Forney, TX | 3.0 | 2.0 | 1434 | $1,900 | $1.32 | 43d | 1 | 1.05mi |
| 511 Brazos St Forney, TX | 3.0 | 2.0 | 1570 | $1,945 | $1.24 | 7d | 1 | 1.06mi |
| 416 Woodcrest Way Forney, TX | 3.0 | 2.0 | 1379 | $1,950 | $1.41 | 20d | 1 | 1.11mi |
| 416 Forestwood Dr Forney, TX | 3.0 | 2.0 | 1267 | $1,799 | $1.42 | 2d | 1 | 1.13mi |
| 907 Alpine St Forney, TX | 3.0 | 2.0 | 1300 | $1,810 | $1.39 | 43d | 1 | 1.14mi |
| 509 Southlake Dr Forney, TX | 3.0 | 2.0 | 1157 | $2,299 | $1.99 | 12d | 1 | 1.14mi |
| 105 Fieldwood Ct Forney, TX | 3.0 | 2.0 | 1820 | $2,400 | $1.32 | 20d | 1 | 1.16mi |
| 413 Redbud Dr Unit NA Forney, TX | 3.0 | 2.0 | 1671 | $2,200 | $1.32 | 43d | 1 | 1.17mi |
| 413 Driftwood Ct Forney, TX | 3.0 | 2.0 | 1733 | $1,999 | $1.15 | 10d | 1 | 1.24mi |
| 413 Driftwood Ct Forney, TX | 3.0 | 2.0 | 1733 | $2,000 | $1.15 | 15d | 1 | 1.24mi |
| 604 Carl C Senter St Forney, TX | 3.0 | 2.0 | 1314 | $2,300 | $1.75 | 1d | 1 | 1.28mi |
| 308 Chinaberry Trl Forney, TX | 3.0 | 2.0 | 1772 | $1,950 | $1.10 | 43d | 1 | 1.31mi |
| 616 Carl C Senter St Forney, TX | 4.0 | 2.0 | 1507 | $1,950 | $1.29 | 43d | 1 | 1.32mi |
| 105 Independence Trl Forney, TX | 3.0 | 2.0 | 1608 | $1,900 | $1.18 | 7d | 1 | 1.39mi |
| 213 Independence Trl Forney, TX | 3.0 | 2.0 | 1487 | $1,900 | $1.28 | 43d | 1 | 1.43mi |
| 1100 N Gateway Blvd Forney, TX | 1.0–2.0 | 1.0–2.0 | 892 | $1,819 | $2.04 | 1d | 29 | 1.46mi |
| 224 Independence Trl Forney, TX | 3.0 | 2.0 | 1562 | $2,145 | $1.37 | 7d | 1 | 1.49mi |
Listing history 11 events
-
2026-05-08status Pending
-
2026-04-28historical Active Option Contract
-
2026-04-21price $159,900
-
2026-03-26price $169,000
-
2026-03-13$175,000 Active
-
2026-02-02historical
-
2026-01-23price $122,500
-
2026-01-09$125,000 Active
-
2025-11-20soldstatus
-
2022-03-01soldstatus
-
1996-11-08soldstatus
ⓘ Source: listings_history table (triggers on properties + properties_extension) + one-shot
backfill from property_details.listing_events for pre-trigger history.
Tax reassessment forecast TX · Resets to sale price
- Current annual tax
- $1,844 · $154/mo
- Projected year-2 tax
- $2,926 · $244/mo
- Expected delta
- +$1,082/yr (+$90/mo · 58.7%)
ⓘ Screening estimate from a state-policy table — verify with the county assessor before closing.
Climate risk First Street
- Flood 1/10 Low FEMA zone X (unshaded) · 0% chance over 30 yrs
- Wildfire 4/10 Moderate
- Heat 7/10 Severe 7 d/yr ≥110°F today · 23 d/yr by 30 yrs out
- Wind 6/10 Major 27% chance of damaging wind over 30 yrs
- Air quality 2/10 Low 1 unhealthy d/yr today · 1 by 30 yrs out
Nearby sold comps map
Loading sold comps map…
Walkable amenities ~0.75 mi
Loading nearby amenities…
Taxation est. · year 1
- Rental income
- $24,364
- − Mortgage interest
- −$8,957
- − Property taxes
- −$1,844
- − Insurance
- −$800
- − Repairs & maintenance
- −$1,949
- − Management
- −$1,949
- − Depreciation
- −$4,652
- Taxable income
- $4,213
- Est. tax owed @ 24.0%
- −$1,011
- After-tax cash flow
- $5,530/yr
For passive investors: Depreciation is non-cash, so a rental often shows a tax loss while cash-flowing — sheltering income. Rental losses are passive: they offset passive income freely, and up to $25,000/yr can offset ordinary (W-2) income if you actively participate and your MAGI is under $100k (phasing out to $0 by $150k); unused losses carry forward. On sale, claimed depreciation is recaptured at up to 25%, and gains may owe capital-gains tax (a 1031 exchange can defer both). Figures are a year-1 estimate at your 24.0% rate — not tax advice; consult a CPA.
Schools (NCES district)
- District
- Forney ISD
- NCES district ID
- 4819560
- Math proficiency
- 41% ▼ -20.00%
- Reading proficiency
- 44% ▼ -12.00%
- Median HH income
- $86,679
- Composite
- 40.07/100
- National rank
- #3812
- State rank
- #234 of 826 in TX
Livability — Forney
- Score
- 76/100
- State rank
- #98
- US rank
- #3339
Category grades
Schools grade is shown separately in the Schools card above.
Census & demographics
- Census place
- Forney, TX
- County
- Kaufman County · 122,338 people
- City population
- 84,799
- Metro
- Dallas-Fort Worth-Arlington, TX
- Population (ZIP)
- 84,799
- Household income
- $103,673
- Rent vs Own
- Severe rent burden
- 1306.0
Population outlook (Kaufman County) Hauer SSP2
- Today (2025)
- 138,716 people
- By 2030
- 150,815 · +8.7%
- By 2040
- 174,877 · +26.1%
- By 2050
- 198,020 · +42.8%
- By 2075
- 251,908 · +81.6%
- By 2100
- 285,325 · +105.7%
Race, ethnicity, and origin ACS 2023
- Neighborhood character
- Diverse neighborhood (Simpson 0.68)
- Race & ethnicity
- White 45% Black 25% Hispanic / Latino 23% Two or more races 14% Asian 3%
- Hispanic origin (detail)
- Mexican 18% Puerto Rican 1%
- Common ancestry
- Italian 2% Slovak 1% Portuguese 1%
- Foreign-born
- 12% · Canada, Vietnam
- Languages at home
- 79% English-only · Spanish 14% Arabic 1% Vietnamese 1%
Political lean MEDSL · Kaufman
- 2024 margin
- Strong R (+27.9) · D 35.6% · R 63.5%
- 2008→2024 swing
- +7.9pp toward D · 2008: -35.8pp · 2024: -27.9pp
- All cycles
- 2024: R+27.9 2020: R+33.9 2016: R+47.0 2012: R+44.4 2008: R+35.8
Not yet ingested
- Civics
- —
Market trends
- HPI YoY
- ▼ -102.93%
- Current HPI
- 148.5749
- Rent YoY
- ▲ 1.42%
- Metro
- Dallas-Fort Worth-Arlington, TX
- State GDP YoY
- ▲ 3.95%
- F500 in state
- 110
Industry mix (Fortune 500 HQ in TX)
| Industry | F500 HQs | Revenue |
|---|---|---|
| Energy | 16 | $1,198B |
|
||
| Technology | 5 | $198B |
|
||
| Engineering / Construction | 4 | $72B |
|
||
| Energy Services | 3 | $60B |
|
||
| Utilities | 3 | $41B |
|
||
| Healthcare | 2 | $330B |
|
||
Price history
+27.9% since first listed11 events — show timeline
- 2026-05-08 Pending — NTREIS
- 2026-04-28 Contingent — NTREIS
- 2026-04-21 Price Changed $159,900 NTREIS
- 2026-03-26 Price Changed $169,000 NTREIS
- 2026-03-13 Listed $175,000 NTREIS
- 2026-02-02 Listing Removed — NTREIS
- 2026-01-23 Price Changed $122,500 NTREIS
- 2026-01-09 Listed $125,000 NTREIS
- 2025-11-20 Sold (Public Records) — Public Records
- 2022-03-01 Sold (Public Records) — Public Records
- 1996-11-08 Sold (Public Records) — Public Records
Property tax history
+10.6%/yrLatest (2025): $1,844 · +10.8% YoY. Source: county tax records.
Cash-flow waterfall
monthlySold comps — $/sqft
last 12 mo · ≤1 miLoading sold comps…