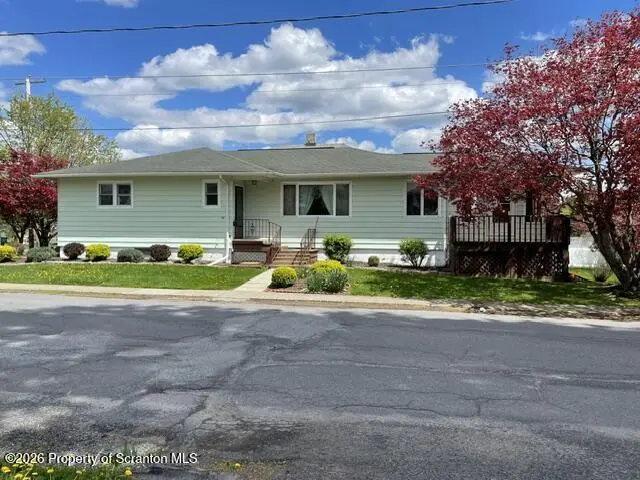
101 Orchard St · Moscow, PA
Flood risk 1/10 · Minimal
- FEMA flood zone
- X (unshaded)
- Chance of flooding over 30 yrs
- 0.0%
- Est. flood insurance / yr
- $473 – $860
Fire risk 1/10 · Minimal
- Est. fire insurance / yr
- $511 – $949
Heat risk 2/10 · Minimal
- Hot days now (above 89°F)
- 7 days/yr
- Hot days in 30 yrs
- 17 days/yr
Wind risk 3/10 · Minor
- Chance of severe wind over 30 yrs
- 4.0%
Air-quality risk 2/10 · Minimal
- Unhealthy air days now
- 1 days/yr
- Unhealthy air days in 30 yrs
- 2 days/yr
Risk factors via First Street. Map © Google.
Why this score? — see what drove the D grade
The composite is a weighted blend of 9 inputs, each scored 0–100. Each bar is that input's sub-score; the figure is the points it added to the 100-point composite (weight × sub-score).
- Appreciation +10.0/10.0
- ARV discount +8.9/15.0
- Cash flow +6.7/30.0
- Schools +5.0/10.0
- Livability +3.9/5.0
- Rent growth +2.5/5.0
- Condition / age +2.5/5.0
- 1% rule +1.7/10.0
- DSCR +0.9/10.0
$279,000
🖨 Deal sheet (PDF) 📄 Offer letter ✓ Due diligence
Listing remarks
One level living with 3 bedrooms, 1.5 baths, first floor laundry, all appliances included, hardwood floors in most rooms, heated sunroom, walk up attic, built-in basement garage , cedar closets, landscaped corner lot i the heart of the community.
Key facts
- Heated sunroom
- Walk up attic
- Cedar closets
Tags
Property features AI
Exterior
- Parking: Attached or detached 1-car garage; Oversized garage; Driveway parking; 2 off-street/open parking spaces
- Utilities: Public water; Public sewer; 100 amp electric service; Electricity connected; Cable available; Phone available
- Home design: Single family house; One level; Built in 1954
- Construction: Aluminum siding; Shingle roof; Block foundation
- Exterior features: Deck; Rain gutters; Corner lot, level; Public maintained asphalt city street frontage
Interior
- Kitchen: Breakfast bar; Range / Electric range; Refrigerator; Dishwasher
- Bedrooms: 3 bedrooms (one bedroom leads to walk-up attic)
- Flooring: Hardwood; Carpet; Linoleum; Ceramic tile in primary bathroom
- Bathrooms: 1 full bathroom; 1 half bathroom (powder room)
- Heating & cooling: Baseboard heating (oil); Ceiling fan(s)
- Interior features: Breakfast bar; Storm door(s); Attic with storage and walk-up access; Full basement partially finished
- Laundry & utility: Washer; Dryer; Laundry closet
Neighborhood map
What this means for you Summary
Snapshot
- This is a 3-bed/1.5-bath single-family listed at $279k.
Deal economics
- At list price, monthly cash flow is $-450 ($-5k/yr) — negative.
- To cash-flow at today's rent, offer at most $214k (23.3% below list).
- To meet the 1% rule (rent ≥ 1% of price), the offer needs to be $187k (32.9% below list).
- Recommended offer: $187k (32.9% below list) — sets the bar for 1% rule.
Location & tenants
- Location reads 78/100 on livability (#298 in PA, #2,633 nationally) — a middle-class / working-renter tenant base. Strengths: crime A+, cost of living A+, housing A+; Watch: amenities F, commute F.
- North Pocono SD (rural): math 45% / reading 71% proficiency, ranked #82 of 539 in PA (top 15%) — acceptable for families but not a draw, mixed tenant base, ~2y average lease.
- Zoned schools: Moscow El Sch (math 62% / reading 82%, grade A-, #123 of 1,518 statewide, top 9%, 591 students, 43% FRL); North Pocono Ms (math 25% / reading 69%, grade D+, #163 of 512 statewide, top 33%, 665 students, 36% FRL); North Pocono Hs (math 72%, 905 students, 33% FRL).
- Market conditions: 97 active listings in the ZIP; 251 units permitted in Lackawanna County in 2024 (0 in 5+ unit buildings).
Forward outlook
- In year one you build about $30k of equity ($2k loan paydown + $28k appreciation (10.0% local appreciation)).
- Lackawanna County population projected to shrink 4% by 2050 — rents likely to lag national; underwrite the cash flow, not the appreciation.
- By year 2, paydown + projected appreciation supports a ~$48k cash-out refi (75% LTV) — recoverable capital for the next deal without selling this one.
Negotiation context
- Only 3 days on market — expect competitive offers; lowballing is unlikely to land.
Risks & watch-outs
- Watch-outs: built in 1954 — expect roof / HVAC / electrical / plumbing capex.
Questions for the listing agent
- What do current leases actually rent for vs. the listed asking? Can we see a recent rent roll and the last 12 months of T-12 income?
- Built in 1954 — when were the roof, HVAC, electrical panel, plumbing, and water heater last replaced?
- Is there a deadline driving the sale (1031 exchange, divorce, estate, relocation)? That informs how much negotiation room exists.
- Schools are A-rated — typically a magnet for longer-tenancy family renters. What's the average tenant stay here, and is there a school-zone premium baked into asking?
- The area grade is low — what's the realistic commute time and amenity access for the typical tenant pool here? Any planned neighborhood developments (good or bad) we should know about?
- What's the average days-on-market for RENTAL listings here right now (not sales)? A rising rental-DOM trend means longer vacancies and softer asking-rent achievability than the comps imply.
- What's the recent tenant-quality profile in this submarket — average credit score on applications, eviction rate, late-payment / NSF rate, and stable-employment percentage? A property-management company in the area should have these aggregated.
- How much new for-sale + rental construction is in the pipeline within 1–3 miles? Heavy new supply typically softens prices + rents 12–24 months out; constrained supply supports both.
Investment metrics
- 1% rule
- 0.67% ✗
- Cap rate
- 4.36%
- Cash-on-cash
- -6.91%
- DSCR
- 0.69
- GRM
- 12.4
CMA / ARV
- ARV (median comp)
- $287,652
- List price
- $279,000
- Delta
- -3.01%
- Verdict
- FAIR
- Comps
- 20 within 1.0 mi
Show comp detail 6 sales within ~0.75 mi
| Address | Dist | Beds/Ba | Sqft | Sold | Price | $/sf | Match |
|---|---|---|---|---|---|---|---|
| 101 Orchard St | 0.00mi | 3/1.5 | 2,010 (0%) | 1mo | $264,000 | $131 | 100 |
| 708 Pin Oak Pl | 0.51mi | 3/2.0 | 2,010 (0%) | 1mo | $545,000 | $271 | 74 |
| 216 Maple St | 0.22mi | 4/1.0 (+1) | 1,896 (-6%) | 6mo | $237,400 | $125 | 68 |
| 618 Beech St | 0.22mi | 3/2.0 | 2,160 (+8%) | 13mo | $299,900 | $139 | 65 |
| 206 Gardner St | 0.18mi | 4/3.0 (+1) | 2,309 (+15%) | 16mo | $275,000 | $119 | 43 |
| 203 Julia St | 0.70mi | 3/2.0 | 1,846 (-8%) | 14mo | $340,000 | $184 | 40 |
Match score weights: distance 35% · size 25% · config 20% · recency 20%. Top-matched comps best support the ARV.
Projected returns pro-forma
10.0% appreciation · 3.0% rent growth · sell at horizon
- IRR
- 19.4%
- Equity multiple
- 2.58×
- Total profit
- $123,337
- Equity at exit
- $251,345
- IRR
- 17.9%
- Equity multiple
- 5.94×
- Total profit
- $385,787
- Equity at exit
- $542,036
Cash invested: $78,120 (down + closing). Projections, not guarantees.
Landlord ↔ Tenant lean methodology
- Overall (STATE)
- 62 Landlord-Friendly
- State Pennsylvania
- 62 Landlord-Friendly · EVEN
- County
- — inherits STATE
- City
- — inherits STATE
ZIP-level market 18444
- Home prices YoY
- 24.9%
- Active inventory
- 97
- Price-to-rent
- 12.4×
Monthly cashflow live
- Estimated rent
- $1,871 medium interval (Pro) →
- Mortgage (P&I)
- −$1,463
- Tax est. 1.5%
- −$349 /mo · $4,185/yr
- Insurance
- −$116
- HOA
- −$0
- Vacancy / Maint / Mgmt
- −$393
- Net cashflow
- $-450
Break-even live
Sensitivity live
| Price | -10% $-257 | -5% $-353 | +0% $-450 | +5% $-546 | +10% $-643 |
|---|---|---|---|---|---|
| Rent | -10% $-598 | -5% $-524 | +0% $-450 | +5% $-376 | +10% $-302 |
| Rate | -1.0pp $-309 | -0.5pp $-379 | base $-450 | +0.5pp $-522 | +1.0pp $-596 |
UW: 25.0% down · 7.5% · 30yr · 1.5% tax · 5.0% vac · 8.0% maint · 8.0% mgmt
Financing live
Cash to close
- Down payment
- $69,750
- Closing costs
- $8,370
- Reserves months
- —
- Total cash needed
- —
Loan-product check · same deal, 3 products live
Conventional
25% down · 7.5% · 30yr
- Down + closing
- —
- Monthly P&I
- —
- Monthly cashflow
- —
- DSCR
- —
- Eligible?
- —
Personal DTI + credit; lowest rate.
DSCR
20% down · 8.5% · 30yr
- Down + closing
- —
- Monthly P&I
- —
- Monthly cashflow
- —
- DSCR
- —
- Eligible?
- —
No personal income docs; deal must DSCR.
Hard money
10% down · 12.0% · 12mo
- Down + closing
- —
- Monthly P&I
- —
- Monthly cashflow
- —
- DSCR
- —
- Eligible?
- —
Short-term bridge; refi at stabilization.
Listing history 3 events
-
2026-05-09status Pending 246-char remark
-
2026-05-07price $279,000 246-char remark
-
2026-05-06$2,790,000 Active 246-char remark
ⓘ Source: listings_history table (triggers on properties + properties_extension) + one-shot
backfill from property_details.listing_events for pre-trigger history.
Climate risk First Street
- Flood 1/10 Low FEMA zone X (unshaded) · 0% chance over 30 yrs
- Wildfire 1/10 Low
- Heat 2/10 Low 7 d/yr ≥89°F today · 17 d/yr by 30 yrs out
- Wind 3/10 Moderate 4% chance of damaging wind over 30 yrs
- Air quality 2/10 Low 1 unhealthy d/yr today · 2 by 30 yrs out
Nearby sold comps map
Loading sold comps map…
Walkable amenities ~0.75 mi
Loading nearby amenities…
Taxation est. · year 1
- Rental income
- $22,457
- − Mortgage interest
- −$15,628
- − Property taxes
- −$4,185
- − Insurance
- −$1,395
- − Repairs & maintenance
- −$1,797
- − Management
- −$1,797
- − Depreciation
- −$8,116
- Taxable loss
- −$10,461
- Est. tax savings @ 24.0%
- +$2,511
- After-tax cash flow
- $-2,886/yr
For passive investors: Depreciation is non-cash, so a rental often shows a tax loss while cash-flowing — sheltering income. Rental losses are passive: they offset passive income freely, and up to $25,000/yr can offset ordinary (W-2) income if you actively participate and your MAGI is under $100k (phasing out to $0 by $150k); unused losses carry forward. On sale, claimed depreciation is recaptured at up to 25%, and gains may owe capital-gains tax (a 1031 exchange can defer both). Figures are a year-1 estimate at your 24.0% rate — not tax advice; consult a CPA.
Schools (NCES district)
- District
- North Pocono SD
- NCES district ID
- 4217310
- Math proficiency
- 45% ▼ -9.00%
- Reading proficiency
- 71% ▼ -2.00%
- Median HH income
- $59,555
- Composite
- 50.23/100
- National rank
- #1894
- State rank
- #82 of 539 in PA
Livability — Moscow
- Score
- 78/100
- State rank
- #298
- US rank
- #2633
Category grades
Schools grade is shown separately in the Schools card above.
Census & demographics
- Census place
- Moscow, PA
- City population
- 13,681
- Population (ZIP)
- 13,681
Population outlook (Lackawanna County) Hauer SSP2
- Today (2025)
- 210,652 people
- By 2030
- 208,623 · -1.0%
- By 2040
- 203,980 · -3.2%
- By 2050
- 201,069 · -4.5%
- By 2075
- 205,026 · -2.7%
- By 2100
- 210,851 · +0.1%
Race, ethnicity, and origin ACS 2023
- Neighborhood character
- Predominantly White (91%)
- Race & ethnicity
- White 91% Two or more races 6% Hispanic / Latino 3%
- Common ancestry
- Romanian 16% Scotch-Irish 4% Slovak 2%
- Foreign-born
- 1% · Canada, South Korea
- Languages at home
- 97% English-only · Spanish 2% Russian/Polish/Slavic 1%
Political lean MEDSL · Lackawanna
- 2024 margin
- Toss-up / Even · D 51.0% · R 48.3%
- 2008→2024 swing
- -23.2pp toward R · 2008: 26.0pp · 2024: 2.8pp
- All cycles
- 2024: D+2.8 2020: D+8.4 2016: D+3.4 2012: D+27.4 2008: D+26.0
Not yet ingested
- Civics
- —
Market trends
- HPI YoY
- ▲ 85.51%
- Current HPI
- 428.8661
- Rent YoY
- —
- Metro
- —
- State GDP YoY
- ▲ 1.68%
- F500 in state
- 34
Industry mix (Fortune 500 HQ in PA)
| Industry | F500 HQs | Revenue |
|---|---|---|
| Healthcare | 2 | $309B |
|
||
| Insurance | 2 | $27B |
|
||
| Telecommunications / Media | 1 | $124B |
|
||
| Industrial Distribution | 1 | $22B |
|
||
| Financial Services | 1 | $20B |
|
||
| Chemicals / Materials | 1 | $18B |
|
||
Price history
-90.5% since first listed5 events — show timeline
- 2026-06-05 Sold (Public Records) $264,000 Public Records
- 2026-06-05 Sold (MLS) $264,000 GSBR as distributed by MLS GRID
- 2026-05-09 Pending — GSBR as distributed by MLS GRID
- 2026-05-07 Price Changed $279,000 GSBR as distributed by MLS GRID
- 2026-05-06 Listed $2,790,000 GSBR as distributed by MLS GRID
Property tax history
+33.7%/yrLatest (2026): $79,533 · +1823.8% YoY. Source: county tax records.
Cash-flow waterfall
monthlySold comps — $/sqft
last 12 mo · ≤1 miLoading sold comps…