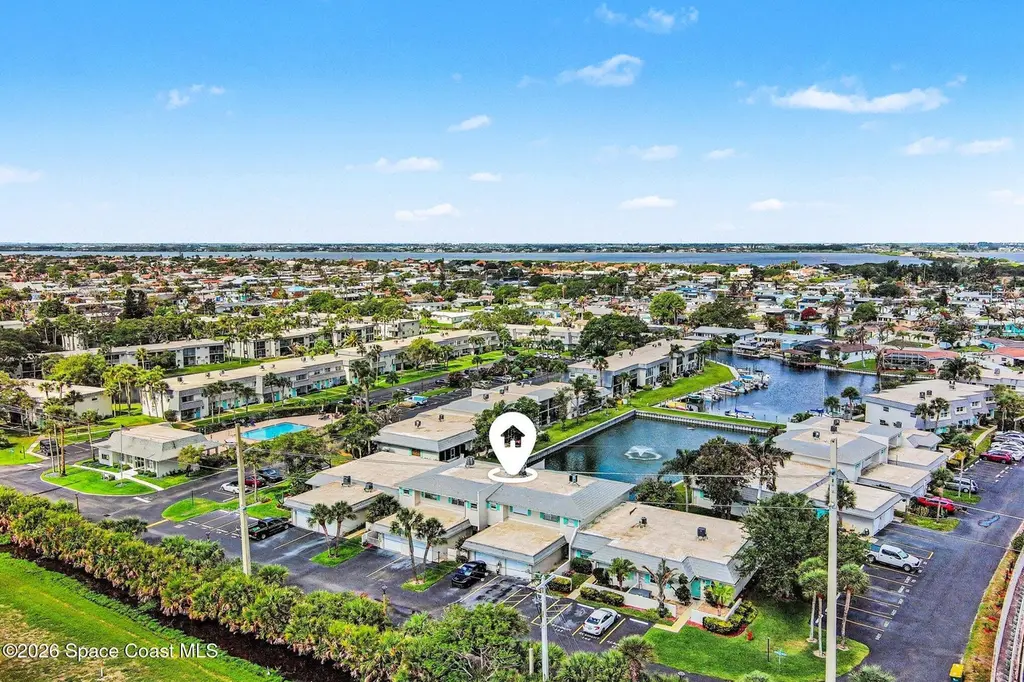
453 Ibis Ln Unit 2-12 · South Patrick Shores, FL
Flood risk 9/10 · Severe
- FEMA flood zone
- X (shaded)
- Chance of flooding over 30 yrs
- 0.99%
- Est. flood insurance / yr
- $507 – $1,088
Fire risk 1/10 · Minimal
- Est. fire insurance / yr
- $947 – $1,759
Heat risk 10/10 · Severe
- Hot days now (above 103°F)
- 7 days/yr
- Hot days in 30 yrs
- 25 days/yr
Wind risk 10/10 · Severe
- Chance of severe wind over 30 yrs
- 99.0%
Air-quality risk 1/10 · Minimal
- Unhealthy air days now
- 0 days/yr
- Unhealthy air days in 30 yrs
- 0 days/yr
Risk factors via First Street. Map © Google.
Why this score? — see what drove the D grade
The composite is a weighted blend of 9 inputs, each scored 0–100. Each bar is that input's sub-score; the figure is the points it added to the 100-point composite (weight × sub-score).
- Cash flow +12.1/30.0
- ARV discount +7.5/15.0
- 1% rule +5.8/10.0
- Schools +4.7/10.0
- DSCR +3.6/10.0
- Livability +3.2/5.0
- Rent growth +2.9/5.0
- Condition / age +2.5/5.0
- Appreciation +0.0/10.0
$250,000
🖨 Deal sheet (PDF) 📄 Offer letter ✓ Due diligence
Listing remarks
Welcome to Waterway Townhouse Condo, a sought-after waterfront community nestled along the Grand Canal and just blocks from the Atlantic Ocean. Residents enjoy resort-style amenities including an Olympic-sized swimming pool, clubhouse, tennis courts, and pickleball, all conveniently located near shopping, restaurants, Patrick Space Force Base, and everyday conveniences. This charming one-story villa offers comfortable coastal living with beautiful water views from the owner's suite and screened lanai, where you can relax while watching turtles sunbathe and boats and kayaks drift by the docks. The renovated kitchen features granite countertops, tile backsplash, soft-close antique white cabin
Key facts
- Waterfront community
- Screened lanai
- Renovated kitchen
Tags
Property features AI
Finance
- HOA & community: Community managed by Towers Mgmt; Monthly association fee; Association fee covers cable TV, sewer, trash and water; Community amenities include boat dock, clubhouse, on-site or off-site management, tennis courts and pickleball
Exterior
- Parking: Assigned parking; Additional parking available; 1-car garage
- Utilities: Public sewer; Cable connected; Electricity available; Sewer connected; Water connected
- Home design: Townhouse; One story (entry level 1); Faces east; Property is attached
- Construction: Block, concrete and stucco construction
- Exterior features: Impact windows; Storm shutters; Covered rear screened porch; Screened porch; Open patio; Garden; Pond and seawall waterfront features; Zero lot line; City street frontage; Asphalt road surface; Membrane roof
Interior
- Kitchen: Dishwasher; Electric oven; Electric range; Microwave; Refrigerator; Electric water heater
- Bedrooms: 2 bedrooms
- Flooring: Tile flooring
- Bathrooms: 2 full bathrooms
- Heating & cooling: Central heating (electric); Central air conditioning (electric)
- Interior features: Ceiling fans; Entrance foyer; Open floor plan; Primary bathroom with tub and shower; Primary bedroom on main level; Walk-in closet
- Laundry & utility: Washer hookup; Electric dryer hookup; Laundry in garage; Lower level laundry access
Neighborhood map
What this means for you Summary
Snapshot
- This is a 2-bed/2.0-bath townhouse listed at $250k.
Deal economics
- At list price, monthly cash flow is $-120 ($-1k/yr) — negative.
- To cash-flow at today's rent, offer at most $229k (8.5% below list).
- Meets the 1% rule at list price ($3k rent vs $250k).
- Recommended offer: $229k (8.5% below list) — sets the bar for cash-flow.
Location & tenants
- Location reads 64/100 on livability (#665 in FL) — a middle-class / working-renter tenant base. Strengths: crime A+, housing A+; Watch: amenities F, commute F, health & safety D-.
- Brevard (suburban): math 53% / reading 57% proficiency, ranked #19 of 73 in FL (top 26%) — acceptable for families but not a draw, mixed tenant base, ~2y average lease.
- Zoned schools: Sea Park Elementary School (math 67% / reading 67%, grade B+, #450 of 2,144 statewide, top 22%, 335 students, 39% FRL); Delaura Middle School (math 74% / reading 70%, grade A, #52 of 571 statewide, top 10%, 843 students, 21% FRL); Satellite Senior High School (math 65% / reading 71%, grade B, #66 of 667 statewide, top 10%, 1,517 students, 20% FRL) — zoned schools average 27% FRL vs 43% district-wide (16 pts lower); this property's tenant base skews higher-income than the district average.
- Zoned-school proficiency averages 69% at this address vs 55% district-wide (+14 pts) — the actual schools serving this property are materially stronger than the Brevard average implies; a family-tenant draw the district grade alone would hide.
- Market conditions: Rents rising (+1.6%/yr); 312 active listings in the ZIP; 12 comparable units currently listed for rent nearby; rentals at typical pace (median 25d on market — plan ~3-4 weeks tenant-placement turnaround); solid renter incomes; 4,602 units permitted in Brevard County in 2024 (702 in 5+ unit buildings).
- This rent runs 32% of the median local income ($101k/yr) — at the standard rent-burdened threshold; future hikes will face affordability resistance.
Forward outlook
- Local home prices are declining (-3.0%/yr); year-one equity from $2k of loan paydown is wiped out by about $8k of value loss. Plan a longer hold.
- Brevard County population projected at +15% by 2050 — modest demand growth; plan on rents tracking national, not racing it.
Negotiation context
- Only 6 days on market — expect competitive offers; lowballing is unlikely to land.
- Current owner paid $76k; list at $250k implies a 229% gain — meaningful room to come down on a strong offer.
Risks & watch-outs
- Watch-outs: flood insurance adds $66/mo.
- Climate carrying-cost: severe flood risk; severe wind risk, 99% chance of damaging wind over 30y; extreme-heat days projected 7→25/yr by 2055 (HVAC capex compounding) — expect insurance premiums to compound above CPI over the hold.
Questions for the listing agent
- What do current leases actually rent for vs. the listed asking? Can we see a recent rent roll and the last 12 months of T-12 income?
- Built in 1979 — when were the roof, HVAC, electrical panel, plumbing, and water heater last replaced?
- What's the actual annual flood-insurance premium (NFIP or private), and is the property in a SFHA with mandatory coverage?
- What does the HOA fee cover, when was the last increase, and are there any pending special assessments or reserve-fund shortfalls?
- Is there a deadline driving the sale (1031 exchange, divorce, estate, relocation)? That informs how much negotiation room exists.
- The area grade is low — what's the realistic commute time and amenity access for the typical tenant pool here? Any planned neighborhood developments (good or bad) we should know about?
- What's the average days-on-market for RENTAL listings here right now (not sales)? A rising rental-DOM trend means longer vacancies and softer asking-rent achievability than the comps imply.
- What's the recent tenant-quality profile in this submarket — average credit score on applications, eviction rate, late-payment / NSF rate, and stable-employment percentage? A property-management company in the area should have these aggregated.
- How much new for-sale + rental construction is in the pipeline within 1–3 miles? Heavy new supply typically softens prices + rents 12–24 months out; constrained supply supports both.
Investment metrics
- 1% rule
- 1.08% ✓
- Cap rate
- 6.04%
- Cash-on-cash
- -0.92%
- DSCR
- 0.96
- GRM
- 7.7
CMA / ARV
No comps found within radius.
Projected returns pro-forma
-3.0% appreciation · 1.55% rent growth · sell at horizon
- IRR
- -21.7%
- Equity multiple
- 0.26×
- Total profit
- $-51,673
- Equity at exit
- $37,276
- IRR
- -20.3%
- Equity multiple
- 0.02×
- Total profit
- $-68,840
- Equity at exit
- $21,615
Cash invested: $70,000 (down + closing). Projections, not guarantees.
Landlord ↔ Tenant lean methodology
- Overall (STATE)
- 87 Strongly Landlord-Friendly
- State Florida
- 87 Strongly Landlord-Friendly · R+3
- County
- — inherits STATE
- City
- — inherits STATE
ZIP-level market 32937
- Rents YoY
- 1.6%
- Active inventory
- 312
- Price-to-rent
- 7.7×
Monthly cashflow live
- Estimated rent
- $2,702 high interval (Pro) →
- Mortgage (P&I)
- −$1,311
- Tax from tax record
- −$244 /mo · $2,925/yr
- Insurance
- −$104
- Flood insurance flood zone
- −$66 /mo · $798/yr
- HOA
- −$529
- Vacancy / Maint / Mgmt
- −$567
- Net cashflow
- $-120
Break-even live
Sensitivity live
| Price | -10% $22 | -5% $-49 | +0% $-120 | +5% $-191 | +10% $-261 |
|---|---|---|---|---|---|
| Rent | -10% $-333 | -5% $-227 | +0% $-120 | +5% $-13 | +10% $93 |
| Rate | -1.0pp $6 | -0.5pp $-56 | base $-120 | +0.5pp $-185 | +1.0pp $-251 |
UW: 25.0% down · 7.5% · 30yr · 1.5% tax · 5.0% vac · 8.0% maint · 8.0% mgmt
Financing live
Cash to close
- Down payment
- $62,500
- Closing costs
- $7,500
- Reserves months
- —
- Total cash needed
- —
Loan-product check · same deal, 3 products live
Conventional
25% down · 7.5% · 30yr
- Down + closing
- —
- Monthly P&I
- —
- Monthly cashflow
- —
- DSCR
- —
- Eligible?
- —
Personal DTI + credit; lowest rate.
DSCR
20% down · 8.5% · 30yr
- Down + closing
- —
- Monthly P&I
- —
- Monthly cashflow
- —
- DSCR
- —
- Eligible?
- —
No personal income docs; deal must DSCR.
Hard money
10% down · 12.0% · 12mo
- Down + closing
- —
- Monthly P&I
- —
- Monthly cashflow
- —
- DSCR
- —
- Eligible?
- —
Short-term bridge; refi at stabilization.
Rent comps 12 comps
| Address | Beds | Baths | Sqft | Rent | $/sqft | DOM | Units | Dist |
|---|---|---|---|---|---|---|---|---|
| 436 Blue Jay Ln Satellite Beach, FL | 2.0 | 2.5 | 1424 | $1,950 | $1.37 | 25d | 1 | 0.15mi |
| 160 Melaleuca Dr Satellite Beach, FL | 3.0 | 2.0 | 1127 | $3,000 | $2.66 | 25d | 1 | 0.16mi |
| 419 Blue Jay Ln Satellite Beach, FL | 2.0 | 2.5 | 1424 | $1,950 | $1.37 | 25d | 1 | 0.17mi |
| 216 NE 3rd St Satellite Beach, FL | 3.0 | 2.0 | 1118 | $2,650 | $2.37 | 25d | 1 | 0.21mi |
| 160 A1A Jimmy Buffett Memorial Hwy Satellite Beach, FL | 1.0–2.0 | 1.0–2.0 | 1047 | $2,050 | $1.96 | 25d | 1 | 0.54mi |
| 199 Jimmy Buffett Memorial Hwy Unit 1044475P Satellite Beach, FL | 2.0 | 2.5 | 1194 | $4,321 | $3.62 | 25d | 1 | 0.65mi |
| 199 Highway A1A Unit A102 Satellite Beach, FL | 2.0 | 2.0 | 1254 | $3,300 | $2.63 | 25d | 1 | 0.66mi |
| 199 Jimmy Buffett Memorial Hwy Unit B205 Satellite Beach, FL | 2.0 | 2.5 | 1205 | $3,350 | $2.78 | 25d | 1 | 0.66mi |
| 199 Jimmy Buffett Memorial Hwy Unit A-105 Satellite Beach, FL | 2.0 | 2.0 | 1254 | $3,300 | $2.63 | 15d | 1 | 0.66mi |
| 199 Jimmy Buffett Memorial Hwy Unit A205 Satellite Beach, FL | 2.0 | 2.5 | 1205 | $3,250 | $2.70 | 25d | 1 | 0.66mi |
| 199 Jimmy Buffett Memorial Hwy Unit A-104 Satellite Beach, FL | 2.0 | 2.0 | 1254 | $3,400 | $2.71 | 25d | 1 | 0.66mi |
| 199 Jimmy Buffett Memorial Hwy Unit D102 Satellite Beach, FL | 2.0 | 2.0 | 1174 | $2,300 | $1.96 | 25d | 1 | 0.66mi |
HOA detail
- Monthly dues
- $529 · $6,348/yr
- Likely covers
- waterpool
Listing history 3 events
-
2026-05-21$250,000 Active
-
1990-12-30soldstatus $76,000
-
1990-12-01soldstatus $76,000
ⓘ Source: listings_history table (triggers on properties + properties_extension) + one-shot
backfill from property_details.listing_events for pre-trigger history.
Tax reassessment forecast FL · Resets to sale price
- Current annual tax
- $2,925 · $244/mo
- Projected year-2 tax
- $2,925 · $244/mo
- Expected delta
- $0/yr ($0/mo · 0.0%)
ⓘ Screening estimate from a state-policy table — verify with the county assessor before closing.
Climate risk First Street
- Flood 9/10 Extreme FEMA zone X (shaded) · 99% chance over 30 yrs
- Wildfire 1/10 Low
- Heat 10/10 Extreme 7 d/yr ≥103°F today · 25 d/yr by 30 yrs out
- Wind 10/10 Extreme 99% chance of damaging wind over 30 yrs
- Air quality 1/10 Low 0 unhealthy d/yr today · 0 by 30 yrs out
Nearby sold comps map
Loading sold comps map…
Walkable amenities ~0.75 mi
Loading nearby amenities…
Taxation est. · year 1
- Rental income
- $32,422
- − Mortgage interest
- −$14,004
- − Property taxes
- −$2,925
- − Insurance
- −$2,048
- − Repairs & maintenance
- −$2,594
- − Management
- −$2,594
- − HOA
- −$6,348
- − Depreciation
- −$7,273
- Taxable loss
- −$5,363
- Est. tax savings @ 24.0%
- +$1,287
- After-tax cash flow
- $-152/yr
For passive investors: Depreciation is non-cash, so a rental often shows a tax loss while cash-flowing — sheltering income. Rental losses are passive: they offset passive income freely, and up to $25,000/yr can offset ordinary (W-2) income if you actively participate and your MAGI is under $100k (phasing out to $0 by $150k); unused losses carry forward. On sale, claimed depreciation is recaptured at up to 25%, and gains may owe capital-gains tax (a 1031 exchange can defer both). Figures are a year-1 estimate at your 24.0% rate — not tax advice; consult a CPA.
Schools (NCES district)
- District
- Brevard
- NCES district ID
- 1200150
- Math proficiency
- 53% ▼ -9.00%
- Reading proficiency
- 57% ▼ -4.00%
- Median HH income
- $49,426
- Composite
- 46.86/100
- National rank
- #2370
- State rank
- #19 of 73 in FL
Livability — South Patrick Shores
- Score
- 64/100
- State rank
- #665
- US rank
- #13650
Category grades
Schools grade is shown separately in the Schools card above.
Census & demographics
- Census place
- South Patrick Shores, FL
- County
- Brevard County · 602,871 people
- Metro
- Palm Bay-Melbourne-Titusville, FL
- Population (ZIP)
- 27,836
- Household income
- $101,184
- Rent vs Own
- Severe rent burden
- 534.0
Population outlook (Brevard County) Hauer SSP2
- Today (2025)
- 623,254 people
- By 2030
- 648,420 · +4.0%
- By 2040
- 690,009 · +10.7%
- By 2050
- 715,669 · +14.8%
- By 2075
- 775,744 · +24.5%
- By 2100
- 776,687 · +24.6%
Race, ethnicity, and origin ACS 2023
- Neighborhood character
- Predominantly White (82%)
- Race & ethnicity
- White 82% Hispanic / Latino 9% Two or more races 7% Asian 2% Black 1%
- Hispanic origin (detail)
- Mexican 1% Puerto Rican 2%
- Common ancestry
- Romanian 3% Lithuanian 3% Italian 2%
- Foreign-born
- 4% · Canada
- Languages at home
- 95% English-only · Spanish 3% Other Indo-European 1%
Political lean MEDSL · Brevard
- 2024 margin
- Strong R (+20.8) · D 39.1% · R 59.9% · Other 1.0%
- 2008→2024 swing
- -10.4pp toward R · 2008: -10.4pp · 2024: -20.8pp
- All cycles
- 2024: R+20.8 2020: R+16.4 2016: R+19.8 2012: R+12.7 2008: R+10.4
Not yet ingested
- Civics
- —
Market trends
- HPI YoY
- ▼ -336.76%
- Current HPI
- 361.3801
- Rent YoY
- ▲ 1.55%
- Metro
- Palm Bay-Melbourne-Titusville, FL
- State GDP YoY
- ▲ 3.28%
- F500 in state
- 36
Industry mix (Fortune 500 HQ in FL)
| Industry | F500 HQs | Revenue |
|---|---|---|
| Industrial Technology | 2 | $29B |
|
||
| Insurance | 2 | $17B |
|
||
| Retail | 1 | $60B |
|
||
| Technology Distribution | 1 | $58B |
|
||
| Homebuilding | 1 | $35B |
|
||
| Technology Manufacturing | 1 | $35B |
|
||
Price history
+228.9% since first listed3 events — show timeline
- 2026-05-21 Listed $250,000 SCMLS
- 1990-12-30 Sold (Public Records) $76,000 Public Records
- 1990-12-01 Sold (Public Records) $76,000 Public Records
Property tax history
+6.1%/yrLatest (2025): $2,925 · -2.9% YoY. Source: county tax records.
Cash-flow waterfall
monthlySold comps — $/sqft
last 12 mo · ≤1 miLoading sold comps…