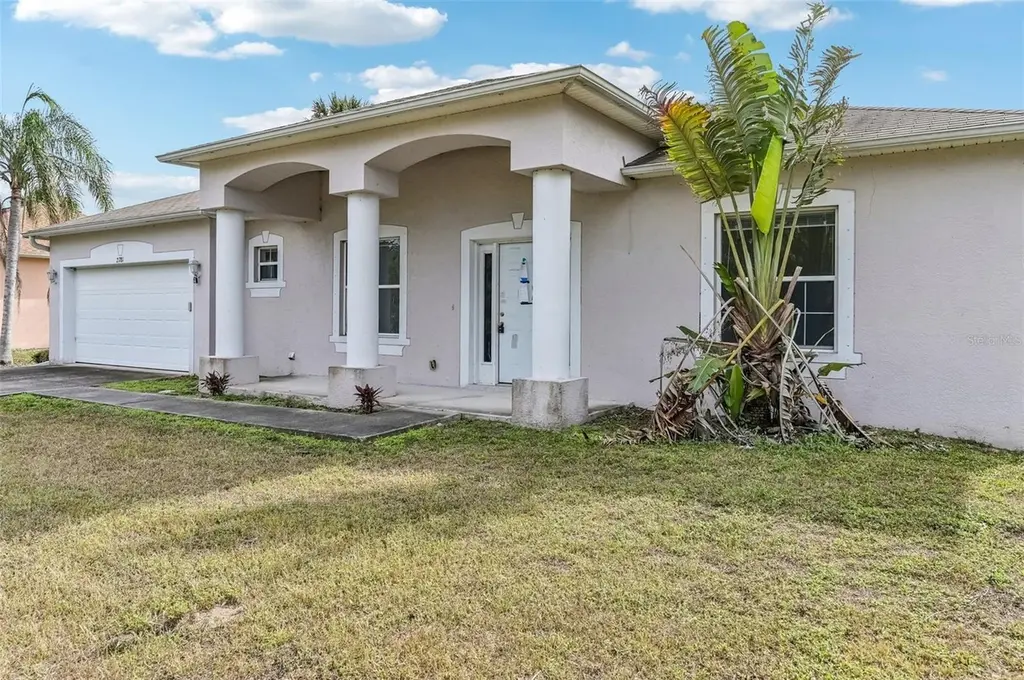
2781 Shady Ave · North Port, FL
Flood risk 6/10 · Moderate
- FEMA flood zone
- X (unshaded)
- Chance of flooding over 30 yrs
- 0.71%
- Est. flood insurance / yr
- $507 – $1,088
Fire risk 1/10 · Minimal
- Est. fire insurance / yr
- $947 – $1,759
Heat risk 10/10 · Severe
- Hot days now (above 108°F)
- 7 days/yr
- Hot days in 30 yrs
- 28 days/yr
Wind risk 10/10 · Severe
- Chance of severe wind over 30 yrs
- 99.0%
Air-quality risk 3/10 · Minor
- Unhealthy air days now
- 2 days/yr
- Unhealthy air days in 30 yrs
- 3 days/yr
Risk factors via First Street. Map © Google.
Why this score? — see what drove the D+ grade
The composite is a weighted blend of 9 inputs, each scored 0–100. Each bar is that input's sub-score; the figure is the points it added to the 100-point composite (weight × sub-score).
- ARV discount +15.0/15.0
- Cash flow +12.1/30.0
- Schools +5.4/10.0
- 1% rule +4.3/10.0
- Livability +3.8/5.0
- DSCR +3.6/10.0
- Rent growth +2.8/5.0
- Condition / age +2.5/5.0
- Appreciation +0.0/10.0
$250,000
🖨 Deal sheet (PDF) 📄 Offer letter ✓ Due diligence
Listing remarks
Under contract-accepting backup offers. Short Sale. Short Sale. Multiple Offers Received. Seller Calling Highest and Best by 5:00 p. m. Friday, 1/20/2026. Unique Opportunity to own a pool home on a larger highly elevated corner lot. The roof is original to the home. 3 Bedrooms and 2 Bathrooms, Flex Space and Bonus Room. Master Bedroom open to pool, Kitchen open to living room. 2 Car attached garage. This home has been winterized by the lender. All soft surfaces have been removed. All mechanicals need replacing. The home has been with no services for quite some time and will need new finishes and mechanicals (Hot Water Heater, HVAC, Pool Equipment, Appliances). Pool screens were compromised
Key facts
- 0.24 acre lot
- 2 garage spots
- Pool
Neighborhood map
What this means for you Summary
Snapshot
- This is a 3-bed/2.0-bath single-family listed at $250k.
Deal economics
- At list price, monthly cash flow is $-56 ($-675/yr) — negative.
- To cash-flow at today's rent, offer at most $240k (4.0% below list).
- To meet the 1% rule (rent ≥ 1% of price), the offer needs to be $231k (7.5% below list).
- Recommended offer: $220k (12.0% below list) — sets the bar for market timing.
- Cap rate 6.0% vs local median 3.8% in North Port — top-decile yield for the area; either an underpriced asset or a hidden risk that comps aren't pricing in. Stress-test before assuming the spread holds.
Location & tenants
- Location reads 75/100 on livability (#252 in FL, #3,975 nationally) — a middle-class / working-renter tenant base. Strengths: crime A+, housing A+, health & safety A+; Watch: amenities F, commute F.
- Sarasota (urban): math 63% / reading 63% proficiency, ranked #7 of 73 in FL (top 10%) — acceptable for families but not a draw, mixed tenant base, ~2y average lease.
- Zoned schools: Cranberry Elementary School (math 69% / reading 68%, grade B+, #409 of 2,144 statewide, top 20%, 785 students, 68% FRL); Heron Creek Middle School (math 54% / reading 52%, grade C+, #209 of 571 statewide, top 37%, 902 students, 72% FRL); North Port High School (math 44% / reading 57%, grade D+, #171 of 667 statewide, top 26%, 2,562 students, 54% FRL) — zoned schools average 64% FRL vs 42% district-wide (22 pts higher); higher-poverty schools than district average — tighter screening recommended.
- Market conditions: Rents rising (+1.1%/yr); 852 active listings in the ZIP; 5 comparable units currently listed for rent nearby; rentals at typical pace (median 16d on market — plan ~3-4 weeks tenant-placement turnaround); solid renter incomes; 7,466 units permitted in Sarasota County in 2024 (2,138 in 5+ unit buildings).
- This rent runs 34% of the median local income ($81k/yr) — at the standard rent-burdened threshold; future hikes will face affordability resistance.
Forward outlook
- Local home prices are declining (-3.0%/yr); year-one equity from $2k of loan paydown is wiped out by about $8k of value loss. Plan a longer hold.
- Sarasota County population projected at +20% by 2050 — long-run rental-demand tailwind backs the buy-and-hold thesis.
Negotiation context
- It's been on market 568 days — a 12% lower offer ($220k) is reasonable based on typical stale-listing flexibility.
- 7 sale attempts since 4y ago; this cycle's ask has dropped $100k (29%) from the opening price — seller is motivated, your offer sets the floor, not the list.
Risks & watch-outs
- Climate carrying-cost: major flood risk; severe wind risk, 99% chance of damaging wind over 30y; extreme-heat days projected 7→28/yr by 2055 (HVAC capex compounding) — expect insurance premiums to compound above CPI over the hold.
Questions for the listing agent
- What do current leases actually rent for vs. the listed asking? Can we see a recent rent roll and the last 12 months of T-12 income?
- It's been on market 568 days. Have you received any prior offers? Is the seller open to a 12% concession, seller financing, or rate buy-down credit?
- Why hasn't it sold? Are there any deal-killer items the seller is aware of (foundation, flood, title, zoning, code violations)?
- Is there a deadline driving the sale (1031 exchange, divorce, estate, relocation)? That informs how much negotiation room exists.
- Schools are B-rated — typically a magnet for longer-tenancy family renters. What's the average tenant stay here, and is there a school-zone premium baked into asking?
- The area grade is low — what's the realistic commute time and amenity access for the typical tenant pool here? Any planned neighborhood developments (good or bad) we should know about?
- What's the average days-on-market for RENTAL listings here right now (not sales)? A rising rental-DOM trend means longer vacancies and softer asking-rent achievability than the comps imply.
- What's the recent tenant-quality profile in this submarket — average credit score on applications, eviction rate, late-payment / NSF rate, and stable-employment percentage? A property-management company in the area should have these aggregated.
- How much new for-sale + rental construction is in the pipeline within 1–3 miles? Heavy new supply typically softens prices + rents 12–24 months out; constrained supply supports both.
Investment metrics
- 1% rule
- 0.93% ✗
- Cap rate
- 6.02%
- Cash-on-cash
- -0.96%
- DSCR
- 0.96
- GRM
- 9.0
CMA / ARV
- ARV (on-the-fly)
- $408,040
- Comps found
- 1
Show comp detail 1 sale within ~0.75 mi
| Address | Dist | Beds/Ba | Sqft | Sold | Price | $/sf | Match |
|---|---|---|---|---|---|---|---|
| 15037 Mcgraw Ave | 0.70mi | 3/2.0 | 1,828 (-10%) | 10mo | $369,000 | $202 | 43 |
Match score weights: distance 35% · size 25% · config 20% · recency 20%. Top-matched comps best support the ARV.
Projected returns pro-forma
-3.0% appreciation · 1.12% rent growth · sell at horizon
- IRR
- -20.2%
- Equity multiple
- 0.31×
- Total profit
- $-48,260
- Equity at exit
- $37,276
- IRR
- -18.3%
- Equity multiple
- 0.10×
- Total profit
- $-63,083
- Equity at exit
- $21,615
Cash invested: $70,000 (down + closing). Projections, not guarantees.
Landlord ↔ Tenant lean methodology
- Overall (STATE)
- 87 Strongly Landlord-Friendly
- State Florida
- 87 Strongly Landlord-Friendly · R+3
- County
- — inherits STATE
- City
- — inherits STATE
ZIP-level market 34286
- Home prices YoY
- -9.5%
- Rents YoY
- 1.1%
- Active inventory
- 852
- Price-to-rent
- 9.0×
Monthly cashflow live
- Estimated rent
- $2,314 high interval (Pro) →
- Mortgage (P&I)
- −$1,311
- Tax from tax record
- −$469 /mo · $5,626/yr
- Insurance
- −$104
- HOA
- −$0
- Vacancy / Maint / Mgmt
- −$486
- Net cashflow
- $-56
Break-even live
Sensitivity live
| Price | -10% $85 | -5% $14 | +0% $-56 | +5% $-127 | +10% $-198 |
|---|---|---|---|---|---|
| Rent | -10% $-239 | -5% $-148 | +0% $-56 | +5% $35 | +10% $126 |
| Rate | -1.0pp $70 | -0.5pp $7 | base $-56 | +0.5pp $-121 | +1.0pp $-187 |
UW: 25.0% down · 7.5% · 30yr · 1.5% tax · 5.0% vac · 8.0% maint · 8.0% mgmt
Financing live
Cash to close
- Down payment
- $62,500
- Closing costs
- $7,500
- Reserves months
- —
- Total cash needed
- —
Loan-product check · same deal, 3 products live
Conventional
25% down · 7.5% · 30yr
- Down + closing
- —
- Monthly P&I
- —
- Monthly cashflow
- —
- DSCR
- —
- Eligible?
- —
Personal DTI + credit; lowest rate.
DSCR
20% down · 8.5% · 30yr
- Down + closing
- —
- Monthly P&I
- —
- Monthly cashflow
- —
- DSCR
- —
- Eligible?
- —
No personal income docs; deal must DSCR.
Hard money
10% down · 12.0% · 12mo
- Down + closing
- —
- Monthly P&I
- —
- Monthly cashflow
- —
- DSCR
- —
- Eligible?
- —
Short-term bridge; refi at stabilization.
Rent comps 5 comps
| Address | Beds | Baths | Sqft | Rent | $/sqft | DOM | Units | Dist |
|---|---|---|---|---|---|---|---|---|
| 96 Westview Pl Port Charlotte, FL | 1.0–3.0 | 1.0–2.0 | 1120 | $2,303 | $2.06 | 15d | 38 | 0.25mi |
| 304 Camillia Ln Unit A Port Charlotte, FL | 2.0 | 2.0 | 1986 | $1,495 | $0.75 | 23d | 1 | 0.78mi |
| 406 Border St Port Charlotte, FL | 3.0 | 2.0 | 2200 | $2,500 | $1.14 | 23d | 1 | 0.94mi |
| 14134 Packard Ave Port Charlotte, FL | 4.0 | 2.0 | 1833 | $2,095 | $1.14 | 15d | 1 | 1.16mi |
| 15476 Chamberlain Blvd Port Charlotte, FL | 3.0 | 2.0 | 1521 | $2,159 | $1.42 | 15d | 1 | 1.24mi |
Listing history 23 events
-
2026-02-02status Pending
-
2025-12-19price $250,000
-
2025-09-10status Active
-
2025-08-16status Pending
-
2025-02-19price $290,000
-
2025-01-13price $299,997
-
2024-12-05status Active
-
2024-11-16status Pending
-
2024-10-03status Active
-
2024-07-02status Pending
-
2024-06-28status Active
-
2024-01-08status Pending
-
2023-12-19price $314,000
-
2023-10-07price $350,000
-
2023-10-07status Active
-
2023-02-24status Pending
-
2023-02-21price $325,000
-
2023-02-18price $330,000
-
2023-02-08status Active
-
2023-02-08price $340,000
-
2022-10-11status Pending
-
2022-10-07price $300,000
-
2022-09-30$350,000 Active
ⓘ Source: listings_history table (triggers on properties + properties_extension) + one-shot
backfill from property_details.listing_events for pre-trigger history.
Tax reassessment forecast FL · Resets to sale price
- Current annual tax
- $5,626 · $469/mo
- Projected year-2 tax
- $5,626 · $469/mo
- Expected delta
- $0/yr ($0/mo · 0.0%)
ⓘ Screening estimate from a state-policy table — verify with the county assessor before closing.
Climate risk First Street
- Flood 6/10 Major FEMA zone X (unshaded) · 71% chance over 30 yrs
- Wildfire 1/10 Low
- Heat 10/10 Extreme 7 d/yr ≥108°F today · 28 d/yr by 30 yrs out
- Wind 10/10 Extreme 99% chance of damaging wind over 30 yrs
- Air quality 3/10 Moderate 2 unhealthy d/yr today · 3 by 30 yrs out
Nearby sold comps map
Loading sold comps map…
Walkable amenities ~0.75 mi
Loading nearby amenities…
Taxation est. · year 1
- Rental income
- $27,764
- − Mortgage interest
- −$14,004
- − Property taxes
- −$5,626
- − Insurance
- −$1,250
- − Repairs & maintenance
- −$2,221
- − Management
- −$2,221
- − Depreciation
- −$7,273
- Taxable loss
- −$4,831
- Est. tax savings @ 24.0%
- +$1,160
- After-tax cash flow
- $484/yr
For passive investors: Depreciation is non-cash, so a rental often shows a tax loss while cash-flowing — sheltering income. Rental losses are passive: they offset passive income freely, and up to $25,000/yr can offset ordinary (W-2) income if you actively participate and your MAGI is under $100k (phasing out to $0 by $150k); unused losses carry forward. On sale, claimed depreciation is recaptured at up to 25%, and gains may owe capital-gains tax (a 1031 exchange can defer both). Figures are a year-1 estimate at your 24.0% rate — not tax advice; consult a CPA.
Schools (NCES district)
- District
- Sarasota
- NCES district ID
- 1201680
- Math proficiency
- 63% ▼ -8.00%
- Reading proficiency
- 63% ▼ -3.00%
- Median HH income
- $51,167
- Composite
- 53.68/100
- National rank
- #1428
- State rank
- #7 of 73 in FL
Livability — North Port
- Score
- 75/100
- State rank
- #252
- US rank
- #3975
Category grades
Schools grade is shown separately in the Schools card above.
Census & demographics
- Census place
- North Port, FL
- County
- Sarasota County · 448,376 people
- City population
- 75,324
- Metro
- North Port-Sarasota-Bradenton, FL
- Population (ZIP)
- 22,534
- Household income
- $80,553
- Rent vs Own
- Severe rent burden
- 545.0
Population outlook (Sarasota County) Hauer SSP2
- Today (2025)
- 452,380 people
- By 2030
- 474,175 · +4.8%
- By 2040
- 511,577 · +13.1%
- By 2050
- 541,467 · +19.7%
- By 2075
- 604,947 · +33.7%
- By 2100
- 621,965 · +37.5%
Race, ethnicity, and origin ACS 2023
- Neighborhood character
- Predominantly White (81%)
- Race & ethnicity
- White 81% Hispanic / Latino 10% Two or more races 8% Black 3% Asian 1%
- Hispanic origin (detail)
- Mexican 2% Puerto Rican 4% Cuban 2%
- Common ancestry
- Romanian 7% Lithuanian 4% Subsaharan African 2%
- Foreign-born
- 9% · Canada
- Languages at home
- 86% English-only · Spanish 7% Russian/Polish/Slavic 4% Other Indo-European 1%
Political lean MEDSL · Sarasota
- 2024 margin
- R (+18.2) · D 40.5% · R 58.7%
- 2008→2024 swing
- -18.1pp toward R · 2008: -0.1pp · 2024: -18.2pp
- All cycles
- 2024: R+18.2 2020: R+10.4 2016: R+11.6 2012: R+7.4 2008: R+0.1
Not yet ingested
- Civics
- —
Market trends
- HPI YoY
- ▼ -31.36%
- Current HPI
- 297.3707
- Rent YoY
- ▲ 1.12%
- Metro
- North Port-Sarasota-Bradenton, FL
- State GDP YoY
- ▲ 3.28%
- F500 in state
- 36
Industry mix (Fortune 500 HQ in FL)
| Industry | F500 HQs | Revenue |
|---|---|---|
| Industrial Technology | 2 | $29B |
|
||
| Insurance | 2 | $17B |
|
||
| Retail | 1 | $60B |
|
||
| Technology Distribution | 1 | $58B |
|
||
| Homebuilding | 1 | $35B |
|
||
| Technology Manufacturing | 1 | $35B |
|
||
Price history
-28.6% since first listed23 events — show timeline
- 2026-02-02 Pending — Stellar MLS as Distributed by MLS Grid
- 2025-12-19 Price Changed $250,000 Stellar MLS as Distributed by MLS Grid
- 2025-09-10 Relisted — Stellar MLS as Distributed by MLS Grid
- 2025-08-16 Pending — Stellar MLS as Distributed by MLS Grid
- 2025-02-19 Price Changed $290,000 Stellar MLS as Distributed by MLS Grid
- 2025-01-13 Price Changed $299,997 Stellar MLS as Distributed by MLS Grid
- 2024-12-05 Relisted — Stellar MLS as Distributed by MLS Grid
- 2024-11-16 Pending — Stellar MLS as Distributed by MLS Grid
- 2024-10-03 Relisted — Stellar MLS as Distributed by MLS Grid
- 2024-07-02 Pending — Stellar MLS as Distributed by MLS Grid
- 2024-06-28 Relisted — Stellar MLS as Distributed by MLS Grid
- 2024-01-08 Pending — Stellar MLS as Distributed by MLS Grid
- 2023-12-19 Price Changed $314,000 Stellar MLS as Distributed by MLS Grid
- 2023-10-07 Price Changed $350,000 Stellar MLS as Distributed by MLS Grid
- 2023-10-07 Relisted — Stellar MLS as Distributed by MLS Grid
- 2023-02-24 Pending — Stellar MLS as Distributed by MLS Grid
- 2023-02-21 Price Changed $325,000 Stellar MLS as Distributed by MLS Grid
- 2023-02-18 Price Changed $330,000 Stellar MLS as Distributed by MLS Grid
- 2023-02-08 Relisted — Stellar MLS as Distributed by MLS Grid
- 2023-02-08 Price Changed $340,000 Stellar MLS as Distributed by MLS Grid
- 2022-10-11 Pending — Stellar MLS as Distributed by MLS Grid
- 2022-10-07 Price Changed $300,000 Stellar MLS as Distributed by MLS Grid
- 2022-09-30 Listed $350,000 Stellar MLS as Distributed by MLS Grid
Property tax history
+6.3%/yrLatest (2025): $5,626 · -0.1% YoY. Source: county tax records.
Cash-flow waterfall
monthlySold comps — $/sqft
last 12 mo · ≤1 miLoading sold comps…