 🌊 Lakefront
1826 Hilton Head Dr · Missouri City, TX
Flood risk 4/10 · Minor
- FEMA flood zone
- X (unshaded)
- Chance of flooding over 30 yrs
- 0.21%
- Est. flood insurance / yr
- $507 – $1,088
Fire risk 2/10 · Minimal
- Est. fire insurance / yr
- $1,222 – $2,270
Heat risk 9/10 · Severe
- Hot days now (above 110°F)
- 7 days/yr
- Hot days in 30 yrs
- 23 days/yr
Wind risk 9/10 · Severe
- Chance of severe wind over 30 yrs
- 99.0%
Air-quality risk 3/10 · Minor
- Unhealthy air days now
- 2 days/yr
- Unhealthy air days in 30 yrs
- 3 days/yr
Risk factors via First Street. Map © Google.
Why this score? — see what drove the D+ grade
The composite is a weighted blend of 9 inputs, each scored 0–100. Each bar is that input's sub-score; the figure is the points it added to the 100-point composite (weight × sub-score).
- Cash flow +11.0/30.0
- ARV discount +10.6/15.0
- Schools +4.5/10.0
- Appreciation +4.2/10.0
- 1% rule +3.6/10.0
- Livability +3.4/5.0
- DSCR +3.2/10.0
- Rent growth +2.5/5.0
- Condition / age +2.5/5.0
$250,000
🖨 Deal sheet 📄 Offer letter ✓ Due diligence
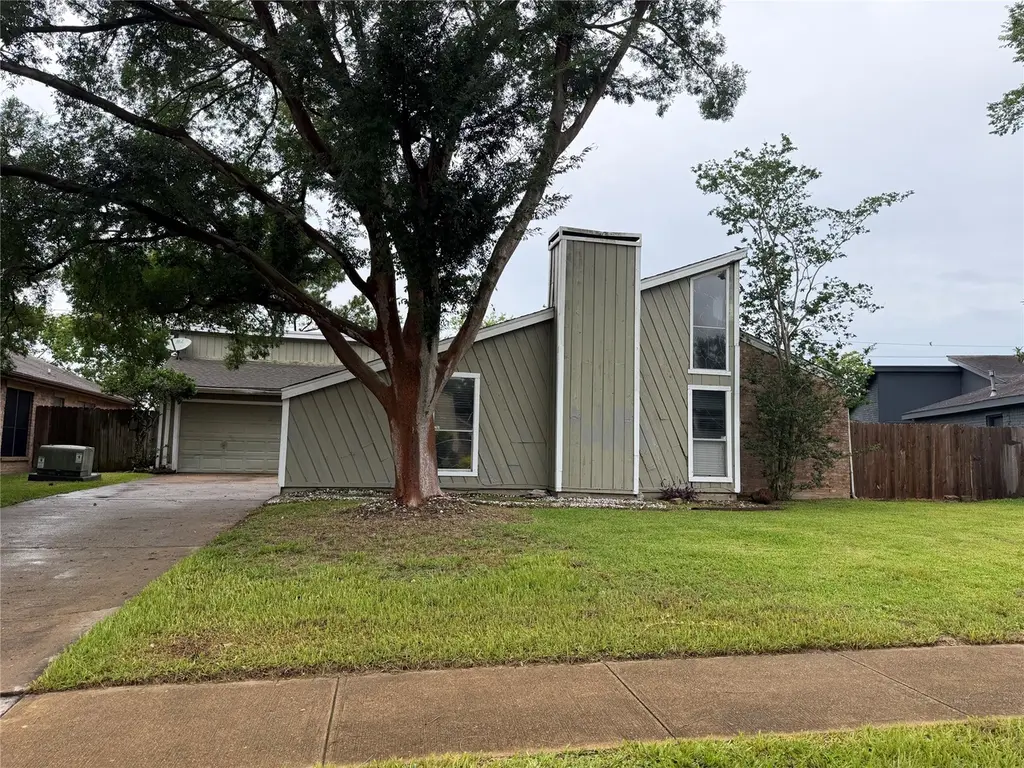
Listing remarks
Opportunity in the established Thunderbird subdivision of Quail Valley! This one-story home features 3 bedrooms and 2 bathrooms and is situated on an oversized lot offering space, privacy, and strong potential. The property offers a functional and open layout with natural light throughout. The spacious living room features an exposed beam, gas-log fireplace, and large windows that fill the space with natural light. The primary suite includes two walk-in closets and an en-suite bath, while two secondary bedrooms are well-sized and share a full hall bathroom. The expansive backyard offers abundant space for outdoor living, entertaining, or future improvements. The home is being sold AS-IS and
Key facts
- Large windows
- Walk-in closets
- Open layout
Tags
Property features AI
Finance
- Other: Lease not considered
- HOA & community: Thunderbird North association with an annual fee of $200
Exterior
- Parking: Attached 2-car garage
- Utilities: Public water; Public sewer
- Home design: Residential property; Built in 1976; Slab foundation
- Construction: Brick, cement siding, and wood siding exterior; Composition roof
- Exterior features: Greenbelt lot
Interior
- Kitchen: Kitchen on the first floor (approx. 12x18)
- Bedrooms: Primary bedroom on the first floor (approx. 14x12); Bedroom on the first floor (approx. 11x10); Bedroom on the first floor (approx. 12x11)
- Bathrooms: Two full bathrooms
- Heating & cooling: Central heating (gas); Central electric air conditioning
- Interior features: One fireplace; Six total rooms
Neighborhood map
What this means for you Summary
Snapshot
- This is a 3-bed/2.0-bath single-family listed at $250k.
Deal economics
- At list price, monthly cash flow is $-105 ($-1k/yr) — negative.
- To cash-flow at today's rent, offer at most $231k (7.4% below list).
- To meet the 1% rule (rent ≥ 1% of price), the offer needs to be $215k (13.8% below list).
- Recommended offer: $215k (13.8% below list) — sets the bar for 1% rule.
- Cap rate 5.8% vs local median 3.5% in Missouri City — top-decile yield for the area; either an underpriced asset or a hidden risk that comps aren't pricing in. Stress-test before assuming the spread holds.
Location & tenants
- Location reads 67/100 on livability (#526 in TX) — a middle-class / working-renter tenant base. Strengths: housing A+, crime A, employment A; Watch: amenities F, commute F, health & safety F.
- Fort Bend ISD (suburban): math 44% / reading 53% proficiency, ranked #140 of 826 in TX (top 17%) — families likely to look elsewhere, expect single-tenant / working-renter base with shorter leases.
- Zoned schools: Lantern Lane El (math 17% / reading 37%, grade F, #2,791 of 4,322 statewide, top 68%, 472 students, 77% FRL); Quail Valley Middle (math 55% / reading 57%, grade B-, #234 of 1,662 statewide, top 14%, 1,043 students, 45% FRL) — zoned schools average 61% FRL vs 35% district-wide (26 pts higher); higher-poverty schools than district average — tighter screening recommended.
- Market conditions: Rents soft (-0.1%/yr); 1215 active listings in the ZIP; 11 comparable units currently listed for rent nearby; rentals at typical pace (median 21d on market — plan ~3-4 weeks tenant-placement turnaround); high-income renter base; 12,093 units permitted in Fort Bend County in 2024 (815 in 5+ unit buildings).
Forward outlook
- Local home prices are declining (-1.7%/yr); year-one equity from $2k of loan paydown is wiped out by about $4k of value loss. Plan a longer hold.
- Fort Bend County population projected at +75% by 2050 — long-run rental-demand tailwind backs the buy-and-hold thesis.
Negotiation context
- It's been on market 21 days — a 2% lower offer ($246k) is reasonable based on typical stale-listing flexibility.
Risks & watch-outs
- Climate carrying-cost: severe wind risk, 99% chance of damaging wind over 30y; extreme-heat days projected 7→23/yr by 2055 (HVAC capex compounding) — expect insurance premiums to compound above CPI over the hold.
Questions for the listing agent
- What do current leases actually rent for vs. the listed asking? Can we see a recent rent roll and the last 12 months of T-12 income?
- Built in 1976 — when were the roof, HVAC, electrical panel, plumbing, and water heater last replaced?
- What does the HOA fee cover, when was the last increase, and are there any pending special assessments or reserve-fund shortfalls?
- Is there a deadline driving the sale (1031 exchange, divorce, estate, relocation)? That informs how much negotiation room exists.
- Schools are B-rated — typically a magnet for longer-tenancy family renters. What's the average tenant stay here, and is there a school-zone premium baked into asking?
- The area grade is low — what's the realistic commute time and amenity access for the typical tenant pool here? Any planned neighborhood developments (good or bad) we should know about?
- This sits on a lake — are riparian / water-frontage rights deeded with the parcel? Any dock permits, shoreline easements, or HOA water-use restrictions?
- What's the documented flood / surge / shoreline-erosion history here (FEMA AND non-FEMA — e.g., storm surge, creek backup, septic-field saturation)?
- Any water-quality or seasonal algae-bloom issues that affect tenant satisfaction or short-term-rental demand?
- What's the average days-on-market for RENTAL listings here right now (not sales)? A rising rental-DOM trend means longer vacancies and softer asking-rent achievability than the comps imply.
- What's the recent tenant-quality profile in this submarket — average credit score on applications, eviction rate, late-payment / NSF rate, and stable-employment percentage? A property-management company in the area should have these aggregated.
- How much new for-sale + rental construction is in the pipeline within 1–3 miles? Heavy new supply typically softens prices + rents 12–24 months out; constrained supply supports both.
Investment metrics
- 1% rule
- 0.86% ✗
- Cap rate
- 5.79%
- Cash-on-cash
- -1.80%
- DSCR
- 0.92
- GRM
- 9.7
CMA / ARV
- ARV (on-the-fly)
- $268,200
- Comps found
- 12
Show comp detail 12 sales within ~0.75 mi
| Address | Dist | Beds/Ba | Sqft | Sold | Price | $/sf | Match |
|---|---|---|---|---|---|---|---|
| 1615 Turtle Creek Dr | 0.24mi | 3/2.0 | 1,721 (-4%) | 2mo | $275,000 | $160 | 80 |
| 1747 Hilton Head Dr | 0.09mi | 4/2.5 (+1) | 2,030 (+13%) | 2mo | $300,000 | $148 | 66 |
| 2230 Quail Valley East Dr | 0.63mi | 3/2.0 | 1,838 (+2%) | 2mo | $224,900 | $122 | 65 |
| 3290 Hunters Glen Dr | 0.52mi | 3/2.0 | 1,676 (-7%) | 1mo | $210,000 | $125 | 63 |
| 3107 Southern Hills Dr | 0.25mi | 3/2.0 | 1,531 (-15%) | 0mo | $265,000 | $173 | 63 |
| 3502 Quail Meadow Dr | 0.63mi | 3/2.5 | 1,740 (-3%) | 2mo | $249,000 | $143 | 61 |
| 16718 Running Quail Ct | 0.65mi | 3/2.0 | 1,686 (-6%) | 1mo | $235,000 | $139 | 58 |
| 1519 Wells Manor Ln | 0.64mi | 4/2.0 (+1) | 1,881 (+4%) | 1mo | $327,000 | $174 | 56 |
| 8618 Quail Vista Dr | 0.56mi | 3/2.0 | 1,980 (+10%) | 3mo | $267,000 | $135 | 54 |
| 3710 Quail Meadow Dr | 0.75mi | 3/2.0 | 1,676 (-7%) | 3mo | $250,000 | $149 | 51 |
| 2126 Quail Valley East Dr | 0.51mi | 3/2.0 | 1,536 (-15%) | 1mo | $249,900 | $163 | 51 |
| 8434 Quail Crest Dr | 0.74mi | 3/2.0 | 1,560 (-13%) | 3mo | $239,500 | $154 | 41 |
Match score weights: distance 35% · size 25% · config 20% · recency 20%. Top-matched comps best support the ARV.
Projected returns pro-forma
-1.67% appreciation · 0.0% rent growth · sell at horizon
- IRR
- -14.2%
- Equity multiple
- 0.44×
- Total profit
- $-39,168
- Equity at exit
- $52,432
- IRR
- -10.7%
- Equity multiple
- 0.23×
- Total profit
- $-53,838
- Equity at exit
- $48,565
Cash invested: $70,000 (down + closing). Projections, not guarantees.
Landlord ↔ Tenant lean methodology
- Overall (STATE)
- 87 Strongly Landlord-Friendly
- State Texas
- 87 Strongly Landlord-Friendly · R+5
- County
- — inherits STATE
- City
- — inherits STATE
ZIP-level market 77459
- Home prices YoY
- -0.8%
- Rents YoY
- -0.1%
- Active inventory
- 1215
- Price-to-rent
- 9.7×
Monthly cashflow live
- Estimated rent
- $2,154 high interval (Pro) →
- Mortgage (P&I)
- −$1,311
- Tax from tax record
- −$374 /mo · $4,490/yr
- Insurance
- −$104
- HOA
- −$17
- Vacancy / Maint / Mgmt
- −$452
- Net cashflow
- $-105
Break-even live
UW: 25.0% down · 7.5% · 30yr · 1.5% tax · 5.0% vac · 8.0% maint · 8.0% mgmt
Financing live
Cash to close
- Down payment
- $62,500
- Closing costs
- $7,500
- Reserves months
- —
- Total cash needed
- —
Loan-product check · same deal, 3 products live
Conventional
25% down · 7.5% · 30yr
- Down + closing
- —
- Monthly P&I
- —
- Monthly cashflow
- —
- DSCR
- —
- Eligible?
- —
Personal DTI + credit; lowest rate.
DSCR
20% down · 8.5% · 30yr
- Down + closing
- —
- Monthly P&I
- —
- Monthly cashflow
- —
- DSCR
- —
- Eligible?
- —
No personal income docs; deal must DSCR.
Hard money
10% down · 12.0% · 12mo
- Down + closing
- —
- Monthly P&I
- —
- Monthly cashflow
- —
- DSCR
- —
- Eligible?
- —
Short-term bridge; refi at stabilization.
Rent comps 11 comps
| Address | Beds | Baths | Sqft | Rent | $/sqft | DOM | Units | Dist |
|---|---|---|---|---|---|---|---|---|
| 1919 Doliver Cir Missouri City, TX | 3.0 | 2.0 | 1515 | $2,000 | $1.32 | 44d | 1 | 0.41mi |
| 2910 Fawn Ct Missouri City, TX | 4.0 | 2.5 | 2330 | $2,220 | $0.95 | 44d | 1 | 0.41mi |
| 17318 Edgehaven Dr Missouri City, TX | 3.0 | 2.0 | 1448 | $1,695 | $1.17 | 21d | 1 | 0.60mi |
| 2307 Hilton Head Dr Missouri City, TX | 4.0 | 2.0 | 2606 | $2,239 | $0.86 | 17d | 1 | 0.69mi |
| 3618 Quail Meadow Dr Missouri City, TX | 3.0 | 2.0 | 1618 | $1,966 | $1.22 | 44d | 1 | 0.73mi |
| 4039 Mission Valley Dr Missouri City, TX | 4.0 | 2.5 | 2364 | $2,495 | $1.06 | 22d | 1 | 0.99mi |
| 1806 Courtside Place Dr Missouri City, TX | 4.0 | 2.5 | 1974 | $1,915 | $0.97 | 13d | 1 | 1.23mi |
| 16310 Setter Ct Missouri City, TX | 3.0 | 2.0 | 1672 | $1,700 | $1.02 | 44d | 1 | 1.24mi |
| 2026 Summer Place Dr Missouri City, TX | 3.0 | 2.0 | 1837 | $1,861 | $1.01 | 21d | 1 | 1.26mi |
| 1215 New Tree Ln Missouri City, TX | 3.0 | 2.0 | 1323 | $1,725 | $1.30 | 13d | 1 | 1.39mi |
| 2222 Mountshire Dr Missouri City, TX | 4.0 | 2.5 | 2278 | $2,700 | $1.19 | 21d | 1 | 1.42mi |
HOA detail
- Monthly dues
- $17 · $204/yr
- Likely covers
- gas
Listing history 18 events
-
2026-06-18days on market $250,000 Active 21 DOM
-
2026-06-17days on market $250,000 Active 20 DOM
-
2026-06-16days on market $250,000 Active 19 DOM
-
2026-06-15days on market $250,000 Active 18 DOM
-
2026-06-13days on market $250,000 Active 16 DOM
-
2026-06-09days on market $250,000 Active 12 DOM
-
2026-06-08days on market $250,000 Active 11 DOM
-
2026-06-07days on market $250,000 Active 10 DOM
-
2026-06-04days on market $250,000 Active 7 DOM
-
2026-06-03days on market $250,000 Active 6 DOM
-
2026-06-02days on market $250,000 Active 5 DOM
-
2026-06-01days on market $250,000 Active 4 DOM
-
2026-05-31days on market $250,000 Active 3 DOM
-
2026-05-28$250,000 Active
-
2015-03-04soldstatus
-
2001-05-18soldstatus
-
1995-04-12soldstatus
-
1994-04-08soldstatus
ⓘ Source: listings_history table (triggers on properties + properties_extension) + one-shot
backfill from property_details.listing_events for pre-trigger history.
Tax reassessment forecast TX · Resets to sale price
- Current annual tax
- $4,490 · $374/mo
- Projected year-2 tax
- $4,575 · $381/mo
- Expected delta
- +$85/yr (+$7/mo · 1.9%)
ⓘ Screening estimate from a state-policy table — verify with the county assessor before closing.
Climate risk First Street
- Flood 4/10 Moderate FEMA zone X (unshaded) · 21% chance over 30 yrs
- Wildfire 2/10 Low
- Heat 9/10 Extreme 7 d/yr ≥110°F today · 23 d/yr by 30 yrs out
- Wind 9/10 Extreme 99% chance of damaging wind over 30 yrs
- Air quality 3/10 Moderate 2 unhealthy d/yr today · 3 by 30 yrs out
Nearby sold comps map
Loading sold comps map…
Walkable amenities ~0.75 mi
Loading nearby amenities…
Taxation est. · year 1
- Rental income
- $25,847
- − Mortgage interest
- −$14,004
- − Property taxes
- −$4,490
- − Insurance
- −$1,250
- − Repairs & maintenance
- −$2,068
- − Management
- −$2,068
- − HOA
- −$204
- − Depreciation
- −$7,273
- Taxable loss
- −$5,509
- Est. tax savings @ 24.0%
- +$1,322
- After-tax cash flow
- $65/yr
For passive investors: Depreciation is non-cash, so a rental often shows a tax loss while cash-flowing — sheltering income. Rental losses are passive: they offset passive income freely, and up to $25,000/yr can offset ordinary (W-2) income if you actively participate and your MAGI is under $100k (phasing out to $0 by $150k); unused losses carry forward. On sale, claimed depreciation is recaptured at up to 25%, and gains may owe capital-gains tax (a 1031 exchange can defer both). Figures are a year-1 estimate at your 24.0% rate — not tax advice; consult a CPA.
Schools (NCES district)
- District
- Fort Bend ISD
- NCES district ID
- 4819650
- Math proficiency
- 44% ▼ -15.00%
- Reading proficiency
- 53% ▼ -4.00%
- Median HH income
- $82,360
- Composite
- 44.61/100
- National rank
- #2779
- State rank
- #140 of 826 in TX
Livability — Missouri City
- Score
- 67/100
- State rank
- #526
- US rank
- #10308
Category grades
Schools grade is shown separately in the Schools card above.
Census & demographics
- Census place
- Missouri City, TX
- County
- Fort Bend County · 836,777 people
- City population
- 123,513
- Metro
- Houston-The Woodlands-Sugar Land, TX
- Population (ZIP)
- 84,221
- Household income
- $129,151
- Rent vs Own
- Severe rent burden
- 1004.0
Population outlook (Fort Bend County) Hauer SSP2
- Today (2025)
- 1,004,526 people
- By 2030
- 1,153,104 · +14.8%
- By 2040
- 1,453,718 · +44.7%
- By 2050
- 1,753,781 · +74.6%
- By 2075
- 2,455,772 · +144.5%
- By 2100
- 2,930,528 · +191.7%
Race, ethnicity, and origin ACS 2023
- Neighborhood character
- Highly diverse neighborhood (Simpson 0.75)
- Race & ethnicity
- White 34% Black 26% Asian 22% Hispanic / Latino 13% Two or more races 10%
- Hispanic origin (detail)
- Mexican 7%
- Common ancestry
- Lithuanian 2% Slovak 1% Italian 1%
- Foreign-born
- 21% · Canada, China, Vietnam
- Languages at home
- 73% English-only · Other Asian/Pacific 8% Spanish 7% Other Indo-European 5%
Political lean MEDSL · Fort Bend
- 2024 margin
- Toss-up / Even · D 49.5% · R 47.9% · Other 2.6%
- 2008→2024 swing
- +4.0pp toward D · 2008: -2.4pp · 2024: 1.6pp
- All cycles
- 2024: D+1.6 2020: D+10.6 2016: D+6.6 2012: R+6.8 2008: R+2.4
Not yet ingested
- Civics
- —
Market trends
- HPI YoY
- ▼ -1.67%
- Current HPI
- 212.3573
- Rent YoY
- ▼ -0.15%
- Metro
- Houston-The Woodlands-Sugar Land, TX
- State GDP YoY
- ▲ 3.95%
- F500 in state
- 110
Industry mix (Fortune 500 HQ in TX)
| Industry | F500 HQs | Revenue |
|---|---|---|
| Energy | 16 | $1,198B |
|
||
| Technology | 5 | $198B |
|
||
| Engineering / Construction | 4 | $72B |
|
||
| Energy Services | 3 | $60B |
|
||
| Utilities | 3 | $41B |
|
||
| Healthcare | 2 | $330B |
|
||
Price history
5 events — show timeline
- 2026-05-28 Listed $250,000 HARMLS
- 2015-03-04 Sold (Public Records) — Public Records
- 2001-05-18 Sold (Public Records) — Public Records
- 1995-04-12 Sold (Public Records) — Public Records
- 1994-04-08 Sold (Public Records) — Public Records
Property tax history
+4.1%/yrLatest (2025): $4,490 · -3.6% YoY. Source: county tax records.
Cash-flow waterfall
monthlySold comps — $/sqft
last 12 mo · ≤1 miLoading sold comps…