701 Saint Judes Dr S #3 · Longboat Key, FL
Flood risk 10/10 · Severe
- FEMA flood zone
- AE
- Chance of flooding over 30 yrs
- 0.99%
- Est. flood insurance / yr
- $1,737 – $8,500
Fire risk 1/10 · Minimal
- Est. fire insurance / yr
- $947 – $1,759
Heat risk 10/10 · Severe
- Hot days now (above 106°F)
- 7 days/yr
- Hot days in 30 yrs
- 27 days/yr
Wind risk 10/10 · Severe
- Chance of severe wind over 30 yrs
- 99.0%
Air-quality risk 3/10 · Minor
- Unhealthy air days now
- 2 days/yr
- Unhealthy air days in 30 yrs
- 2 days/yr
Risk factors via First Street. Map © Google.
Why this score? — see what drove the C grade
The composite is a weighted blend of 9 inputs, each scored 0–100. Each bar is that input's sub-score; the figure is the points it added to the 100-point composite (weight × sub-score).
- Cash flow +16.9/30.0
- 1% rule +7.6/10.0
- ARV discount +7.5/15.0
- Appreciation +5.4/10.0
- DSCR +5.2/10.0
- Schools +4.4/10.0
- Livability +3.2/5.0
- Rent growth +2.5/5.0
- Condition / age +2.5/5.0
$259,000
🖨 Deal sheet (PDF) 📄 Offer letter ✓ Due diligence
Listing remarks
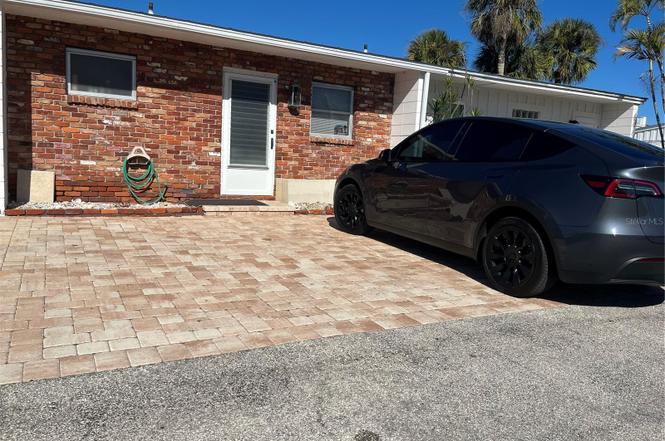
DIRECT WATERFRONT OPPORTUNITY IN LONGBOAT KEY! Here's your rare chance to own a waterfront property with direct access to the Intercoastal Waterway! Perfectly located for vacation rentals, this canal-front 1-bedroom, 1-bathroom end unit offers incredible potential for income, especially with high demand bookings from January to April. This property boasts 21 feet of water frontage and a newly installed seawall (June 2021). Enjoy the Florida lifestyle with easy access to boating, kayaking, and fishing. Additional outdoor amenities include a paver patio. Just steps away from the beach access and kayak launch! The property also has direct access to the scenic Joan M. Durante Park, with 32 acre
Key facts
- Water frontage
- Private beach access
- Paver patio
Tags
Property features AI
Finance
- Other: Unfurnished unit; Living area listed as 630 square feet
- Financial info: Total monthly fees: $229 (total annual fees: $2,748); Lease restrictions apply
- HOA & community: Has HOA (association: RICHARD KROOKS); Quarterly association fees; additional monthly maintenance $229; Association fees cover insurance, grounds maintenance, pest control, private road, sewer, trash and water
Exterior
- Parking: Has carport (1 space)
- Utilities: Public water; Public sewer; Electricity connected; Water and sewer connected
- Home design: Residential condominium; One story; Faces south; Floor 1 unit
- Construction: Block and brick construction; Shingle roof; Block foundation; Built as a single-level building
- Exterior features: On waterfront (canal - brackish); Water view: Bay/Harbor partial and canal; Water access via brackish canal; Davits on property; Asphalt road surface; Park in community; Pets allowed (max 15 lbs)
Interior
- Kitchen: No appliances included
- Bedrooms: 1 bedroom (floor 1)
- Flooring: Ceramic tile
- Bathrooms: 1 full bathroom
- Heating & cooling: Electric heating; Wall/window air conditioning units
- Interior features: Kitchen/family room combo; Four total rooms
- Laundry & utility: Laundry room with electric dryer hookup
Neighborhood map
What this means for you Summary
Snapshot
- This is a 1-bed/1.0-bath condo listed at $259k.
Deal economics
- At list price, monthly cash flow is $-257 ($-3k/yr) — negative.
- To cash-flow at today's rent, offer at most $214k (17.5% below list).
- Meets the 1% rule at list price ($3k rent vs $259k).
- Recommended offer: $214k (17.5% below list) — sets the bar for cash-flow.
- Cap rate 7.1% vs local median 0.5% in Longboat Key — top-decile yield for the area; either an underpriced asset or a hidden risk that comps aren't pricing in. Stress-test before assuming the spread holds.
Location & tenants
- Location reads 64/100 on livability (#693 in FL) — a middle-class / working-renter tenant base. Strengths: crime A+, employment A+; Watch: housing C-, amenities F, commute F.
- Manatee (suburban): math 54% / reading 50% proficiency, ranked #26 of 73 in FL (top 36%) — acceptable for families but not a draw, mixed tenant base, ~2y average lease.
- Zoned schools: Anna Maria Elementary School (math 77% / reading 77%, grade A, #170 of 2,144 statewide, top 9%, 190 students, 36% FRL); Martha B. King Middle School (math 48% / reading 39%, grade D, #329 of 571 statewide, top 58%, 848 students, 63% FRL); Bayshore High School (math 17% / reading 26%, grade F, #546 of 667 statewide, top 82%, 1,435 students, 65% FRL) — zoned schools at 55% FRL track the district average.
- Market conditions: 543 active listings in the ZIP; 1 comparable units currently listed for rent nearby; high-income renter base; 7,472 units permitted in Manatee County in 2024 (1,782 in 5+ unit buildings).
Forward outlook
- In year one you build about $4k of equity ($2k loan paydown + $2k appreciation (0.7% local appreciation)).
- Manatee County population projected at +43% by 2050 — long-run rental-demand tailwind backs the buy-and-hold thesis.
- By year 8, paydown + projected appreciation supports a ~$30k cash-out refi (75% LTV) — recoverable capital for the next deal without selling this one.
Negotiation context
- It's been on market 172 days — a 12% lower offer ($228k) is reasonable based on typical stale-listing flexibility.
- Current owner paid $48k; list at $259k implies a 440% gain — meaningful room to come down on a strong offer.
Risks & watch-outs
- Watch-outs: flood insurance adds $427/mo; HOA is 24% of rent.
- Climate carrying-cost: in FEMA flood zone AE (mandatory federal flood insurance); severe wind risk, 99% chance of damaging wind over 30y; extreme-heat days projected 7→27/yr by 2055 (HVAC capex compounding) — expect insurance premiums to compound above CPI over the hold.
Questions for the listing agent
- What do current leases actually rent for vs. the listed asking? Can we see a recent rent roll and the last 12 months of T-12 income?
- It's been on market 172 days. Have you received any prior offers? Is the seller open to a 18% concession, seller financing, or rate buy-down credit?
- Built in 1966 — when were the roof, HVAC, electrical panel, plumbing, and water heater last replaced?
- What's the actual annual flood-insurance premium (NFIP or private), and is the property in a SFHA with mandatory coverage?
- What does the HOA fee cover, when was the last increase, and are there any pending special assessments or reserve-fund shortfalls?
- Any open or pending special assessments — roof, HVAC, plumbing, elevator, façade? What's the per-unit balance and payoff schedule, and is the seller paying it off at close or rolling it to the buyer?
- Why hasn't it sold? Are there any deal-killer items the seller is aware of (foundation, flood, title, zoning, code violations)?
- Is there a deadline driving the sale (1031 exchange, divorce, estate, relocation)? That informs how much negotiation room exists.
- What's the average days-on-market for RENTAL listings here right now (not sales)? A rising rental-DOM trend means longer vacancies and softer asking-rent achievability than the comps imply.
- What's the recent tenant-quality profile in this submarket — average credit score on applications, eviction rate, late-payment / NSF rate, and stable-employment percentage? A property-management company in the area should have these aggregated.
- How much new apartment / multifamily construction is in the pipeline within 1–3 miles? Heavy new supply (>2% of stock underway) typically softens rents 12–24 months out; light construction supports rent growth.
Investment metrics
- 1% rule
- 1.26% ✓
- Cap rate
- 7.08%
- Cash-on-cash
- 2.81%
- DSCR
- 1.12
- GRM
- 6.6
CMA / ARV
No comps found within radius.
Projected returns pro-forma
0.73% appreciation · 3.0% rent growth · sell at horizon
- IRR
- -4.0%
- Equity multiple
- 0.80×
- Total profit
- $-14,263
- Equity at exit
- $84,769
- IRR
- 1.6%
- Equity multiple
- 1.19×
- Total profit
- $13,768
- Equity at exit
- $109,880
Cash invested: $72,520 (down + closing). Projections, not guarantees.
Landlord ↔ Tenant lean methodology
- Overall (STATE)
- 87 Strongly Landlord-Friendly
- State Florida
- 87 Strongly Landlord-Friendly · R+3
- County
- — inherits STATE
- City
- — inherits STATE
ZIP-level market 34228
- Home prices YoY
- 0.3%
- Active inventory
- 543
- Price-to-rent
- 6.6×
Monthly cashflow live
- Estimated rent
- $3,259 medium interval (Pro) →
- Mortgage (P&I)
- −$1,358
- Tax from tax record
- −$152 /mo · $1,830/yr
- Insurance
- −$108
- Flood insurance flood zone
- −$427 /mo · $5,118/yr
- HOA
- −$786
- Vacancy / Maint / Mgmt
- −$684
- Net cashflow
- $-257
Break-even live
Sensitivity live
| Price | -10% $-110 | -5% $-184 | +0% $-257 | +5% $-330 | +10% $-404 |
|---|---|---|---|---|---|
| Rent | -10% $-514 | -5% $-386 | +0% $-257 | +5% $-128 | +10% $0 |
| Rate | -1.0pp $-127 | -0.5pp $-191 | base $-257 | +0.5pp $-324 | +1.0pp $-392 |
UW: 25.0% down · 7.5% · 30yr · 1.5% tax · 5.0% vac · 8.0% maint · 8.0% mgmt
Financing live
Cash to close
- Down payment
- $64,750
- Closing costs
- $7,770
- Reserves months
- —
- Total cash needed
- —
Loan-product check · same deal, 3 products live
Conventional
25% down · 7.5% · 30yr
- Down + closing
- —
- Monthly P&I
- —
- Monthly cashflow
- —
- DSCR
- —
- Eligible?
- —
Personal DTI + credit; lowest rate.
DSCR
20% down · 8.5% · 30yr
- Down + closing
- —
- Monthly P&I
- —
- Monthly cashflow
- —
- DSCR
- —
- Eligible?
- —
No personal income docs; deal must DSCR.
Hard money
10% down · 12.0% · 12mo
- Down + closing
- —
- Monthly P&I
- —
- Monthly cashflow
- —
- DSCR
- —
- Eligible?
- —
Short-term bridge; refi at stabilization.
Rent comps 1 comps
| Address | Beds | Baths | Sqft | Rent | $/sqft | DOM | Units | Dist |
|---|---|---|---|---|---|---|---|---|
| 747 Saint Judes Dr S #2 Longboat Key, FL | 1.0 | 1.0 | 667 | $3,200 | $4.80 | 25d | 1 | 0.21mi |
HOA detail condo
- Monthly dues
- $786 · $9,432/yr
- Likely covers
- water
- Assessments
- None detected in remarks — confirm with the listing agent.
Listing history 19 events
-
2026-06-22days on market $259,000 Active 172 DOM
-
2026-06-18days on market $259,000 Active 169 DOM
-
2026-06-17days on market $259,000 Active 168 DOM
-
2026-06-16days on market $259,000 Active 167 DOM
-
2026-06-15days on market $259,000 Active 166 DOM
-
2026-06-13days on market $259,000 Active 164 DOM
-
2026-06-13days on market $259,000 Active 163 DOM
-
2026-06-10days on market $259,000 Active 161 DOM
-
2026-06-09days on market $259,000 Active 160 DOM
-
2026-06-08days on market $259,000 Active 159 DOM
-
2026-06-08days on market $259,000 Active 158 DOM
-
2026-06-03days on market $259,000 Active 154 DOM
-
2026-06-02days on market $259,000 Active 153 DOM
-
2026-06-01days on market $259,000 Active 152 DOM
-
2026-05-31days on market $259,000 Active 151 DOM
-
2025-12-31$259,000 Active
-
2000-02-11soldstatus $48,000
-
1986-07-01soldstatus $50,000
-
1981-03-01soldstatus $39,000
ⓘ Source: listings_history table (triggers on properties + properties_extension) + one-shot
backfill from property_details.listing_events for pre-trigger history.
Tax reassessment forecast FL · Resets to sale price
- Current annual tax
- $1,830 · $152/mo
- Projected year-2 tax
- $2,150 · $179/mo
- Expected delta
- +$320/yr (+$27/mo · 17.5%)
ⓘ Screening estimate from a state-policy table — verify with the county assessor before closing.
Climate risk First Street
- Flood 10/10 Extreme FEMA zone AE · 99% chance over 30 yrs
- Wildfire 1/10 Low
- Heat 10/10 Extreme 7 d/yr ≥106°F today · 27 d/yr by 30 yrs out
- Wind 10/10 Extreme 99% chance of damaging wind over 30 yrs
- Air quality 3/10 Moderate 2 unhealthy d/yr today · 2 by 30 yrs out
Nearby sold comps map
Loading sold comps map…
Walkable amenities ~0.75 mi
Loading nearby amenities…
Taxation est. · year 1
- Rental income
- $39,102
- − Mortgage interest
- −$14,508
- − Property taxes
- −$1,830
- − Insurance
- −$6,414
- − Repairs & maintenance
- −$3,128
- − Management
- −$3,128
- − HOA
- −$9,432
- − Depreciation
- −$7,535
- Taxable loss
- −$6,872
- Est. tax savings @ 24.0%
- +$1,649
- After-tax cash flow
- $-1,434/yr
For passive investors: Depreciation is non-cash, so a rental often shows a tax loss while cash-flowing — sheltering income. Rental losses are passive: they offset passive income freely, and up to $25,000/yr can offset ordinary (W-2) income if you actively participate and your MAGI is under $100k (phasing out to $0 by $150k); unused losses carry forward. On sale, claimed depreciation is recaptured at up to 25%, and gains may owe capital-gains tax (a 1031 exchange can defer both). Figures are a year-1 estimate at your 24.0% rate — not tax advice; consult a CPA.
Schools (NCES district)
- District
- Manatee
- NCES district ID
- 1201230
- Math proficiency
- 54% ▼ -6.00%
- Reading proficiency
- 50% ▼ -2.00%
- Median HH income
- $49,607
- Composite
- 44.43/100
- National rank
- #2806
- State rank
- #26 of 73 in FL
Livability — Longboat Key
- Score
- 64/100
- State rank
- #693
- US rank
- #14452
Category grades
Schools grade is shown separately in the Schools card above.
Census & demographics
- Census place
- Longboat Key, FL
- County
- Sarasota County · 448,376 people
- City population
- 7,539
- Metro
- North Port-Sarasota-Bradenton, FL
- Population (ZIP)
- 7,539
- Household income
- $158,030
- Rent vs Own
- Severe rent burden
- 98.0
Population outlook (Manatee County) Hauer SSP2
- Today (2025)
- 447,342 people
- By 2030
- 488,911 · +9.3%
- By 2040
- 567,934 · +27.0%
- By 2050
- 637,995 · +42.6%
- By 2075
- 781,970 · +74.8%
- By 2100
- 848,272 · +89.6%
Race, ethnicity, and origin ACS 2023
- Neighborhood character
- Predominantly White (93%)
- Race & ethnicity
- White 93% Hispanic / Latino 4% Two or more races 3% Asian 1%
- Common ancestry
- Scotch-Irish 7% Romanian 6% Lithuanian 4%
- Foreign-born
- 14% · Canada, China
- Languages at home
- 92% English-only · Spanish 2% Other Indo-European 2% German/W. Germanic 2%
Political lean MEDSL · Manatee
- 2024 margin
- Strong R (+23.5) · D 37.9% · R 61.4%
- 2008→2024 swing
- -16.5pp toward R · 2008: -7.0pp · 2024: -23.5pp
- All cycles
- 2024: R+23.5 2020: R+16.1 2016: R+17.1 2012: R+12.5 2008: R+7.0
Not yet ingested
- Civics
- —
Market trends
- HPI YoY
- ▲ 0.73%
- Current HPI
- 234.5017
- Rent YoY
- —
- Metro
- North Port-Sarasota-Bradenton, FL
- State GDP YoY
- ▲ 3.28%
- F500 in state
- 36
Industry mix (Fortune 500 HQ in FL)
| Industry | F500 HQs | Revenue |
|---|---|---|
| Industrial Technology | 2 | $29B |
|
||
| Insurance | 2 | $17B |
|
||
| Retail | 1 | $60B |
|
||
| Technology Distribution | 1 | $58B |
|
||
| Homebuilding | 1 | $35B |
|
||
| Technology Manufacturing | 1 | $35B |
|
||
Price history
+564.1% since first listed4 events — show timeline
- 2025-12-31 Listed $259,000 Stellar MLS as Distributed by MLS Grid
- 2000-02-11 Sold (Public Records) $48,000 Public Records
- 1986-07-01 Sold (Public Records) $50,000 Public Records
- 1981-03-01 Sold (Public Records) $39,000 Public Records
Property tax history
+2.3%/yrLatest (2025): $1,830 · -52.8% YoY. Source: county tax records.
Cash-flow waterfall
monthlySold comps — $/sqft
last 12 mo · ≤1 miLoading sold comps…