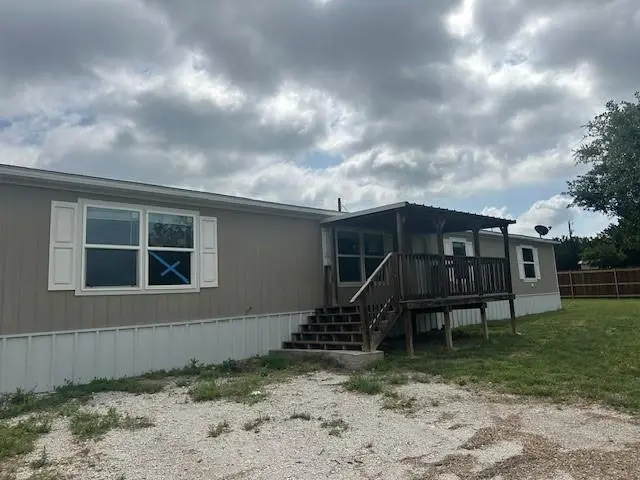
4815 Cimmaron Trl · Western Lake, TX
Flood risk 1/10 · Minimal
- FEMA flood zone
- X (unshaded)
- Chance of flooding over 30 yrs
- 0.0%
- Est. flood insurance / yr
- $507 – $1,088
Fire risk 7/10 · Major
- Est. fire insurance / yr
- $1,222 – $2,270
Heat risk 7/10 · Major
- Hot days now (above 108°F)
- 7 days/yr
- Hot days in 30 yrs
- 21 days/yr
Wind risk 4/10 · Minor
- Chance of severe wind over 30 yrs
- 21.0%
Air-quality risk 2/10 · Minimal
- Unhealthy air days now
- 1 days/yr
- Unhealthy air days in 30 yrs
- 2 days/yr
Risk factors via First Street. Map © Google.
Why this score? — see what drove the C grade
The composite is a weighted blend of 9 inputs, each scored 0–100. Each bar is that input's sub-score; the figure is the points it added to the 100-point composite (weight × sub-score).
- Cash flow +29.4/30.0
- DSCR +10.0/10.0
- 1% rule +9.3/10.0
- Schools +3.6/10.0
- Rent growth +2.7/5.0
- Livability +2.5/5.0
- Condition / age +2.5/5.0
- ARV discount +0.0/15.0
- Appreciation +0.0/10.0
$160,000
🖨 Deal sheet (PDF) 📄 Offer letter ✓ Due diligence
Listing remarks
HUD Case #513-286551. Welcome to 4815 Cimmaron Trl, a well-appointed 4 bedroom 2 bath home located in Weatherford. This thoughtfully designed property offers a functional layout ideal for a variety of lifestyles, featuring comfortable living spaces and a seamless flow between common areas and bedrooms. The spacious interior provides flexibility for both everyday living and entertaining, with a layout that accommodates a growing household, home office needs, or guest space. The kitchen and living areas serve as the heart of the home, offering a welcoming environment for gathering and relaxation. This property offers convenient access to local schools, shopping, dining, and major roadways, wh
Key facts
- Convenient access
- Seamless flow
- Functional layout
Tags
Property features AI
Finance
- Other: Possession at closing/funding
- Financial info: Listing is HUD owned; Acceptable financing: Cash, Conventional, FHA; Treat as clear loan type; No second mortgage indicated
- HOA & community: Mandatory association; Association fee $90 annually; Association fee includes full use of facilities; HOA: Western Lakes Owner Association
Exterior
- Parking: Driveway parking
- Security: No specific security features listed
- Utilities: Co-op electric service; Septic system; Not in a municipal utility district
- Home design: Manufactured home; Residential property; Built in 2019; Not attached to another property
- Construction: Year built 2019
- Exterior features: Lot under 0.5 acre (approximately 0.324 acres); Subdivision: Western Lake Estates
Interior
- Kitchen: Kitchen (appliances: Other)
- Bedrooms: 4 bedrooms (primary bedroom on first level)
- Flooring: Flooring details not provided
- Bathrooms: 2 full bathrooms
- Heating & cooling: Central heating; Central air conditioning
- Interior features: One-level layout; Two living areas; One dining area; Other interior features
- Laundry & utility: No specific laundry details listed
Neighborhood map
What this means for you Summary
Snapshot
- This is a 4-bed/2.0-bath manufactured listed at $160k.
Deal economics
- At list price, monthly cash flow is $569 ($7k/yr) — positive.
- The deal already cash-flows at list — no discount required.
- Meets the 1% rule at list price ($2k rent vs $160k).
- Recommended offer: $155k (3.0% below list) — sets the bar for market timing.
- Cap rate 10.6% vs local median 1.9% in Western Lake — top-decile yield for the area; either an underpriced asset or a hidden risk that comps aren't pricing in. Stress-test before assuming the spread holds.
Location & tenants
- Location reads 49/100 on livability (#1,506 in TX) — a working-class tenant base; expect higher turnover. Strengths: cost of living A+; Watch: health & safety D+, crime F, amenities F.
- Weatherford ISD (town): math 39% / reading 44% proficiency, ranked #321 of 826 in TX (top 39%) — families likely to look elsewhere, expect single-tenant / working-renter base with shorter leases.
- Zoned schools: Curtis El (math 43% / reading 43%, grade F, #1,283 of 4,322 statewide, top 30%, 644 students, 51% FRL).
- Market conditions: Rents flat; 661 active listings in the ZIP; high-income renter base; 437 units permitted in Parker County in 2024 (0 in 5+ unit buildings).
Forward outlook
- Local home prices are declining (-3.0%/yr); year-one equity from $1k of loan paydown is wiped out by about $5k of value loss. Plan a longer hold.
- Parker County population projected at +32% by 2050 — long-run rental-demand tailwind backs the buy-and-hold thesis.
Negotiation context
- It's been on market 53 days — a 3% lower offer ($155k) is reasonable based on typical stale-listing flexibility.
- 2 sale attempts since 2y ago; this cycle's ask has dropped $40k (20%) from the opening price — seller is motivated, your offer sets the floor, not the list.
Risks & watch-outs
- Climate carrying-cost: major wildfire risk; extreme-heat days projected 7→21/yr by 2055 (HVAC capex compounding) — expect insurance premiums to compound above CPI over the hold.
Questions for the listing agent
- It's been on market 53 days. Have you received any prior offers? Is the seller open to a 3% concession, seller financing, or rate buy-down credit?
- What does the HOA fee cover, when was the last increase, and are there any pending special assessments or reserve-fund shortfalls?
- Is there a deadline driving the sale (1031 exchange, divorce, estate, relocation)? That informs how much negotiation room exists.
- Schools are F-rated, which usually means shorter tenancies and higher turnover. Who's the typical renter profile here, and what's been the actual vacancy rate?
- Crime grade is F in this area — have there been break-ins, vandalism, or insurance claims at this property in the last 3 years? What carrier currently insures it and at what premium?
- What's the average days-on-market for RENTAL listings here right now (not sales)? A rising rental-DOM trend means longer vacancies and softer asking-rent achievability than the comps imply.
- What's the recent tenant-quality profile in this submarket — average credit score on applications, eviction rate, late-payment / NSF rate, and stable-employment percentage? A property-management company in the area should have these aggregated.
- How much new for-sale + rental construction is in the pipeline within 1–3 miles? Heavy new supply typically softens prices + rents 12–24 months out; constrained supply supports both.
Investment metrics
- 1% rule
- 1.43% ✓
- Cap rate
- 10.56%
- Cash-on-cash
- 15.24%
- DSCR
- 1.68
- GRM
- 5.8
CMA / ARV
- ARV (median comp)
- $119,832
- List price
- $160,000
- Delta
- 33.52%
- Verdict
- OVERPRICED
- Comps
- 2 within 1.0 mi
Show comp detail 1 sale within ~0.75 mi
| Address | Dist | Beds/Ba | Sqft | Sold | Price | $/sf | Match |
|---|---|---|---|---|---|---|---|
| 4725 Valley View Cir | 0.40mi | 3/2.0 (-1) | 2,100 (+12%) | 6mo | $160,000 | $76 | 51 |
Match score weights: distance 35% · size 25% · config 20% · recency 20%. Top-matched comps best support the ARV.
Projected returns pro-forma
-3.0% appreciation · 0.73% rent growth · sell at horizon
- IRR
- 3.2%
- Equity multiple
- 1.12×
- Total profit
- $5,329
- Equity at exit
- $23,857
- IRR
- 10.3%
- Equity multiple
- 1.71×
- Total profit
- $31,780
- Equity at exit
- $13,834
Cash invested: $44,800 (down + closing). Projections, not guarantees.
Landlord ↔ Tenant lean methodology
- Overall (STATE)
- 87 Strongly Landlord-Friendly
- State Texas
- 87 Strongly Landlord-Friendly · R+5
- County
- — inherits STATE
- City
- — inherits STATE
ZIP-level market 76087
- Rents YoY
- 0.7%
- Active inventory
- 661
- Price-to-rent
- 5.8×
Monthly cashflow live
- Estimated rent
- $2,282 medium interval (Pro) →
- Mortgage (P&I)
- −$839
- Tax from tax record
- −$320 /mo · $3,843/yr
- Insurance
- −$67
- HOA
- −$8
- Vacancy / Maint / Mgmt
- −$479
- Net cashflow
- $569
Break-even live
Sensitivity live
| Price | -10% $660 | -5% $614 | +0% $569 | +5% $524 | +10% $478 |
|---|---|---|---|---|---|
| Rent | -10% $389 | -5% $479 | +0% $569 | +5% $659 | +10% $749 |
| Rate | -1.0pp $650 | -0.5pp $610 | base $569 | +0.5pp $528 | +1.0pp $485 |
UW: 25.0% down · 7.5% · 30yr · 1.5% tax · 5.0% vac · 8.0% maint · 8.0% mgmt
Financing live
Cash to close
- Down payment
- $40,000
- Closing costs
- $4,800
- Reserves months
- —
- Total cash needed
- —
Loan-product check · same deal, 3 products live
Conventional
25% down · 7.5% · 30yr
- Down + closing
- —
- Monthly P&I
- —
- Monthly cashflow
- —
- DSCR
- —
- Eligible?
- —
Personal DTI + credit; lowest rate.
DSCR
20% down · 8.5% · 30yr
- Down + closing
- —
- Monthly P&I
- —
- Monthly cashflow
- —
- DSCR
- —
- Eligible?
- —
No personal income docs; deal must DSCR.
Hard money
10% down · 12.0% · 12mo
- Down + closing
- —
- Monthly P&I
- —
- Monthly cashflow
- —
- DSCR
- —
- Eligible?
- —
Short-term bridge; refi at stabilization.
HOA detail
- Monthly dues
- $8 · $96/yr
Listing history 27 events
-
2026-06-21days on market $160,000 Active 53 DOM
-
2026-06-18days on market $160,000 Active 50 DOM
-
2026-06-17days on market $160,000 Active 49 DOM
-
2026-06-16days on market $160,000 Active 48 DOM
-
2026-06-16price $160,000 Active 47 DOM
-
2026-06-15days on market $200,000 Active 47 DOM
-
2026-06-13days on market $200,000 Active 45 DOM
-
2026-06-09days on market $200,000 Active 41 DOM
-
2026-06-08days on market $200,000 Active 40 DOM
-
2026-06-07days on market $200,000 Active 39 DOM
-
2026-06-04days on market $200,000 Active 36 DOM
-
2026-06-03days on market $200,000 Active 35 DOM
-
2026-06-02days on market $200,000 Active 34 DOM
-
2026-06-01days on market $200,000 Active 33 DOM
-
2026-05-31days on market $200,000 Active 32 DOM
-
2026-04-29$200,000 Active 876-char remark
-
2024-07-15soldstatus
-
2024-04-30status Pending
-
2024-04-22historical Active Option Contract
-
2024-04-22historical
-
2024-04-15price $222,222
-
2024-03-20price $224,900
-
2024-03-04price $229,900
-
2024-02-19price $232,500
-
2024-01-30price $235,000
-
2024-01-18$240,000 Active
-
1988-03-10soldstatus
ⓘ Source: listings_history table (triggers on properties + properties_extension) + one-shot
backfill from property_details.listing_events for pre-trigger history.
Tax reassessment forecast TX · Resets to sale price
- Current annual tax
- $3,843 · $320/mo
- Projected year-2 tax
- $3,843 · $320/mo
- Expected delta
- $0/yr ($0/mo · 0.0%)
ⓘ Screening estimate from a state-policy table — verify with the county assessor before closing.
Climate risk First Street
- Flood 1/10 Low FEMA zone X (unshaded) · 0% chance over 30 yrs
- Wildfire 7/10 Severe
- Heat 7/10 Severe 7 d/yr ≥108°F today · 21 d/yr by 30 yrs out
- Wind 4/10 Moderate 21% chance of damaging wind over 30 yrs
- Air quality 2/10 Low 1 unhealthy d/yr today · 2 by 30 yrs out
Nearby sold comps map
Loading sold comps map…
Walkable amenities ~0.75 mi
Loading nearby amenities…
Taxation est. · year 1
- Rental income
- $27,387
- − Mortgage interest
- −$8,962
- − Property taxes
- −$3,843
- − Insurance
- −$800
- − Repairs & maintenance
- −$2,191
- − Management
- −$2,191
- − HOA
- −$96
- − Depreciation
- −$4,655
- Taxable income
- $4,649
- Est. tax owed @ 24.0%
- −$1,116
- After-tax cash flow
- $5,712/yr
For passive investors: Depreciation is non-cash, so a rental often shows a tax loss while cash-flowing — sheltering income. Rental losses are passive: they offset passive income freely, and up to $25,000/yr can offset ordinary (W-2) income if you actively participate and your MAGI is under $100k (phasing out to $0 by $150k); unused losses carry forward. On sale, claimed depreciation is recaptured at up to 25%, and gains may owe capital-gains tax (a 1031 exchange can defer both). Figures are a year-1 estimate at your 24.0% rate — not tax advice; consult a CPA.
Schools (NCES district)
- District
- Weatherford ISD
- NCES district ID
- 4844800
- Math proficiency
- 39% ▼ -3.00%
- Reading proficiency
- 44% ▼ -2.00%
- Median HH income
- $57,087
- Composite
- 36.4/100
- National rank
- #4679
- State rank
- #321 of 826 in TX
Livability — Western Lake
- Score
- 49/100
- State rank
- #1506
- US rank
- #25775
Category grades
Schools grade is shown separately in the Schools card above.
Census & demographics
- Census place
- Western Lake, TX
- County
- Parker County · 144,797 people
- Metro
- Dallas-Fort Worth-Arlington, TX
- Population (ZIP)
- 36,822
- Household income
- $114,306
- Rent vs Own
- Severe rent burden
- 497.0
Population outlook (Parker County) Hauer SSP2
- Today (2025)
- 147,426 people
- By 2030
- 157,863 · +7.1%
- By 2040
- 177,519 · +20.4%
- By 2050
- 194,786 · +32.1%
- By 2075
- 238,799 · +62.0%
- By 2100
- 264,126 · +79.2%
Race, ethnicity, and origin ACS 2023
- Neighborhood character
- Predominantly White (82%)
- Race & ethnicity
- White 82% Hispanic / Latino 13% Two or more races 11% Black 2%
- Hispanic origin (detail)
- Mexican 11%
- Common ancestry
- Slovak 2% Italian 2% Lithuanian 2%
- Foreign-born
- 7% · Canada, South Korea
- Languages at home
- 90% English-only · Spanish 9%
Political lean MEDSL · Parker
- 2024 margin
- Solid R (+66.4) · D 16.4% · R 82.8%
- 2008→2024 swing
- -11.2pp toward R · 2008: -55.2pp · 2024: -66.4pp
- All cycles
- 2024: R+66.4 2020: R+64.4 2016: R+67.5 2012: R+65.8 2008: R+55.2
Not yet ingested
- Civics
- —
Market trends
- HPI YoY
- ▼ -172.16%
- Current HPI
- 214.6694
- Rent YoY
- ▲ 0.73%
- Metro
- Dallas-Fort Worth-Arlington, TX
- State GDP YoY
- ▲ 3.95%
- F500 in state
- 110
Industry mix (Fortune 500 HQ in TX)
| Industry | F500 HQs | Revenue |
|---|---|---|
| Energy | 16 | $1,198B |
|
||
| Technology | 5 | $198B |
|
||
| Engineering / Construction | 4 | $72B |
|
||
| Energy Services | 3 | $60B |
|
||
| Utilities | 3 | $41B |
|
||
| Healthcare | 2 | $330B |
|
||
Price history
-33.3% since first listed13 events — show timeline
- 2026-06-15 Price Changed $160,000 NTREIS
- 2026-04-29 Listed $200,000 NTREIS
- 2024-07-15 Sold (Public Records) — Public Records
- 2024-04-30 Pending — NTREIS
- 2024-04-22 Contingent — NTREIS
- 2024-04-22 Listing Removed — NTREIS
- 2024-04-15 Price Changed $222,222 NTREIS
- 2024-03-20 Price Changed $224,900 NTREIS
- 2024-03-04 Price Changed $229,900 NTREIS
- 2024-02-19 Price Changed $232,500 NTREIS
- 2024-01-30 Price Changed $235,000 NTREIS
- 2024-01-18 Listed $240,000 NTREIS
- 1988-03-10 Sold (Public Records) — Public Records
Property tax history
+35.2%/yrLatest (2025): $3,843 · +44.5% YoY. Source: county tax records.
Cash-flow waterfall
monthlySold comps — $/sqft
last 12 mo · ≤1 miLoading sold comps…