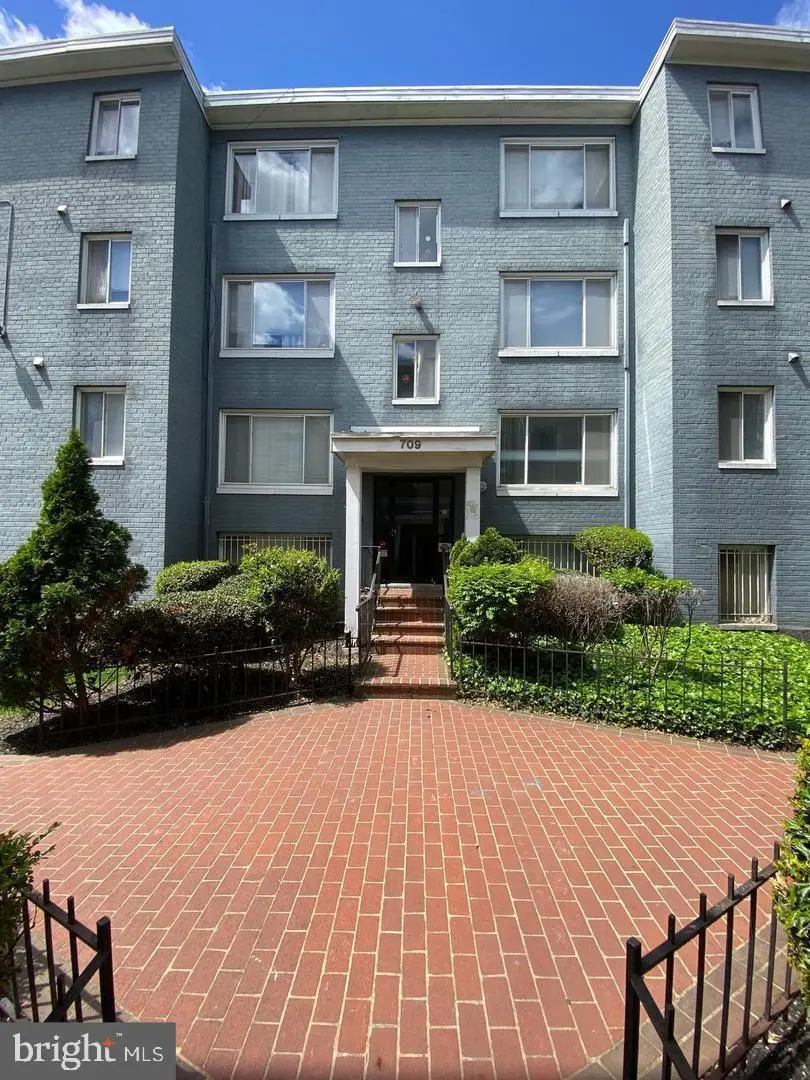
709 Brandywine St SE Unit B1 · Washington, DC
Flood risk 1/10 · Minimal
- FEMA flood zone
- X (unshaded)
- Chance of flooding over 30 yrs
- 0.0%
- Est. flood insurance / yr
- $507 – $1,088
Fire risk 3/10 · Minor
- Est. fire insurance / yr
- $631 – $1,173
Heat risk 8/10 · Major
- Hot days now (above 104°F)
- 7 days/yr
- Hot days in 30 yrs
- 16 days/yr
Wind risk 4/10 · Minor
- Chance of severe wind over 30 yrs
- 17.0%
Air-quality risk 3/10 · Minor
- Unhealthy air days now
- 2 days/yr
- Unhealthy air days in 30 yrs
- 3 days/yr
Risk factors via First Street. Map © Google.
Why this score? — see what drove the B grade
The composite is a weighted blend of 9 inputs, each scored 0–100. Each bar is that input's sub-score; the figure is the points it added to the 100-point composite (weight × sub-score).
- Cash flow +30.0/30.0
- 1% rule +10.0/10.0
- DSCR +10.0/10.0
- ARV discount +7.5/15.0
- Livability +3.7/5.0
- Schools +3.6/10.0
- Rent growth +3.5/5.0
- Condition / age +2.5/5.0
- Appreciation +0.0/10.0
$68,800
🖨 Deal sheet 📄 Offer letter ✓ Due diligence
Listing remarks
PRICED WELL BELOW TAX ASSESSED VALUE. RENOVATE AND MAKE IT YOUR OWN. SPACIOUS 2 BEDROOM, 1 FULL BATH PROPERTY IN WASHINGTON DC. CONVENIENTLY LOCATED CLOSE TO METRO, SHOPPING, RECREATION, MINUTES TO DOWNTOWN AND MORE! PARKING SPACE P-19 CONVEYS WITH THIS UNIT. ALL OFFERS/BIDS ARE TO BE SUBMITTED VIA HUBZU.
Key facts
- $421 HOA
- Parking
- Built 1953
Property features AI
Finance
- Other: Living area recorded by assessor; Finished above-grade area recorded by assessor
- Financial info: Ownership: Condominium
- HOA & community: Monthly condo fee of $421.11; Condo fee covers common area maintenance, water, and trash
Exterior
- Parking: Assigned parking (space P-19); One assigned parking space; On-street parking available; Parking lot available
- Security: No pet allowance
- Utilities: Public water; Public sewer; Electric service for heating, cooling, and hot water
- Home design: Condominium unit/flat; Entry on floor 1; Brick construction; Above-grade and below-grade structures noted; Building name: Congress Heights
- Construction: Brick construction; Unit/flat structure
- Exterior features: Garden-style building (1–4 floors); No tidal water
Interior
- Kitchen: No kitchen appliance details provided
- Bedrooms: Two bedrooms on the main level
- Flooring: No flooring details provided
- Bathrooms: One full bathroom on the main level
- Heating & cooling: Forced air heating (electric); Central air conditioning (electric); Electric hot water
- Interior features: No basement
- Laundry & utility: Washer and dryer in unit; Washer/dryer hook up available in unit
Neighborhood map
What this means for you Summary
Snapshot
- This is a 2-bed/1.0-bath condo listed at $69k.
Deal economics
- At list price, monthly cash flow is $293 ($4k/yr) — positive.
- The deal already cash-flows at list — no discount required.
- Meets the 1% rule at list price ($2k rent vs $69k).
- Recommended offer: $68k (1.5% below list) — sets the bar for market timing.
- Cap rate 11.4% vs local median 2.5% in Washington — top-decile yield for the area; either an underpriced asset or a hidden risk that comps aren't pricing in. Stress-test before assuming the spread holds.
Location & tenants
- Location reads 73/100 on livability (#1 in DC) — a middle-class / working-renter tenant base. Strengths: amenities A+, commute A+, employment A+; Watch: crime F, cost of living F.
- District Of Columbia Public Schools (urban): math 33% / reading 40% proficiency, ranked #8 of 32 in DC (top 25%) — families likely to look elsewhere, expect single-tenant / working-renter base with shorter leases; 65% free/reduced lunch — lower-income household profile, screen leases tightly.
- Zoned schools: Ballou Hs (657 students, 0% FRL) — zoned schools average 0% FRL vs 65% district-wide (65 pts lower); this property's tenant base skews higher-income than the district average.
- Market conditions: Rents rising (+4.0%/yr); 145 active listings in the ZIP; 40 comparable units currently listed for rent nearby; rentals at typical pace (median 24d on market — plan ~3-4 weeks tenant-placement turnaround); 1,737 units permitted in District of Columbia in 2024 (1,506 in 5+ unit buildings).
- This rent runs 37% of the median local income ($49k/yr) — at the standard rent-burdened threshold; future hikes will face affordability resistance.
Forward outlook
- Local home prices are declining (-3.0%/yr); year-one equity from $476 of loan paydown is wiped out by about $2k of value loss. Plan a longer hold.
- District of Columbia County population projected at +50% by 2050 — long-run rental-demand tailwind backs the buy-and-hold thesis.
- At projected returns (-3.0% appreciation + 4.0% rent growth), your $19k cash investment doubles in ~6 years — after that, you're playing with house money.
Negotiation context
- It's been on market 24 days — a 2% lower offer ($68k) is reasonable based on typical stale-listing flexibility.
- 2 sale attempts with the ask held roughly flat each time — persistent listings suggest the price (not the market) is what's stuck; bring a comps-based counter.
Risks & watch-outs
- Watch-outs: HOA is 28% of rent; built in 1953 — expect roof / HVAC / electrical / plumbing capex.
- Climate carrying-cost: extreme-heat days projected 7→16/yr by 2055 (HVAC capex compounding) — expect insurance premiums to compound above CPI over the hold.
Questions for the listing agent
- Built in 1953 — when were the roof, HVAC, electrical panel, plumbing, and water heater last replaced?
- What does the HOA fee cover, when was the last increase, and are there any pending special assessments or reserve-fund shortfalls?
- Any open or pending special assessments — roof, HVAC, plumbing, elevator, façade? What's the per-unit balance and payoff schedule, and is the seller paying it off at close or rolling it to the buyer?
- Is there a deadline driving the sale (1031 exchange, divorce, estate, relocation)? That informs how much negotiation room exists.
- Crime grade is F in this area — have there been break-ins, vandalism, or insurance claims at this property in the last 3 years? What carrier currently insures it and at what premium?
- What's the average days-on-market for RENTAL listings here right now (not sales)? A rising rental-DOM trend means longer vacancies and softer asking-rent achievability than the comps imply.
- What's the recent tenant-quality profile in this submarket — average credit score on applications, eviction rate, late-payment / NSF rate, and stable-employment percentage? A property-management company in the area should have these aggregated.
- How much new apartment / multifamily construction is in the pipeline within 1–3 miles? Heavy new supply (>2% of stock underway) typically softens rents 12–24 months out; light construction supports rent growth.
Investment metrics
- 1% rule
- 2.19% ✓
- Cap rate
- 11.40%
- Cash-on-cash
- 18.25%
- DSCR
- 1.81
- GRM
- 3.8
CMA / ARV
No comps found within radius.
Projected returns pro-forma
-3.0% appreciation · 3.96% rent growth · sell at horizon
- IRR
- 11.9%
- Equity multiple
- 1.48×
- Total profit
- $9,259
- Equity at exit
- $10,258
- IRR
- 22.1%
- Equity multiple
- 3.04×
- Total profit
- $39,379
- Equity at exit
- $5,949
Cash invested: $19,264 (down + closing). Projections, not guarantees.
Landlord ↔ Tenant lean methodology
- Overall (CITY)
- 0 Strongly Tenant-Friendly
- State District of Columbia
- 12 Strongly Tenant-Friendly · D+43
- County
- — inherits STATE
- City Washington
- 0 Strongly Tenant-Friendly · D+43
ZIP-level market 20032
- Home prices YoY
- -15.6%
- Rents YoY
- 4.0%
- Active inventory
- 145
- Price-to-rent
- 3.8×
Monthly cashflow live
- Estimated rent
- $1,507 high interval (Pro) →
- Mortgage (P&I)
- −$361
- Tax from tax record
- −$87 /mo · $1,042/yr
- Insurance
- −$29
- HOA
- −$421
- Vacancy / Maint / Mgmt
- −$316
- Net cashflow
- $293
Break-even live
UW: 25.0% down · 7.5% · 30yr · 1.5% tax · 5.0% vac · 8.0% maint · 8.0% mgmt
Financing live
Cash to close
- Down payment
- $17,200
- Closing costs
- $2,064
- Reserves months
- —
- Total cash needed
- —
Loan-product check · same deal, 3 products live
Conventional
25% down · 7.5% · 30yr
- Down + closing
- —
- Monthly P&I
- —
- Monthly cashflow
- —
- DSCR
- —
- Eligible?
- —
Personal DTI + credit; lowest rate.
DSCR
20% down · 8.5% · 30yr
- Down + closing
- —
- Monthly P&I
- —
- Monthly cashflow
- —
- DSCR
- —
- Eligible?
- —
No personal income docs; deal must DSCR.
Hard money
10% down · 12.0% · 12mo
- Down + closing
- —
- Monthly P&I
- —
- Monthly cashflow
- —
- DSCR
- —
- Eligible?
- —
Short-term bridge; refi at stabilization.
Rent comps 40 comps
| Address | Beds | Baths | Sqft | Rent | $/sqft | DOM | Units | Dist |
|---|---|---|---|---|---|---|---|---|
| 705 Brandywine St SE #303 Washington, DC | 2.0 | 1.0 | 655 | $1,550 | $2.37 | 3d | 1 | 0.01mi |
| 701 Brandywine St SE #201 Washington, DC | 2.0 | 1.0 | 706 | $1,400 | $1.98 | 18d | 1 | 0.01mi |
| 713 Brandywine St SE Washington, DC | 2.0 | 1.0 | 707 | $1,650 | $2.33 | 24d | 1 | 0.03mi |
| 730 Brandywine St SE #104 Washington, DC | 2.0 | 1.0 | 683 | $1,350 | $1.98 | 24d | 1 | 0.07mi |
| 625 Chesapeake St SE #205 Washington, DC | 2.0 | 1.0 | 773 | $1,400 | $1.81 | 24d | 1 | 0.09mi |
| 742 Brandywine St SE Washington, DC | 1.0 | 1.0 | 599 | $1,095 | $1.83 | 4d | 1 | 0.09mi |
| 625A Chesapeake St SE Unit 101 Washington, DC | 2.0 | 1.0 | 768 | $1,400 | $1.82 | 24d | 1 | 0.10mi |
| 811 Barnaby St SE Apt 101 Washington, DC | 2.0 | 1.0 | 750 | $1,449 | $1.93 | 24d | 1 | 0.10mi |
| 811 Barnaby St SE Washington, DC | 1.0 | 1.0 | 650 | $1,275 | $1.96 | 24d | 1 | 0.10mi |
| 808 Chesapeake St SE Washington, DC | 2.0 | 1.0 | 700 | $1,700 | $2.43 | 24d | 1 | 0.14mi |
| 820 Southern Ave SE Washington, DC | 2.0–3.0 | 1.0–1.5 | 840 | $1,450 | $1.73 | 2d | 65 | 0.19mi |
| 3929 4th St SE Unit 4 Washington, DC | 2.0 | 1.0 | 852 | $1,557 | $1.83 | 24d | 1 | 0.30mi |
| 852 Barnaby St SE Washington, DC | 2.0–3.0 | 1.0–1.5 | 761 | $1,400 | $1.84 | 15d | 10 | 0.30mi |
| 310 Atlantic St SE Unit 102B Washington, DC | 2.0 | 1.0 | 859 | $1,875 | $2.18 | 5d | 1 | 0.30mi |
| 310 Atlantic St SE Washington, DC | 1.0–2.0 | 1.0 | 754 | $1,875 | $2.49 | 4d | 2 | 0.30mi |
| 306 Atlantic St SE Unit 7 Washington, DC | 2.0 | 1.0 | 989 | $1,699 | $1.72 | 18d | 1 | 0.32mi |
| 306 Atlantic St SE Unit 7 Washington, DC | 2.0 | 1.0 | 800 | $1,700 | $2.12 | 24d | 1 | 0.32mi |
| 3878 9th St SE Washington, DC | 3.0 | 1.0 | 789 | $2,000 | $2.53 | 24d | 1 | 0.33mi |
| 3868 9th St SE Washington, DC | 2.0 | 1.0 | 740 | $1,450 | $1.96 | 24d | 1 | 0.35mi |
| 4030 Livingston Rd SE Washington, DC | 2.0 | 1.0 | 1000 | $1,648 | $1.65 | 24d | 1 | 0.38mi |
| 4040 Livingston Rd SE Washington, DC | 2.0 | 1.0 | 1000 | $1,256 | $1.26 | 24d | 1 | 0.39mi |
| 607 Southern Ave SE Oxon Hill, MD | 2.0 | 1.0 | 900 | $1,199 | $1.33 | 20d | 1 | 0.43mi |
| 207 Mississippi Ave SE Washington, DC | 1.0–2.0 | 1.0–1.5 | 656 | $1,559 | $2.38 | 24d | 10 | 0.49mi |
| 3930 1st St SE Unit 301 Washington, DC | 3.0 | 1.0 | 900 | $2,200 | $2.44 | 24d | 1 | 0.53mi |
| 4641 6th St SE Washington, DC | 1.0 | 1.0 | 650 | $1,275 | $1.96 | 24d | 1 | 0.54mi |
| 1311 Southview Dr Oxon Hill, MD | 2.0 | 1.0 | 628 | $1,754 | $2.79 | 1d | 64 | 0.57mi |
| 21 Chesapeake St SE Washington, DC | 2.0 | 1.0 | 670 | $1,250 | $1.87 | 20d | 1 | 0.58mi |
| 4632 Livingston Rd SE Washington, DC | 1.0–2.0 | 1.0 | 755 | $1,329 | $1.76 | 24d | 10 | 0.58mi |
| 39 Mississippi Ave SE Washington, DC | 2.0 | 1.0 | 800 | $1,300 | $1.62 | 24d | 1 | 0.58mi |
| 101 Wayne Pl SE Washington, DC | 2.0 | 1.0 | 919 | $1,695 | $1.84 | 22d | 1 | 0.65mi |
| 2 Elmira St SE Washington, DC | 1.0 | 1.0 | 710 | $1,342 | $1.89 | 24d | 1 | 0.65mi |
| 3865 Halley Ter SE Washington, DC | 1.0 | 1.0 | 650 | $1,210 | $1.86 | 24d | 1 | 0.66mi |
| 3429 5th St SE #42 Washington, DC | 1.0 | 1.0 | 702 | $1,395 | $1.99 | 14d | 1 | 0.66mi |
| 4001 S Capitol St SW Washington, DC | 3.0 | 1.0–2.0 | 782 | $1,975 | $2.52 | 13d | 1 | 0.67mi |
| 10 Halley Pl SE Washington, DC | 2.0–3.0 | 1.0 | 906 | $1,250 | $1.38 | 24d | 3 | 0.68mi |
| 6 Galveston St SW #303 Washington, DC | 2.0 | 1.0 | 708 | $1,700 | $2.40 | 24d | 1 | 0.70mi |
| 3320 6th St SE Washington, DC | 2.0 | 1.0 | 690 | $1,398 | $2.03 | 3d | 25 | 0.71mi |
| 4721 1st St SW #203 Washington, DC | 2.0 | 1.0 | 741 | $1,600 | $2.16 | 24d | 1 | 0.72mi |
| 4725 1st St SW #102 Washington, DC | 2.0 | 1.0 | 580 | $1,850 | $3.19 | 24d | 1 | 0.72mi |
| 3730 Martin Luther King Jr Ave SE Washington, DC | 2.0 | 1.0 | 475 | $1,295 | $2.73 | 1d | 2 | 0.73mi |
HOA detail condo
- Monthly dues
- $421 · $5,052/yr
- Assessments
- None detected in remarks — confirm with the listing agent.
Listing history 8 events
-
2026-05-04status Pending
-
2026-04-10$68,800 Active
-
2026-03-17price $111,200
-
2026-03-17historical
-
2026-02-27price $116,200
-
2026-01-31price $125,000
-
2026-01-05$132,500 Active
-
2024-10-09soldstatus $132,000
ⓘ Source: listings_history table (triggers on properties + properties_extension) + one-shot
backfill from property_details.listing_events for pre-trigger history.
Tax reassessment forecast DC · Partial reset (capped growth)
- Current annual tax
- $1,042 · $87/mo
- Projected year-2 tax
- $1,042 · $87/mo
- Expected delta
- $0/yr ($0/mo · 0.0%)
ⓘ Screening estimate from a state-policy table — verify with the county assessor before closing.
Climate risk First Street
- Flood 1/10 Low FEMA zone X (unshaded) · 0% chance over 30 yrs
- Wildfire 3/10 Moderate
- Heat 8/10 Severe 7 d/yr ≥104°F today · 16 d/yr by 30 yrs out
- Wind 4/10 Moderate 17% chance of damaging wind over 30 yrs
- Air quality 3/10 Moderate 2 unhealthy d/yr today · 3 by 30 yrs out
Nearby sold comps map
Loading sold comps map…
Walkable amenities ~0.75 mi
Loading nearby amenities…
Taxation est. · year 1
- Rental income
- $18,079
- − Mortgage interest
- −$3,854
- − Property taxes
- −$1,042
- − Insurance
- −$344
- − Repairs & maintenance
- −$1,446
- − Management
- −$1,446
- − HOA
- −$5,052
- − Depreciation
- −$2,001
- Taxable income
- $2,893
- Est. tax owed @ 24.0%
- −$694
- After-tax cash flow
- $2,821/yr
For passive investors: Depreciation is non-cash, so a rental often shows a tax loss while cash-flowing — sheltering income. Rental losses are passive: they offset passive income freely, and up to $25,000/yr can offset ordinary (W-2) income if you actively participate and your MAGI is under $100k (phasing out to $0 by $150k); unused losses carry forward. On sale, claimed depreciation is recaptured at up to 25%, and gains may owe capital-gains tax (a 1031 exchange can defer both). Figures are a year-1 estimate at your 24.0% rate — not tax advice; consult a CPA.
Schools (NCES district)
- District
- District Of Columbia Public Schools
- NCES district ID
- 1100030
- Math proficiency
- 33% ▲ 3.00%
- Reading proficiency
- 40% ▲ 5.00%
- Median HH income
- $67,671
- Composite
- 35.84/100
- National rank
- #9606
- State rank
- #8 of 32 in DC
Livability — Washington
- Score
- 73/100
- State rank
- #1
- US rank
- #5327
Category grades
Schools grade is shown separately in the Schools card above.
Census & demographics
- Census place
- Washington, DC
- County
- District of Columbia · 671,873 people
- City population
- 671,873
- Metro
- Washington-Arlington-Alexandria, DC-VA-MD-WV
- Population (ZIP)
- 40,920
- Household income
- $49,139
- Rent vs Own
- Severe rent burden
- 4530.0
Population outlook (District of Columbia County) Hauer SSP2
- Today (2025)
- 821,926 people
- By 2030
- 899,517 · +9.4%
- By 2040
- 1,061,162 · +29.1%
- By 2050
- 1,231,493 · +49.8%
- By 2075
- 1,603,312 · +95.1%
- By 2100
- 1,847,141 · +124.7%
Race, ethnicity, and origin ACS 2023
- Neighborhood character
- Predominantly Black (80%)
- Race & ethnicity
- Black 80% White 8% Two or more races 7% Hispanic / Latino 5%
- Foreign-born
- 4% · Canada
- Languages at home
- 95% English-only · Spanish 3%
Political lean MEDSL · District of Columbia
- 2024 margin
- Solid D (+86.1) · D 91.2% · R 5.1% · Other 3.8%
- 2008→2024 swing
- +0.1pp no change · 2008: 85.9pp · 2024: 86.1pp
- All cycles
- 2024: D+86.1 2020: D+86.8 2016: D+88.7 2012: D+84.2 2008: D+85.9
Not yet ingested
- Civics
- —
Market trends
- HPI YoY
- ▼ -60.34%
- Current HPI
- 326.4077
- Rent YoY
- ▲ 3.96%
- Metro
- Washington-Arlington-Alexandria, DC-VA-MD-WV
- State GDP YoY
- ▲ 1.33%
- F500 in state
- 6
Industry mix (Fortune 500 HQ in DC)
| Industry | F500 HQs | Revenue |
|---|---|---|
| Financial Services | 1 | $153B |
|
||
| Life Sciences / Industrials | 1 | $25B |
|
||
| Industrial Machinery | 1 | $8B |
|
||
Price history
-47.9% since first listed8 events — show timeline
- 2026-05-04 Pending — BRIGHT MLS
- 2026-04-10 Listed $68,800 BRIGHT MLS
- 2026-03-17 Price Changed $111,200 BRIGHT MLS
- 2026-03-17 Listing Removed — BRIGHT MLS
- 2026-02-27 Price Changed $116,200 BRIGHT MLS
- 2026-01-31 Price Changed $125,000 BRIGHT MLS
- 2026-01-05 Listed $132,500 BRIGHT MLS
- 2024-10-09 Sold (Public Records) $132,000 Public Records
Property tax history
-2.3%/yrLatest (2025): $1,042 · -9.9% YoY. Source: county tax records.
Cash-flow waterfall
monthlySold comps — $/sqft
last 12 mo · ≤1 miLoading sold comps…