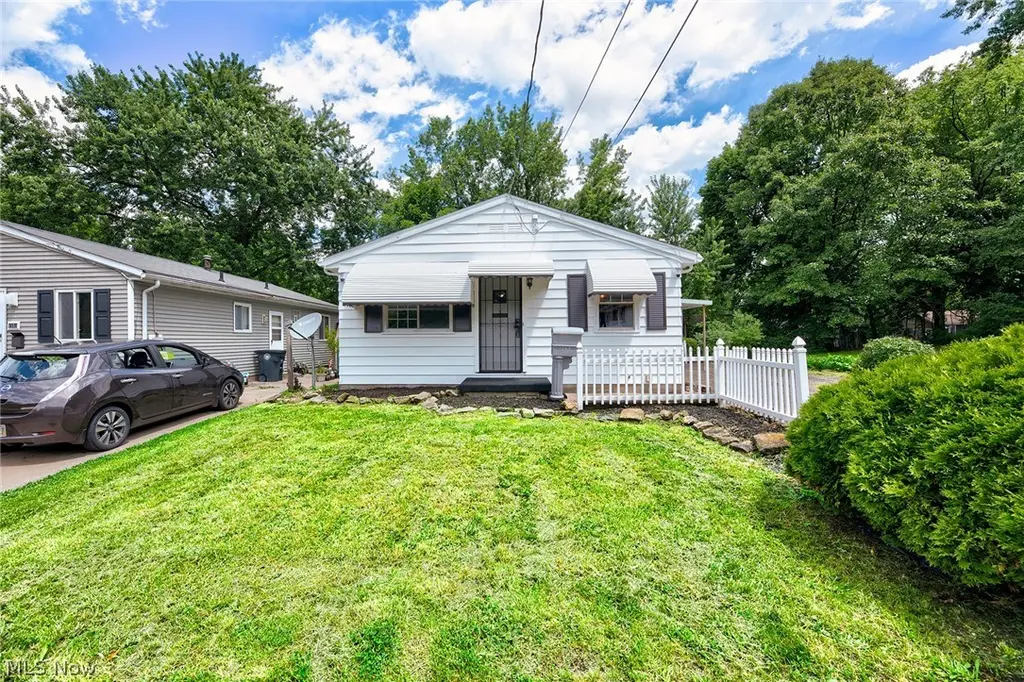
1163 Tonawanda Ave · Akron, OH
Flood risk 1/10 · Minimal
- FEMA flood zone
- X (unshaded)
- Chance of flooding over 30 yrs
- 0.0%
- Est. flood insurance / yr
- $473 – $860
Fire risk 1/10 · Minimal
- Est. fire insurance / yr
- $713 – $1,323
Heat risk 2/10 · Minimal
- Hot days now (above 97°F)
- 6 days/yr
- Hot days in 30 yrs
- 15 days/yr
Wind risk 1/10 · Minimal
- Chance of severe wind over 30 yrs
- —
Air-quality risk 3/10 · Minor
- Unhealthy air days now
- 2 days/yr
- Unhealthy air days in 30 yrs
- 4 days/yr
Risk factors via First Street. Map © Google.
Why this score? — see what drove the C+ grade
The composite is a weighted blend of 9 inputs, each scored 0–100. Each bar is that input's sub-score; the figure is the points it added to the 100-point composite (weight × sub-score).
- Cash flow +28.1/30.0
- DSCR +10.0/10.0
- 1% rule +7.3/10.0
- ARV discount +7.1/15.0
- Livability +4.0/5.0
- Rent growth +3.6/5.0
- Condition / age +2.5/5.0
- Schools +2.1/10.0
- Appreciation +0.0/10.0
$97,850
🖨 Deal sheet 📄 Offer letter ✓ Due diligence
Listing remarks MLS
Great opportunity for Investors or "Do it yourself" buyers. 3-BR ranch in Goodyear Heights. Property was on the market when it received & accepted a buyer's offer. Unknowingly, a pipe broke under bathroom sink flooding the main level. Repairs were begun but not completed. All new drywall in BR's, Bath, hallway & basement. Currently down to subflooring on main level except for kit. Still needs muddying, paint & carpet installed. The kitchen’s warm & inviting & adjoins the dining area w/ an open bar concept & large living room. There’s 3 nice sized BR’s w/ closet room to match. The large bathroom has lots of cupboard space. The Full & spacious basement, provides ample storage & is partitioned off into 4 areas. Large, beautifully aged trees adorn this expansive property which includes 2 “additional” parcel lots to the right of the main home. Ton’s of potential here for just about anything you might have in mind! Or just relax & enjoy entertaining guests outside in the gazebo & it’s surround
Key facts
- Oak cabinetry
- Countertop space
- Dining area
Tags
Property features AI
Exterior
- Parking: Carport (1 space); Driveway parking
- Utilities: Public water; Septic tank sewer
- Home design: Single-story home; Vinyl siding; Shingle roof; Home warranty included
- Construction: Vinyl siding construction; Shingle roof; Built per public records
- Exterior features: Gazebo; Driveway
Interior
- Kitchen: Range; Refrigerator
- Bedrooms: Three main-level bedrooms
- Bathrooms: One full bathroom on the main level
- Heating & cooling: Forced air gas heating; Central air conditioning
- Interior features: Unfinished basement; Basement laundry
- Laundry & utility: Laundry located in the basement
Neighborhood map
What this means for you Summary
Snapshot
- This is a 3-bed/1.0-bath single-family listed at $98k.
Deal economics
- At list price, monthly cash flow is $308 ($4k/yr) — positive.
- The deal already cash-flows at list — no discount required.
- Meets the 1% rule at list price ($1k rent vs $98k).
- Cap rate 10.1% vs local median 6.6% in Akron — top-decile yield for the area; either an underpriced asset or a hidden risk that comps aren't pricing in. Stress-test before assuming the spread holds.
Location & tenants
- Location reads 81/100 on livability (#104 in OH, #1,591 nationally) — a professional / high-income tenant draw. Strengths: amenities A+, commute A+, cost of living A+; Watch: crime F, employment F.
- Akron City (urban): math 22% / reading 30% proficiency, ranked #602 of 656 in OH (top 92%) — low school quality limits family demand, transient renter base, plan for 1-2y turnover; 66% free/reduced lunch — lower-income household profile, screen leases tightly.
- Market conditions: Rents rising fast (+4.5%/yr); 101 active listings in the ZIP; 26 comparable units currently listed for rent nearby; rentals lingering (median 44d on market — plan ~5-8 weeks vacancy on turnover, expect pricing pressure); 62% of comp listings sitting > 30 days — soft ceiling on asking rent; 1,114 units permitted in Summit County in 2024 (397 in 5+ unit buildings).
Forward outlook
- Local home prices are declining (-3.0%/yr); year-one equity from $676 of loan paydown is wiped out by about $3k of value loss. Plan a longer hold.
- Summit County population projected to shrink 6% by 2050 — rents likely to lag national; underwrite the cash flow, not the appreciation.
- At projected returns (-3.0% appreciation + 4.5% rent growth), your $27k cash investment doubles in ~8 years — after that, you're playing with house money.
Negotiation context
- Only 1 days on market — expect competitive offers; lowballing is unlikely to land.
- 4 sale attempts since 8y ago with the ask held roughly flat each time — persistent listings suggest the price (not the market) is what's stuck; bring a comps-based counter.
- Current owner paid $35k; list at $98k implies a 180% gain — meaningful room to come down on a strong offer.
Questions for the listing agent
- Built in 1972 — when were the roof, HVAC, electrical panel, plumbing, and water heater last replaced?
- Is there a deadline driving the sale (1031 exchange, divorce, estate, relocation)? That informs how much negotiation room exists.
- Crime grade is F in this area — have there been break-ins, vandalism, or insurance claims at this property in the last 3 years? What carrier currently insures it and at what premium?
- What's the average days-on-market for RENTAL listings here right now (not sales)? A rising rental-DOM trend means longer vacancies and softer asking-rent achievability than the comps imply.
- What's the recent tenant-quality profile in this submarket — average credit score on applications, eviction rate, late-payment / NSF rate, and stable-employment percentage? A property-management company in the area should have these aggregated.
- How much new for-sale + rental construction is in the pipeline within 1–3 miles? Heavy new supply typically softens prices + rents 12–24 months out; constrained supply supports both.
Investment metrics
- 1% rule
- 1.23% ✓
- Cap rate
- 10.07%
- Cash-on-cash
- 13.50%
- DSCR
- 1.60
- GRM
- 6.8
CMA / ARV
- ARV (on-the-fly)
- $96,960
- Comps found
- 12
Show comp detail 12 sales within ~0.75 mi
| Address | Dist | Beds/Ba | Sqft | Sold | Price | $/sf | Match |
|---|---|---|---|---|---|---|---|
| 1102 Tonawanda Ave | 0.12mi | 3/1.0 | 960 (0%) | 1mo | $97,000 | $101 | 94 |
| 1177 Smithfarm Ave | 0.08mi | 2/1.0 (-1) | 992 (+3%) | 2mo | $113,000 | $114 | 84 |
| 1371 Laffer Ave | 0.40mi | 3/1.0 | 960 (0%) | 7mo | $120,000 | $125 | 76 |
| 1379 Ottawa Ave | 0.38mi | 3/1.0 | 999 (+4%) | 4mo | $99,500 | $100 | 72 |
| 1082 Hazel St | 0.25mi | 3/1.0 | 1,056 (+10%) | 2mo | $112,100 | $106 | 70 |
| 1318 Arnold Ave | 0.22mi | 3/1.0 | 1,056 (+10%) | 5mo | $99,900 | $95 | 69 |
| 1267 Tioga Ave | 0.70mi | 3/1.0 | 960 (0%) | 4mo | $93,500 | $97 | 64 |
| 712 Frase Ave | 0.39mi | 3/1.5 | 1,056 (+10%) | 6mo | $113,300 | $107 | 58 |
| 191 Colony Cres | 0.72mi | 4/1.5 (+1) | 975 (+2%) | 2mo | $39,900 | $41 | 55 |
| 1364 Eastwood Ave | 0.57mi | 2/1.0 (-1) | 1,027 (+7%) | 3mo | $83,000 | $81 | 54 |
| 852 Manitou Ave | 0.64mi | 3/1.5 | 1,092 (+14%) | 1mo | $131,000 | $120 | 44 |
| 109 Kent Ct | 0.64mi | 2/1.0 (-1) | 1,075 (+12%) | 7mo | $37,500 | $35 | 39 |
Match score weights: distance 35% · size 25% · config 20% · recency 20%. Top-matched comps best support the ARV.
Projected returns pro-forma
-3.0% appreciation · 4.51% rent growth · sell at horizon
- IRR
- 5.2%
- Equity multiple
- 1.21×
- Total profit
- $5,621
- Equity at exit
- $14,590
- IRR
- 15.9%
- Equity multiple
- 2.39×
- Total profit
- $38,001
- Equity at exit
- $8,460
Cash invested: $27,398 (down + closing). Projections, not guarantees.
Landlord ↔ Tenant lean methodology
- Overall (STATE)
- 73 Landlord-Friendly
- State Ohio
- 73 Landlord-Friendly · R+6
- County
- — inherits STATE
- City
- — inherits STATE
ZIP-level market 44305
- Rents YoY
- 4.5%
- Active inventory
- 101
- Price-to-rent
- 6.8×
Monthly cashflow live
- Estimated rent
- $1,203 high interval (Pro) →
- Mortgage (P&I)
- −$513
- Tax from tax record
- −$88 /mo · $1,056/yr
- Insurance
- −$41
- HOA
- −$0
- Vacancy / Maint / Mgmt
- −$253
- Net cashflow
- $308
Break-even live
UW: 25.0% down · 7.5% · 30yr · 1.5% tax · 5.0% vac · 8.0% maint · 8.0% mgmt
Financing live
Cash to close
- Down payment
- $24,462
- Closing costs
- $2,936
- Reserves months
- —
- Total cash needed
- —
Loan-product check · same deal, 3 products live
Conventional
25% down · 7.5% · 30yr
- Down + closing
- —
- Monthly P&I
- —
- Monthly cashflow
- —
- DSCR
- —
- Eligible?
- —
Personal DTI + credit; lowest rate.
DSCR
20% down · 8.5% · 30yr
- Down + closing
- —
- Monthly P&I
- —
- Monthly cashflow
- —
- DSCR
- —
- Eligible?
- —
No personal income docs; deal must DSCR.
Hard money
10% down · 12.0% · 12mo
- Down + closing
- —
- Monthly P&I
- —
- Monthly cashflow
- —
- DSCR
- —
- Eligible?
- —
Short-term bridge; refi at stabilization.
Rent comps 26 comps
| Address | Beds | Baths | Sqft | Rent | $/sqft | DOM | Units | Dist |
|---|---|---|---|---|---|---|---|---|
| 676 Grifton Ave Akron, OH | 2.0 | 1.0 | 703 | $1,000 | $1.42 | 43d | 1 | 0.22mi |
| 680 Grifton Ave Akron, OH | 2.0 | 1.0 | 828 | $1,050 | $1.27 | 23d | 1 | 0.22mi |
| 1318 Arnold Ave Akron, OH | 3.0 | 1.0 | 1056 | $1,450 | $1.37 | 43d | 1 | 0.24mi |
| 1190 Hazel St Akron, OH | 3.0 | 1.0 | 1124 | $1,425 | $1.27 | 43d | 1 | 0.29mi |
| 237 Kryder Ave Unit 237 Akron, OH | 2.0 | 1.0 | 860 | $850 | $0.99 | 44d | 1 | 0.60mi |
| 109 Kent Ct Akron, OH | 2.0 | 1.0 | 1032 | $1,142 | $1.11 | 23d | 1 | 0.63mi |
| 208 Barder Ave Akron, OH | 3.0 | 1.0 | 924 | $1,050 | $1.14 | 43d | 1 | 0.64mi |
| 857 Kennebec Ave Akron, OH | 3.0 | 1.0 | 1008 | $1,350 | $1.34 | 44d | 1 | 0.66mi |
| 134 N Arlington St Akron, OH | 2.0 | 1.0 | 964 | $900 | $0.93 | 23d | 1 | 0.70mi |
| 797 E Market St Apt 220 Akron, OH | 2.0 | 1.5 | 1100 | $1,500 | $1.36 | 23d | 1 | 0.82mi |
| 1428 Sara Ave Akron, OH | 2.0 | 1.0 | 1080 | $1,050 | $0.97 | 14d | 1 | 0.90mi |
| 801 E Exchange St Akron, OH | 2.0 | 1.0 | 850 | $925 | $1.09 | 23d | 1 | 1.02mi |
| 167 Chittenden St #1 Akron, OH | 2.0 | 1.0 | 900 | $850 | $0.94 | 43d | 1 | 1.04mi |
| 167 Chittenden St Apt 2 Akron, OH | 2.0 | 1.0 | 900 | $825 | $0.92 | 43d | 1 | 1.05mi |
| 783 E Exchange St Unit 2nd Akron, OH | 2.0 | 1.0 | 951 | $875 | $0.92 | 23d | 1 | 1.05mi |
| 166 Chittenden St Akron, OH | 3.0 | 1.0 | 1020 | $985 | $0.97 | 43d | 1 | 1.06mi |
| 243 Watson St Akron, OH | 2.0 | 1.0 | 750 | $950 | $1.27 | 43d | 1 | 1.08mi |
| 1635 Bronson Rd Akron, OH | 3.0 | 1.0 | 1110 | $1,245 | $1.12 | 13d | 1 | 1.15mi |
| 605 E Buchtel Ave Unit 1 Akron, OH | 2.0 | 1.0 | 1000 | $695 | $0.69 | 14d | 1 | 1.15mi |
| 1628 E Market St Akron, OH | 2.0 | 1.0 | 800 | $850 | $1.06 | 43d | 1 | 1.23mi |
| 545 E Buchtel Ave Unit 1 Akron, OH | 2.0 | 1.0 | 900 | $1,300 | $1.44 | 43d | 1 | 1.26mi |
| 1820 Malasia Rd Unit 2 Akron, OH | 2.0 | 1.0 | 741 | $925 | $1.25 | 43d | 1 | 1.27mi |
| 1820 Malasia Rd Akron, OH | 2.0 | 1.0 | 741 | $895 | $1.21 | 21d | 1 | 1.27mi |
| 377 Talbot Ave Akron, OH | 2.0 | 1.0 | 1070 | $1,050 | $0.98 | 43d | 1 | 1.38mi |
| 344 Lease St Akron, OH | 3.0 | 1.0 | 1000 | $1,199 | $1.20 | 43d | 1 | 1.39mi |
| 878 Clark St Akron, OH | 3.0 | 2.0 | 1029 | $1,440 | $1.40 | 43d | 1 | 1.40mi |
Listing history 2 events
-
2026-06-18remarks 603-char remark
-
2026-06-18$97,850 Active 1 DOM
ⓘ Source: listings_history table (triggers on properties + properties_extension) + one-shot
backfill from property_details.listing_events for pre-trigger history.
Tax reassessment forecast OH · Partial reset (capped growth)
- Current annual tax
- $1,056 · $88/mo
- Projected year-2 tax
- $1,291 · $108/mo
- Expected delta
- +$235/yr (+$20/mo · 22.3%)
ⓘ Screening estimate from a state-policy table — verify with the county assessor before closing.
Climate risk First Street
- Flood 1/10 Low FEMA zone X (unshaded) · 0% chance over 30 yrs
- Wildfire 1/10 Low
- Heat 2/10 Low 6 d/yr ≥97°F today · 15 d/yr by 30 yrs out
- Wind 1/10 Low
- Air quality 3/10 Moderate 2 unhealthy d/yr today · 4 by 30 yrs out
Nearby sold comps map
Loading sold comps map…
Walkable amenities ~0.75 mi
Loading nearby amenities…
Taxation est. · year 1
- Rental income
- $14,431
- − Mortgage interest
- −$5,481
- − Property taxes
- −$1,056
- − Insurance
- −$489
- − Repairs & maintenance
- −$1,154
- − Management
- −$1,154
- − Depreciation
- −$2,847
- Taxable income
- $2,249
- Est. tax owed @ 24.0%
- −$540
- After-tax cash flow
- $3,158/yr
For passive investors: Depreciation is non-cash, so a rental often shows a tax loss while cash-flowing — sheltering income. Rental losses are passive: they offset passive income freely, and up to $25,000/yr can offset ordinary (W-2) income if you actively participate and your MAGI is under $100k (phasing out to $0 by $150k); unused losses carry forward. On sale, claimed depreciation is recaptured at up to 25%, and gains may owe capital-gains tax (a 1031 exchange can defer both). Figures are a year-1 estimate at your 24.0% rate — not tax advice; consult a CPA.
Schools (NCES district)
- District
- Akron City
- NCES district ID
- 3904348
- Math proficiency
- 22% ▼ -17.00%
- Reading proficiency
- 30% ▼ -12.00%
- Median HH income
- $33,811
- Composite
- 21.31/100
- National rank
- #8383
- State rank
- #602 of 656 in OH
Livability — Akron
- Score
- 81/100
- State rank
- #104
- US rank
- #1591
Category grades
Schools grade is shown separately in the Schools card above.
Census & demographics
- Census place
- Akron, OH
- County
- Summit County · 440,783 people
- City population
- 174,375
- Metro
- Akron, OH
- Population (ZIP)
- 21,103
- Household income
- $52,768
- Rent vs Own
- Severe rent burden
- 1021.0
Population outlook (Summit County) Hauer SSP2
- Today (2025)
- 546,583 people
- By 2030
- 544,028 · -0.5%
- By 2040
- 531,363 · -2.8%
- By 2050
- 514,923 · -5.8%
- By 2075
- 481,765 · -11.9%
- By 2100
- 432,265 · -20.9%
Race, ethnicity, and origin ACS 2023
- Neighborhood character
- Diverse neighborhood (Simpson 0.57)
- Race & ethnicity
- White 62% Black 20% Two or more races 12% Asian 5% Hispanic / Latino 2%
- Common ancestry
- Lithuanian 3% Slovak 2% Romanian 2%
- Foreign-born
- 4% · India, Philippines, Canada
- Languages at home
- 94% English-only · Other Asian/Pacific 3% Other Indo-European 1% Spanish 1%
Political lean MEDSL · Summit
- 2024 margin
- Lean D (+7.0) · D 53.0% · R 46.0%
- 2008→2024 swing
- -9.6pp toward R · 2008: 16.6pp · 2024: 7.0pp
- All cycles
- 2024: D+7.0 2020: D+9.6 2016: D+8.2 2012: D+14.8 2008: D+16.6
Not yet ingested
- Civics
- —
Market trends
- HPI YoY
- ▼ -140.39%
- Current HPI
- 190.6223
- Rent YoY
- ▲ 4.51%
- Metro
- Akron, OH
- State GDP YoY
- ▲ 1.98%
- F500 in state
- 48
Industry mix (Fortune 500 HQ in OH)
| Industry | F500 HQs | Revenue |
|---|---|---|
| Insurance | 3 | $145B |
|
||
| Industrial Machinery | 3 | $49B |
|
||
| Financial Services | 3 | $24B |
|
||
| Consumer Goods | 2 | $93B |
|
||
| Aerospace / Defense | 2 | $47B |
|
||
| Utilities | 2 | $33B |
|
||
Price history
+205.8% since first listed11 events — show timeline
- 2026-06-18 Listed $97,850 MLSNOW
- 2019-11-08 Sold (Public Records) $35,000 Public Records
- 2019-11-08 Sold (MLS) $35,000 MLSNOW
- 2019-10-24 Pending — MLSNOW
- 2019-10-18 Listed $34,900 MLSNOW
- 2019-03-19 Relisted — MLSNOW
- 2019-03-19 Listing Removed — MLSNOW
- 2019-02-18 Pending — MLSNOW
- 2019-02-15 Contingent — MLSNOW
- 2018-09-07 Listed $64,900 MLSNOW
- 1984-10-16 Sold (Public Records) $32,000 Public Records
Property tax history
-2.8%/yrLatest (2025): $1,056 · +0.2% YoY. Source: county tax records.
Cash-flow waterfall
monthlySold comps — $/sqft
last 12 mo · ≤1 miLoading sold comps…