80700 Long Rd · Deersville, OH
Flood risk 1/10 · Minimal
- FEMA flood zone
- X (unshaded)
- Chance of flooding over 30 yrs
- 0.0%
- Est. flood insurance / yr
- $507 – $1,088
Fire risk 1/10 · Minimal
- Est. fire insurance / yr
- $713 – $1,323
Heat risk 3/10 · Minor
- Hot days now (above 97°F)
- 7 days/yr
- Hot days in 30 yrs
- 18 days/yr
Wind risk 1/10 · Minimal
- Chance of severe wind over 30 yrs
- —
Air-quality risk 2/10 · Minimal
- Unhealthy air days now
- 1 days/yr
- Unhealthy air days in 30 yrs
- 1 days/yr
Risk factors via First Street. Map © Google.
Why this score? — see what drove the C grade
The composite is a weighted blend of 9 inputs, each scored 0–100. Each bar is that input's sub-score; the figure is the points it added to the 100-point composite (weight × sub-score).
- Cash flow +20.3/30.0
- ARV discount +7.5/15.0
- Appreciation +7.3/10.0
- DSCR +6.4/10.0
- 1% rule +5.4/10.0
- Schools +3.6/10.0
- Rent growth +2.5/5.0
- Livability +2.4/5.0
- Condition / age +1.0/5.0
$95,000
🖨 Deal sheet (PDF) 📄 Offer letter ✓ Due diligence
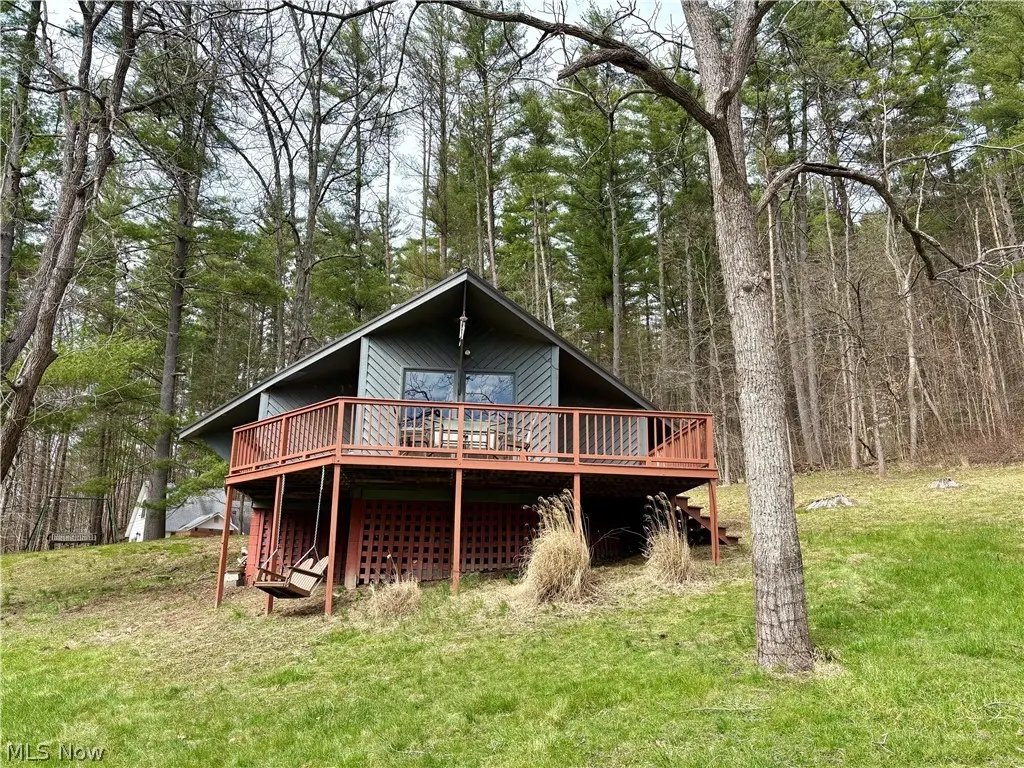
Listing remarks
The perfect get-a-way! Your own little private oasis overlooking a small, shared pond known as Paradise Valley. Just minutes from Clendening and Tappan Lakes of the MWCD. This is private land. No Mineral Rights to convey. This is a seasonal cabin and NOT a year-round home. Main source of heat is the centrally located fireplace. Cash Only buyers. "AS IS". A shared drive takes you along the pond right to the base of this cozy cabin, where you can enjoy the views and make memories from the deck or firepit. All furniture and appliances viewed in MLS posting will convey. Electric HW, 100-amp panel
Key facts
- Shared pond
- Firepit
- Cozy cabin
Tags
Neighborhood map
What this means for you Summary
Snapshot
- This is a 3-bed/1.0-bath single-family listed at $95k. Condition is rated poor.
Deal economics
- At list price, monthly cash flow is $121 ($1k/yr) — positive.
- The deal already cash-flows at list — no discount required.
- Meets the 1% rule at list price ($984 rent vs $95k).
Location & tenants
- Location reads 48/100 on livability (#1,176 in OH) — a working-class tenant base; expect higher turnover. Strengths: cost of living A+, crime A; Watch: schools F, amenities F, commute F.
- Harrison Hills City (rural): math 35% / reading 51% proficiency, ranked #522 of 656 in OH (top 80%) — families likely to look elsewhere, expect single-tenant / working-renter base with shorter leases.
- Market conditions: 10 active listings in the ZIP; 1 units permitted in Harrison County in 2024 (0 in 5+ unit buildings).
- This rent is only 17% of the median local income ($71k/yr) — well below the 30% rent-burden line; pricing power to push rent on renewal without tenant pushback.
Forward outlook
- In year one you build about $5k of equity ($657 loan paydown + $4k appreciation (4.5% local appreciation)).
- Harrison County population projected at -20% by 2050 — secular population decline; favor cash flow + early exit over multi-decade hold.
- At projected returns (4.5% appreciation + 3.0% rent growth), your $27k cash investment doubles in ~4 years — after that, you're playing with house money.
- By year 7, paydown + projected appreciation supports a ~$32k cash-out refi (75% LTV) — recoverable capital for the next deal without selling this one.
Negotiation context
- Only 8 days on market — expect competitive offers; lowballing is unlikely to land.
Questions for the listing agent
- Have any recent inspections been done? Can we get a copy of the seller's disclosures and any deferred-maintenance estimates?
- Is there a deadline driving the sale (1031 exchange, divorce, estate, relocation)? That informs how much negotiation room exists.
- Schools are F-rated, which usually means shorter tenancies and higher turnover. Who's the typical renter profile here, and what's been the actual vacancy rate?
- What's the average days-on-market for RENTAL listings here right now (not sales)? A rising rental-DOM trend means longer vacancies and softer asking-rent achievability than the comps imply.
- What's the recent tenant-quality profile in this submarket — average credit score on applications, eviction rate, late-payment / NSF rate, and stable-employment percentage? A property-management company in the area should have these aggregated.
- How much new for-sale + rental construction is in the pipeline within 1–3 miles? Heavy new supply typically softens prices + rents 12–24 months out; constrained supply supports both.
Investment metrics
- 1% rule
- 1.04% ✓
- Cap rate
- 7.82%
- Cash-on-cash
- 5.46%
- DSCR
- 1.24
- GRM
- 8.0
CMA / ARV
No comps found within radius.
Projected returns pro-forma
4.54% appreciation · 3.0% rent growth · sell at horizon
- IRR
- 16.5%
- Equity multiple
- 2.02×
- Total profit
- $27,159
- Equity at exit
- $51,216
- IRR
- 17.0%
- Equity multiple
- 3.88×
- Total profit
- $76,710
- Equity at exit
- $86,297
Cash invested: $26,600 (down + closing). Projections, not guarantees.
Landlord ↔ Tenant lean methodology
- Overall (STATE)
- 73 Landlord-Friendly
- State Ohio
- 73 Landlord-Friendly · R+6
- County
- — inherits STATE
- City
- — inherits STATE
ZIP-level market 43973
- Home prices YoY
- 2.8%
- Active inventory
- 10
- Price-to-rent
- 8.0×
Monthly cashflow live
- Estimated rent
- $984 medium interval (Pro) →
- Mortgage (P&I)
- −$498
- Tax est. 1.5%
- −$119 /mo · $1,425/yr
- Insurance
- −$40
- HOA
- −$0
- Vacancy / Maint / Mgmt
- −$207
- Net cashflow
- $121
Break-even live
Sensitivity live
| Price | -10% $187 | -5% $154 | +0% $121 | +5% $88 | +10% $55 |
|---|---|---|---|---|---|
| Rent | -10% $43 | -5% $82 | +0% $121 | +5% $160 | +10% $199 |
| Rate | -1.0pp $169 | -0.5pp $145 | base $121 | +0.5pp $96 | +1.0pp $71 |
UW: 25.0% down · 7.5% · 30yr · 1.5% tax · 5.0% vac · 8.0% maint · 8.0% mgmt
Financing live
Cash to close
- Down payment
- $23,750
- Closing costs
- $2,850
- Reserves months
- —
- Total cash needed
- —
Loan-product check · same deal, 3 products live
Conventional
25% down · 7.5% · 30yr
- Down + closing
- —
- Monthly P&I
- —
- Monthly cashflow
- —
- DSCR
- —
- Eligible?
- —
Personal DTI + credit; lowest rate.
DSCR
20% down · 8.5% · 30yr
- Down + closing
- —
- Monthly P&I
- —
- Monthly cashflow
- —
- DSCR
- —
- Eligible?
- —
No personal income docs; deal must DSCR.
Hard money
10% down · 12.0% · 12mo
- Down + closing
- —
- Monthly P&I
- —
- Monthly cashflow
- —
- DSCR
- —
- Eligible?
- —
Short-term bridge; refi at stabilization.
Listing history 2 events
-
2026-04-23status Pending
-
2026-04-15$95,000 Active
ⓘ Source: listings_history table (triggers on properties + properties_extension) + one-shot
backfill from property_details.listing_events for pre-trigger history.
Climate risk First Street
- Flood 1/10 Low FEMA zone X (unshaded) · 0% chance over 30 yrs
- Wildfire 1/10 Low
- Heat 3/10 Moderate 7 d/yr ≥97°F today · 18 d/yr by 30 yrs out
- Wind 1/10 Low
- Air quality 2/10 Low 1 unhealthy d/yr today · 1 by 30 yrs out
Nearby sold comps map
Loading sold comps map…
Walkable amenities ~0.75 mi
Loading nearby amenities…
Taxation est. · year 1
- Rental income
- $11,811
- − Mortgage interest
- −$5,321
- − Property taxes
- −$1,425
- − Insurance
- −$475
- − Repairs & maintenance
- −$945
- − Management
- −$945
- − Depreciation
- −$2,764
- Taxable loss
- −$63
- Est. tax savings @ 24.0%
- +$15
- After-tax cash flow
- $1,468/yr
For passive investors: Depreciation is non-cash, so a rental often shows a tax loss while cash-flowing — sheltering income. Rental losses are passive: they offset passive income freely, and up to $25,000/yr can offset ordinary (W-2) income if you actively participate and your MAGI is under $100k (phasing out to $0 by $150k); unused losses carry forward. On sale, claimed depreciation is recaptured at up to 25%, and gains may owe capital-gains tax (a 1031 exchange can defer both). Figures are a year-1 estimate at your 24.0% rate — not tax advice; consult a CPA.
Condition & rehab AI · 2 photos
This seasonal cabin requires extensive repairs and maintenance, including roof replacement, exterior painting, and HVAC system replacement. Landscaping and curb appeal improvements would also significantly increase its value for both resale and rental.
Repairs flagged
- Major roof — The independent image shows visible damage and missing shingles.
- Major siding — The independent image shows siding with peeling paint and visible wear.
- Major deck — The listing photos show a deck with rotting wood and missing planks.
- Major HVAC system — The listing photos show an old HVAC system with visible rust and wear.
- Major interior walls — The listing photos show walls with peeling paint and visible damage.
- Major landscaping — The listing photos show overgrown grass and a lack of landscaping. The independent image shows a shared drive and a small pond, indicating a lack of maintenance and landscaping.
Value-add opportunities
- Both roof replacement — Re-roofing would improve the home's appearance and increase its value for both resale and rental.
- Both exterior painting — Painting the exterior would improve the home's curb appeal and increase its value for both resale and rental.
- Both deck repair/replacement — Repairing or replacing the deck would improve the home's functionality and increase its value for both resale and rental.
- Both HVAC system replacement — Replacing the HVAC system would improve the home's comfort and increase its value for both resale and rental.
- Both landscaping and curb appeal — Landscaping and curb appeal improvements would enhance the home's exterior and increase its value for both resale and rental.
Renovation cost estimate screening
| Repair item | Severity | Est. cost |
|---|---|---|
| roof · The independent image shows visible damage and missing shingles. | Major | $15,000–50,000 |
| siding · The independent image shows siding with peeling paint and visible wear. | Major | $15,000–50,000 |
| deck · The listing photos show a deck with rotting wood and missing planks. | Major | $15,000–50,000 |
| HVAC system · The listing photos show an old HVAC system with visible rust and wear. | Major | $15,000–50,000 |
| interior walls · The listing photos show walls with peeling paint and visible damage. | Major | $15,000–50,000 |
| landscaping · The listing photos show overgrown grass and a lack of landscaping. The independent image shows a shared drive and a small pond, indicating a lack of maintenance and landscaping. | Major | $15,000–50,000 |
| Total estimated repair cost · 6 items | $90,000–300,000 |
Value-add ROI direction
- Both roof replacement — Re-roofing would improve the home's appearance and increase its value for both resale and rental. ↑
- Both exterior painting — Painting the exterior would improve the home's curb appeal and increase its value for both resale and rental. ↑
- Both deck repair/replacement — Repairing or replacing the deck would improve the home's functionality and increase its value for both resale and rental. ↑
- Both HVAC system replacement — Replacing the HVAC system would improve the home's comfort and increase its value for both resale and rental. ↑
- Both landscaping and curb appeal — Landscaping and curb appeal improvements would enhance the home's exterior and increase its value for both resale and rental. ↑
ⓘ Cost ranges are severity-bucket heuristics (US national rule-of-thumb). Get contractor quotes + a written scope before underwriting a rehab budget.
Schools (NCES district)
- District
- Harrison Hills City
- NCES district ID
- 3904524
- Math proficiency
- 35% ▼ -24.00%
- Reading proficiency
- 51% ▼ -12.00%
- Median HH income
- $39,642
- Composite
- 35.93/100
- National rank
- #4803
- State rank
- #522 of 656 in OH
Livability — Deersville
- Score
- 48/100
- State rank
- #1176
- US rank
- #26027
Category grades
Schools grade is shown separately in the Schools card above.
Census & demographics
- County
- Harrison · 13,333 people
- Population (ZIP)
- 2,341
- Household income
- $70,833
- Rent vs Own
Population outlook (Harrison County) Hauer SSP2
- Today (2025)
- 14,537 people
- By 2030
- 13,961 · -4.0%
- By 2040
- 12,753 · -12.3%
- By 2050
- 11,607 · -20.2%
- By 2075
- 9,299 · -36.0%
- By 2100
- 7,447 · -48.8%
Race, ethnicity, and origin ACS 2023
- Neighborhood character
- Predominantly White (97%)
- Race & ethnicity
- White 97% Hispanic / Latino 3%
- Common ancestry
- Iranian 11% Romanian 4% Serbian 1%
- Foreign-born
- 0%
- Languages at home
- 93% English-only · German/W. Germanic 6% Russian/Polish/Slavic 1% Other Indo-European 1%
Political lean MEDSL · Harrison
- 2024 margin
- Solid R (+55.2) · D 21.9% · R 77.1%
- 2008→2024 swing
- -52.8pp toward R · 2008: -2.4pp · 2024: -55.2pp
- All cycles
- 2024: R+55.2 2020: R+52.6 2016: R+48.3 2012: R+14.9 2008: R+2.4
Not yet ingested
- Civics
- —
Market trends
- HPI YoY
- ▲ 4.54%
- Current HPI
- 164.5633
- Rent YoY
- —
- Metro
- —
- State GDP YoY
- ▲ 1.98%
- F500 in state
- 48
Industry mix (Fortune 500 HQ in OH)
| Industry | F500 HQs | Revenue |
|---|---|---|
| Insurance | 3 | $145B |
|
||
| Industrial Machinery | 3 | $49B |
|
||
| Financial Services | 3 | $24B |
|
||
| Consumer Goods | 2 | $93B |
|
||
| Aerospace / Defense | 2 | $47B |
|
||
| Utilities | 2 | $33B |
|
||
Price history
2 events — show timeline
- 2026-04-23 Pending — MLSNOW
- 2026-04-15 Listed $95,000 MLSNOW
Cash-flow waterfall
monthlySold comps — $/sqft
last 12 mo · ≤1 miLoading sold comps…