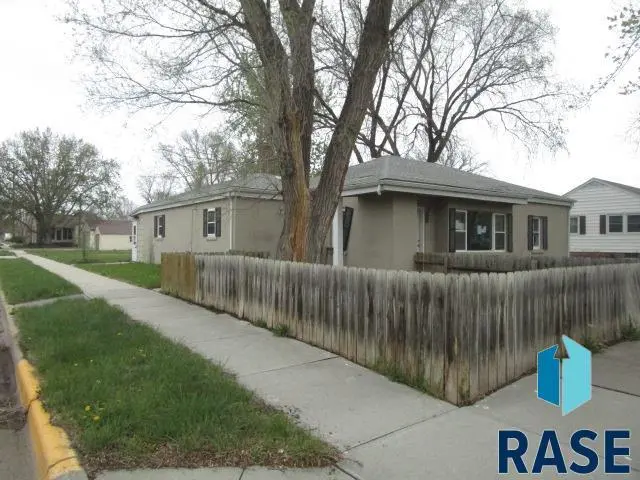
402 E 11th Ave Ave · Mitchell, SD
Flood risk 1/10 · Minimal
- FEMA flood zone
- X (unshaded)
- Chance of flooding over 30 yrs
- 0.0%
- Est. flood insurance / yr
- $507 – $1,088
Fire risk 5/10 · Moderate
- Est. fire insurance / yr
- $1,342 – $2,492
Heat risk 3/10 · Minor
- Hot days now (above 101°F)
- 7 days/yr
- Hot days in 30 yrs
- 14 days/yr
Wind risk 2/10 · Minimal
- Chance of severe wind over 30 yrs
- —
Air-quality risk 2/10 · Minimal
- Unhealthy air days now
- 1 days/yr
- Unhealthy air days in 30 yrs
- 1 days/yr
Risk factors via First Street. Map © Google.
Why this score? — see what drove the B grade
The composite is a weighted blend of 9 inputs, each scored 0–100. Each bar is that input's sub-score; the figure is the points it added to the 100-point composite (weight × sub-score).
- Cash flow +30.0/30.0
- 1% rule +10.0/10.0
- DSCR +10.0/10.0
- ARV discount +7.5/15.0
- Schools +4.9/10.0
- Livability +3.9/5.0
- Rent growth +2.5/5.0
- Condition / age +2.5/5.0
- Appreciation +0.0/10.0
$73,500
🖨 Deal sheet (PDF) 📄 Offer letter ✓ Due diligence
Listing remarks MLS
Charming starter home or possible investment property. This home offers main floor living throughout with a zero stair entry. It sits on a large corner lot with a ton of yard space including a 2 stall garage. Many improvements have been made throughout, including new tile floors, carpets, new kit. counters, large sink, backsplash and pantry that make this updated home a must see.
Key facts
- Main level living
- Huge garage
- Living room
Tags
Property features AI
Exterior
- Parking: Detached 2-car garage (30 x 28)
- Utilities: Public water; Public sewer
- Home design: Single-family ranch-style residence; Above-grade living area present
- Construction: Synthetic stucco exterior; Slab foundation; Composition roof; Built as a single-story ranch
- Exterior features: Corner lot; Land is owned
Interior
- Bedrooms: Bedrooms located on the main level
- Flooring: Carpet flooring
- Bathrooms: 1 full bathroom
- Heating & cooling: Hot water heating; One water heater
- Interior features: Three or more bedrooms on the same level; 7 total rooms; No basement
Neighborhood map
What this means for you Summary
Snapshot
- This is a 4-bed/1.0-bath single-family listed at $74k.
Deal economics
- At list price, monthly cash flow is $420 ($5k/yr) — positive.
- The deal already cash-flows at list — no discount required.
- Meets the 1% rule at list price ($1k rent vs $74k).
- Recommended offer: $71k (3.0% below list) — sets the bar for market timing.
- Cap rate 13.1% vs local median 2.5% in Mitchell — top-decile yield for the area; either an underpriced asset or a hidden risk that comps aren't pricing in. Stress-test before assuming the spread holds.
Location & tenants
- Location reads 77/100 on livability (#18 in SD, #2,969 nationally) — a middle-class / working-renter tenant base. Strengths: cost of living A+, housing A+, health & safety A+; Watch: employment C-, amenities D+, commute F.
- Mitchell School District 17-2 (town): math 55% / reading 62% proficiency, ranked #11 of 59 in SD (top 19%) — acceptable for families but not a draw, mixed tenant base, ~2y average lease.
- Zoned schools: Gertie Belle Rogers Elementary - 04 (math 52% / reading 52%, grade C-, #98 of 253 statewide, top 42%, 390 students, 37% FRL).
- Market conditions: 136 active listings in the ZIP; 12 comparable units currently listed for rent nearby; rentals lingering (median 45d on market — plan ~5-8 weeks vacancy on turnover, expect pricing pressure); 100% of comp listings sitting > 30 days — soft ceiling on asking rent; 48 units permitted in Davison County in 2024 (0 in 5+ unit buildings).
Forward outlook
- Local home prices are declining (-3.0%/yr); year-one equity from $508 of loan paydown is wiped out by about $2k of value loss. Plan a longer hold.
- Davison County population projected at +7% by 2050 — modest demand growth; plan on rents tracking national, not racing it.
- At projected returns (-3.0% appreciation + 3.0% rent growth), your $21k cash investment doubles in ~5 years — after that, you're playing with house money.
Negotiation context
- It's been on market 33 days — a 3% lower offer ($71k) is reasonable based on typical stale-listing flexibility.
- 2 sale attempts since 5y ago with the ask held roughly flat each time — persistent listings suggest the price (not the market) is what's stuck; bring a comps-based counter.
Risks & watch-outs
- Watch-outs: property tax is 3.4% of price; built in 1940 — expect roof / HVAC / electrical / plumbing capex.
- Climate carrying-cost: moderate wildfire risk — expect insurance premiums to compound above CPI over the hold.
Questions for the listing agent
- It's been on market 33 days. Have you received any prior offers? Is the seller open to a 3% concession, seller financing, or rate buy-down credit?
- Built in 1940 — when were the roof, HVAC, electrical panel, plumbing, and water heater last replaced?
- Property tax is high relative to price — has the assessment been appealed recently, and will the sale trigger a re-assessment?
- Is there a deadline driving the sale (1031 exchange, divorce, estate, relocation)? That informs how much negotiation room exists.
- What's the average days-on-market for RENTAL listings here right now (not sales)? A rising rental-DOM trend means longer vacancies and softer asking-rent achievability than the comps imply.
- What's the recent tenant-quality profile in this submarket — average credit score on applications, eviction rate, late-payment / NSF rate, and stable-employment percentage? A property-management company in the area should have these aggregated.
- How much new for-sale + rental construction is in the pipeline within 1–3 miles? Heavy new supply typically softens prices + rents 12–24 months out; constrained supply supports both.
Investment metrics
- 1% rule
- 1.80% ✓
- Cap rate
- 13.14%
- Cash-on-cash
- 24.47%
- DSCR
- 2.09
- GRM
- 4.6
CMA / ARV
- ARV (on-the-fly)
- $200,361
- Comps found
- 12
Show comp detail 12 sales within ~0.75 mi
| Address | Dist | Beds/Ba | Sqft | Sold | Price | $/sf | Match |
|---|---|---|---|---|---|---|---|
| 310 E 13th Ave | 0.15mi | 3/2.0 (-1) | 1,442 (+2%) | 1mo | $252,000 | $175 | 81 |
| 309 E 9th Ave | 0.17mi | 3/2.0 (-1) | 1,512 (+6%) | 1mo | $161,000 | $106 | 72 |
| 924 E 4th Ave | 0.65mi | 4/1.0 | 1,409 (-1%) | 7mo | $198,500 | $141 | 62 |
| 909 E 12th Ave | 0.36mi | 3/2.0 (-1) | 1,406 (-1%) | 12mo | $265,000 | $188 | 62 |
| 709 E 5th Ave Ave | 0.52mi | 3/1.5 (-1) | 1,443 (+2%) | 10mo | $75,000 | $52 | 58 |
| 504 E 4th Ave | 0.51mi | 3/1.5 (-1) | 1,379 (-3%) | 13mo | $195,000 | $141 | 53 |
| 623 E 5th Ave | 0.50mi | 3/2.0 (-1) | 1,464 (+3%) | 12mo | $200,000 | $137 | 52 |
| 609 E 3rd St | 0.62mi | 3/1.5 (-1) | 1,347 (-5%) | 13mo | $228,000 | $169 | 45 |
| 608 W 14th Ave | 0.64mi | 3/2.0 (-1) | 1,349 (-5%) | 10mo | $115,000 | $85 | 44 |
| 624 E 4th Ave | 0.54mi | 3/1.5 (-1) | 1,497 (+5%) | 18mo | $205,000 | $137 | 44 |
| 1705 N Wisconsin St | 0.74mi | 3/2.0 (-1) | 1,510 (+6%) | 5mo | $240,000 | $159 | 42 |
| 617 N Wisconsin St | 0.67mi | 3/2.5 (-1) | 1,606 (+13%) | 2mo | $209,000 | $130 | 34 |
Match score weights: distance 35% · size 25% · config 20% · recency 20%. Top-matched comps best support the ARV.
Projected returns pro-forma
-3.0% appreciation · 3.0% rent growth · sell at horizon
- IRR
- 17.9%
- Equity multiple
- 1.72×
- Total profit
- $14,907
- Equity at exit
- $10,959
- IRR
- 26.4%
- Equity multiple
- 3.32×
- Total profit
- $47,769
- Equity at exit
- $6,355
Cash invested: $20,580 (down + closing). Projections, not guarantees.
Landlord ↔ Tenant lean methodology
- Overall (STATE)
- 83 Strongly Landlord-Friendly
- State South Dakota
- 83 Strongly Landlord-Friendly · R+16
- County
- — inherits STATE
- City
- — inherits STATE
ZIP-level market 57301
- Active inventory
- 136
- Price-to-rent
- 4.6×
Monthly cashflow live
- Estimated rent
- $1,324 high interval (Pro) →
- Mortgage (P&I)
- −$385
- Tax from tax record
- −$210 /mo · $2,524/yr
- Insurance
- −$31
- HOA
- −$0
- Vacancy / Maint / Mgmt
- −$278
- Net cashflow
- $420
Break-even live
Sensitivity live
| Price | -10% $461 | -5% $440 | +0% $420 | +5% $399 | +10% $378 |
|---|---|---|---|---|---|
| Rent | -10% $315 | -5% $367 | +0% $420 | +5% $472 | +10% $524 |
| Rate | -1.0pp $457 | -0.5pp $438 | base $420 | +0.5pp $401 | +1.0pp $381 |
UW: 25.0% down · 7.5% · 30yr · 1.5% tax · 5.0% vac · 8.0% maint · 8.0% mgmt
Financing live
Cash to close
- Down payment
- $18,375
- Closing costs
- $2,205
- Reserves months
- —
- Total cash needed
- —
Loan-product check · same deal, 3 products live
Conventional
25% down · 7.5% · 30yr
- Down + closing
- —
- Monthly P&I
- —
- Monthly cashflow
- —
- DSCR
- —
- Eligible?
- —
Personal DTI + credit; lowest rate.
DSCR
20% down · 8.5% · 30yr
- Down + closing
- —
- Monthly P&I
- —
- Monthly cashflow
- —
- DSCR
- —
- Eligible?
- —
No personal income docs; deal must DSCR.
Hard money
10% down · 12.0% · 12mo
- Down + closing
- —
- Monthly P&I
- —
- Monthly cashflow
- —
- DSCR
- —
- Eligible?
- —
Short-term bridge; refi at stabilization.
Rent comps 12 comps
| Address | Beds | Baths | Sqft | Rent | $/sqft | DOM | Units | Dist |
|---|---|---|---|---|---|---|---|---|
| 910 N Winsor St Mitchell, SD | 3.0 | 1.0 | 996 | $1,300 | $1.31 | 45d | 1 | 0.31mi |
| 122 W 9th Ave Unit 122 1/2 Mitchell, SD | 3.0 | 1.0 | 965 | $1,000 | $1.04 | 45d | 1 | 0.32mi |
| 420 E 6th Ave Unit 2 (back) Mitchell, SD | 3.0 | 1.0 | 1542 | $1,200 | $0.78 | 45d | 1 | 0.36mi |
| 401 W 11th Ave Mitchell, SD | 3.0 | 1.0 | 1196 | $1,400 | $1.17 | 45d | 1 | 0.45mi |
| 605 W 10th Ave Mitchell, SD | 4.0 | 1.0 | 1200 | $1,450 | $1.21 | 45d | 1 | 0.61mi |
| 933 E 5th Ave Mitchell, SD | 3.0 | 1.0 | 1138 | $1,450 | $1.27 | 45d | 1 | 0.62mi |
| 509 E 1st Ave Mitchell, SD | 3.0 | 1.0 | 1425 | $1,350 | $0.95 | 45d | 1 | 0.75mi |
| 316 W 2nd Ave Mitchell, SD | 4.0 | 2.0 | 1726 | $1,450 | $0.84 | 45d | 1 | 0.77mi |
| 623 E Hanson Ave Mitchell, SD | 3.0 | 1.0 | 1023 | $1,200 | $1.17 | 45d | 1 | 0.83mi |
| 310 S Edmunds St Mitchell, SD | 4.0 | 1.0 | 1399 | $1,450 | $1.04 | 45d | 1 | 1.01mi |
| 1803 E 1st Ave Mitchell, SD | 3.0 | 1.0 | 960 | $1,100 | $1.15 | 45d | 1 | 1.28mi |
| 111 E Juniper Ave Unit 9 Mitchell, SD | 3.0 | 2.5 | 1737 | $1,950 | $1.12 | 45d | 1 | 1.50mi |
Listing history 21 events
-
2026-06-21days on market $73,500 Active 33 DOM
-
2026-06-19days on market $73,500 Active 31 DOM
-
2026-06-18days on market $73,500 Active 30 DOM
-
2026-06-17days on market $73,500 Active 29 DOM
-
2026-06-16days on market $73,500 Active 28 DOM
-
2026-06-15days on market $73,500 Active 27 DOM
-
2026-06-14days on market $73,500 Active 25 DOM
-
2026-06-12days on market $73,500 Active 24 DOM
-
2026-06-09days on market $73,500 Active 21 DOM
-
2026-06-08days on market $73,500 Active 20 DOM
-
2026-06-07days on market $73,500 Active 19 DOM
-
2026-06-05days on market $73,500 Active 17 DOM
-
2026-06-04days on market $73,500 Active 15 DOM
-
2026-06-02days on market $73,500 Active 14 DOM
-
2026-06-01days on market $73,500 Active 13 DOM
-
2026-05-31days on market $73,500 Active 12 DOM
-
2026-05-31days on market $73,500 Active 11 DOM
-
2026-05-18$73,500 Active
-
2021-07-09soldstatus $138,000 382-char remark
Show marketing remark (382 chars)
Charming starter home or possible investment property. This home offers main floor living throughout with a zero stair entry. It sits on a large corner lot with a ton of yard space including a 2 stall garage. Many improvements have been made throughout, including new tile floors, carpets, new kit. counters, large sink, backsplash and pantry that make this updated home a must see.
-
2021-04-08$140,000 382-char remark
Show marketing remark (382 chars)
Charming starter home or possible investment property. This home offers main floor living throughout with a zero stair entry. It sits on a large corner lot with a ton of yard space including a 2 stall garage. Many improvements have been made throughout, including new tile floors, carpets, new kit. counters, large sink, backsplash and pantry that make this updated home a must see.
-
2019-08-01soldstatus $52,000
ⓘ Source: listings_history table (triggers on properties + properties_extension) + one-shot
backfill from property_details.listing_events for pre-trigger history.
Tax reassessment forecast SD · Resets to sale price
- Current annual tax
- $2,524 · $210/mo
- Projected year-2 tax
- $2,524 · $210/mo
- Expected delta
- $0/yr ($0/mo · -0.0%)
ⓘ Screening estimate from a state-policy table — verify with the county assessor before closing.
Climate risk First Street
- Flood 1/10 Low FEMA zone X (unshaded) · 0% chance over 30 yrs
- Wildfire 5/10 Major
- Heat 3/10 Moderate 7 d/yr ≥101°F today · 14 d/yr by 30 yrs out
- Wind 2/10 Low
- Air quality 2/10 Low 1 unhealthy d/yr today · 1 by 30 yrs out
Nearby sold comps map
Loading sold comps map…
Walkable amenities ~0.75 mi
Loading nearby amenities…
Taxation est. · year 1
- Rental income
- $15,889
- − Mortgage interest
- −$4,117
- − Property taxes
- −$2,524
- − Insurance
- −$368
- − Repairs & maintenance
- −$1,271
- − Management
- −$1,271
- − Depreciation
- −$2,138
- Taxable income
- $4,200
- Est. tax owed @ 24.0%
- −$1,008
- After-tax cash flow
- $4,027/yr
For passive investors: Depreciation is non-cash, so a rental often shows a tax loss while cash-flowing — sheltering income. Rental losses are passive: they offset passive income freely, and up to $25,000/yr can offset ordinary (W-2) income if you actively participate and your MAGI is under $100k (phasing out to $0 by $150k); unused losses carry forward. On sale, claimed depreciation is recaptured at up to 25%, and gains may owe capital-gains tax (a 1031 exchange can defer both). Figures are a year-1 estimate at your 24.0% rate — not tax advice; consult a CPA.
Schools (NCES district)
- District
- Mitchell School District 17-2
- NCES district ID
- 4648390
- Math proficiency
- 55% ▬ 0.00%
- Reading proficiency
- 62% ▲ 5.00%
- Median HH income
- $45,912
- Composite
- 49.42/100
- National rank
- #2008
- State rank
- #11 of 59 in SD
Livability — Mitchell
- Score
- 77/100
- State rank
- #18
- US rank
- #2969
Category grades
Schools grade is shown separately in the Schools card above.
Census & demographics
- Census place
- Mitchell, SD
- County
- Davison County · 19,104 people
- City population
- 19,104
- Metro
- Mitchell, SD
- Population (ZIP)
- 19,104
- Household income
- $65,620
- Rent vs Own
- Severe rent burden
- 537.0
Population outlook (Davison County) Hauer SSP2
- Today (2025)
- 20,529 people
- By 2030
- 20,856 · +1.6%
- By 2040
- 21,415 · +4.3%
- By 2050
- 21,925 · +6.8%
- By 2075
- 24,245 · +18.1%
- By 2100
- 29,222 · +42.3%
Race, ethnicity, and origin ACS 2023
- Neighborhood character
- Predominantly White (89%)
- Race & ethnicity
- White 89% Hispanic / Latino 5% Native American 4% Two or more races 3%
- Common ancestry
- Portuguese 10% Iranian 7% Lithuanian 3%
- Foreign-born
- 2% · Canada
- Languages at home
- 96% English-only · Spanish 2%
Political lean MEDSL · Davison
- 2024 margin
- Solid R (+37.8) · D 29.9% · R 67.7% · Other 2.5%
- 2008→2024 swing
- -23.8pp toward R · 2008: -13.9pp · 2024: -37.8pp
- All cycles
- 2024: R+37.8 2020: R+35.1 2016: R+35.2 2012: R+21.5 2008: R+13.9
Not yet ingested
- Civics
- —
Market trends
- HPI YoY
- ▼ -136.01%
- Current HPI
- 179.7909
- Rent YoY
- —
- Metro
- Mitchell, SD
- State GDP YoY
- ▲ 0.70%
- F500 in state
- 2
Industry mix (Fortune 500 HQ in SD)
| Industry | F500 HQs | Revenue |
|---|---|---|
| Utilities | 1 | $1B |
|
||
Price history
+41.3% since first listed4 events — show timeline
- 2026-05-18 Listed $73,500 REALTOR® Association of the Sioux Empire
- 2021-07-09 Sold (MLS) $138,000 MBOR
- 2021-04-08 Listed $140,000 MBOR
- 2019-08-01 Sold (Public Records) $52,000 Public Records
Property tax history
+8.8%/yrLatest (2025): $2,524 · +47.1% YoY. Source: county tax records.
Cash-flow waterfall
monthlySold comps — $/sqft
last 12 mo · ≤1 miLoading sold comps…