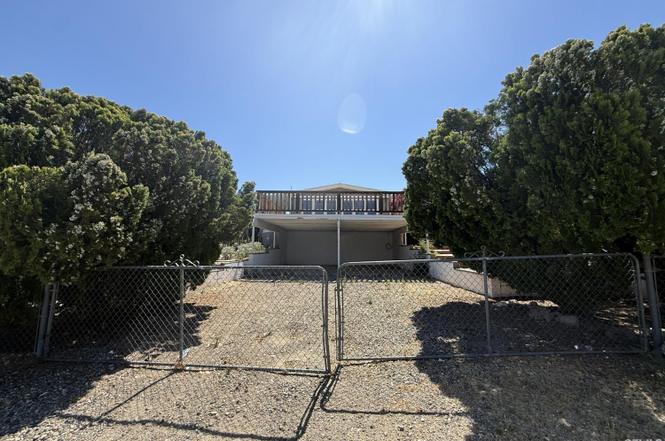
5024 Shawnee · Weldon, CA
Flood risk 1/10 · Minimal
- FEMA flood zone
- A
- Chance of flooding over 30 yrs
- 0.0%
- Est. flood insurance / yr
- $1,009 – $1,996
Fire risk 8/10 · Major
- Est. fire insurance / yr
- $659 – $1,223
Heat risk 7/10 · Major
- Hot days now (above 94°F)
- 6 days/yr
- Hot days in 30 yrs
- 16 days/yr
Wind risk 1/10 · Minimal
- Chance of severe wind over 30 yrs
- —
Air-quality risk 9/10 · Severe
- Unhealthy air days now
- 19 days/yr
- Unhealthy air days in 30 yrs
- 21 days/yr
Risk factors via First Street. Map © Google.
Why this score? — see what drove the A- grade
The composite is a weighted blend of 9 inputs, each scored 0–100. Each bar is that input's sub-score; the figure is the points it added to the 100-point composite (weight × sub-score).
- Cash flow +30.0/30.0
- ARV discount +15.0/15.0
- DSCR +10.0/10.0
- Appreciation +9.3/10.0
- 1% rule +8.5/10.0
- Schools +2.9/10.0
- Rent growth +2.5/5.0
- Condition / age +2.5/5.0
- Livability +2.4/5.0
$99,900
🖨 Deal sheet (PDF) 📄 Offer letter ✓ Due diligence
Listing remarks MLS
Opportunity awaits in Weldon! This mountain-view manufactured home offers endless potential for investors, vacation home buyers, outdoor enthusiasts, or those seeking a full-time residence. The open-concept floor plan features a spacious living area, updated cabinetry, wood-look flooring, and a large elevated deck showcasing panoramic mountain views. Covered parking beneath the home, low-maintenance landscaping, and multiple outdoor spaces provide additional value-add opportunities. Conveniently located near Lake Isabella, the Kern River, hiking trails, fishing, boating, and year-round recreation.
Key facts
- Wood-look flooring
- Covered parking
- Updated cabinetry
Tags
Property features AI
Finance
- Other: Single-unit property; No ADU; No common walls
- HOA & community: Rural community
Exterior
- Utilities: Public sewer; District/public water
- Home design: Manufactured house; Single-story; Entry at front
- Construction: Certified 433a foundation; Year built source: Assessor
- Exterior features: Front yard; No pool
Interior
- Kitchen: Kitchen (appliances not specified)
- Bedrooms: Three main-level bedrooms
- Bathrooms: Two full bathrooms (main level)
- Heating & cooling: Central furnace heating
- Interior features: Front entry; One-level home; Living room; Family room; Has fireplace in the living room; Has view
- Laundry & utility: Inside laundry
Neighborhood map
What this means for you Summary
Snapshot
- This is a 3-bed/2.0-bath manufactured listed at $100k.
Deal economics
- At list price, monthly cash flow is $252 ($3k/yr) — positive.
- The deal already cash-flows at list — no discount required.
- Meets the 1% rule at list price ($1k rent vs $100k).
- Cap rate 10.8% vs local median 5.0% in Weldon — top-decile yield for the area; either an underpriced asset or a hidden risk that comps aren't pricing in. Stress-test before assuming the spread holds.
Location & tenants
- Location reads 48/100 on livability (#1,218 in CA) — a working-class tenant base; expect higher turnover. Strengths: cost of living A-, housing B+; Watch: schools F, amenities F, commute F.
- South Fork Union (rural): math 25% / reading 40% proficiency, ranked #1,016 of 1,400 in CA (top 73%) — families likely to look elsewhere, expect single-tenant / working-renter base with shorter leases; 67% free/reduced lunch — lower-income household profile, screen leases tightly.
- Market conditions: 43 active listings in the ZIP; 3,244 units permitted in Kern County in 2024 (73 in 5+ unit buildings).
Forward outlook
- In year one you build about $9k of equity ($691 loan paydown + $9k appreciation (8.7% local appreciation)).
- Kern County population projected at +17% by 2050 — long-run rental-demand tailwind backs the buy-and-hold thesis.
- At projected returns (8.7% appreciation + 3.0% rent growth), your $28k cash investment doubles in ~3 years — after that, you're playing with house money.
- By year 4, paydown + projected appreciation supports a ~$33k cash-out refi (75% LTV) — recoverable capital for the next deal without selling this one.
Negotiation context
- Only 3 days on market — expect competitive offers; lowballing is unlikely to land.
- 9 sale attempts since 16y ago with the ask held roughly flat each time — persistent listings suggest the price (not the market) is what's stuck; bring a comps-based counter.
Risks & watch-outs
- Watch-outs: flood insurance adds $125/mo.
- Climate carrying-cost: in FEMA flood zone A (mandatory federal flood insurance); severe wildfire risk; extreme-heat days projected 6→16/yr by 2055 (HVAC capex compounding) — expect insurance premiums to compound above CPI over the hold.
Questions for the listing agent
- Built in 1979 — when were the roof, HVAC, electrical panel, plumbing, and water heater last replaced?
- What's the actual annual flood-insurance premium (NFIP or private), and is the property in a SFHA with mandatory coverage?
- Is there a deadline driving the sale (1031 exchange, divorce, estate, relocation)? That informs how much negotiation room exists.
- Schools are F-rated, which usually means shorter tenancies and higher turnover. Who's the typical renter profile here, and what's been the actual vacancy rate?
- What's the average days-on-market for RENTAL listings here right now (not sales)? A rising rental-DOM trend means longer vacancies and softer asking-rent achievability than the comps imply.
- What's the recent tenant-quality profile in this submarket — average credit score on applications, eviction rate, late-payment / NSF rate, and stable-employment percentage? A property-management company in the area should have these aggregated.
- How much new for-sale + rental construction is in the pipeline within 1–3 miles? Heavy new supply typically softens prices + rents 12–24 months out; constrained supply supports both.
Investment metrics
- 1% rule
- 1.35% ✓
- Cap rate
- 10.83%
- Cash-on-cash
- 16.19%
- DSCR
- 1.72
- GRM
- 6.2
CMA / ARV
- ARV (on-the-fly)
- $159,840
- Comps found
- 4
Show comp detail 4 sales within ~0.75 mi
| Address | Dist | Beds/Ba | Sqft | Sold | Price | $/sf | Match |
|---|---|---|---|---|---|---|---|
| 5109 Shawnee Dr | 0.10mi | 2/2.0 (-1) | 1,440 (0%) | 5mo | $160,000 | $111 | 86 |
| 5037 Shawnee Rd | 0.05mi | 3/2.0 | 1,344 (-7%) | 5mo | $160,000 | $119 | 83 |
| 5021 Cherokee Ct | 0.02mi | 3/2.0 | 1,404 (-2%) | 19mo | $150,000 | $107 | 79 |
| 9105 Navajo Ave | 0.22mi | 2/2.0 (-1) | 1,248 (-13%) | 10mo | $128,000 | $103 | 54 |
Match score weights: distance 35% · size 25% · config 20% · recency 20%. Top-matched comps best support the ARV.
Projected returns pro-forma
8.65% appreciation · 3.0% rent growth · sell at horizon
- IRR
- 29.7%
- Equity multiple
- 3.20×
- Total profit
- $61,515
- Equity at exit
- $80,369
- IRR
- 26.3%
- Equity multiple
- 6.97×
- Total profit
- $167,088
- Equity at exit
- $163,998
Cash invested: $27,972 (down + closing). Projections, not guarantees.
Landlord ↔ Tenant lean methodology
- Overall (STATE)
- 18 Strongly Tenant-Friendly
- State California
- 18 Strongly Tenant-Friendly · D+13
- County
- — inherits STATE
- City
- — inherits STATE
ZIP-level market 93283
- Home prices YoY
- 1.9%
- Active inventory
- 43
- Price-to-rent
- 6.2×
Monthly cashflow live
- Estimated rent
- $1,352 medium interval (Pro) →
- Mortgage (P&I)
- −$524
- Tax est. 1.5%
- −$125 /mo · $1,498/yr
- Insurance
- −$42
- Flood insurance flood zone
- −$125 /mo · $1,502/yr
- HOA
- −$0
- Vacancy / Maint / Mgmt
- −$284
- Net cashflow
- $252
Break-even live
Sensitivity live
| Price | -10% $321 | -5% $287 | +0% $252 | +5% $218 | +10% $183 |
|---|---|---|---|---|---|
| Rent | -10% $145 | -5% $199 | +0% $252 | +5% $306 | +10% $359 |
| Rate | -1.0pp $302 | -0.5pp $278 | base $252 | +0.5pp $226 | +1.0pp $200 |
UW: 25.0% down · 7.5% · 30yr · 1.5% tax · 5.0% vac · 8.0% maint · 8.0% mgmt
Financing live
Cash to close
- Down payment
- $24,975
- Closing costs
- $2,997
- Reserves months
- —
- Total cash needed
- —
Loan-product check · same deal, 3 products live
Conventional
25% down · 7.5% · 30yr
- Down + closing
- —
- Monthly P&I
- —
- Monthly cashflow
- —
- DSCR
- —
- Eligible?
- —
Personal DTI + credit; lowest rate.
DSCR
20% down · 8.5% · 30yr
- Down + closing
- —
- Monthly P&I
- —
- Monthly cashflow
- —
- DSCR
- —
- Eligible?
- —
No personal income docs; deal must DSCR.
Hard money
10% down · 12.0% · 12mo
- Down + closing
- —
- Monthly P&I
- —
- Monthly cashflow
- —
- DSCR
- —
- Eligible?
- —
Short-term bridge; refi at stabilization.
Listing history 3 events
-
2026-06-21days on market $99,900 Active 3 DOM
-
2026-06-19remarks 604-char remark
-
2026-06-19$99,900 Active 1 DOM
ⓘ Source: listings_history table (triggers on properties + properties_extension) + one-shot
backfill from property_details.listing_events for pre-trigger history.
Climate risk First Street
- Flood 1/10 Low FEMA zone A · 0% chance over 30 yrs
- Wildfire 8/10 Severe
- Heat 7/10 Severe 6 d/yr ≥94°F today · 16 d/yr by 30 yrs out
- Wind 1/10 Low
- Air quality 9/10 Extreme 19 unhealthy d/yr today · 21 by 30 yrs out
Nearby sold comps map
Loading sold comps map…
Walkable amenities ~0.75 mi
Loading nearby amenities…
Taxation est. · year 1
- Rental income
- $16,219
- − Mortgage interest
- −$5,596
- − Property taxes
- −$1,498
- − Insurance
- −$2,002
- − Repairs & maintenance
- −$1,298
- − Management
- −$1,298
- − Depreciation
- −$2,906
- Taxable income
- $1,621
- Est. tax owed @ 24.0%
- −$389
- After-tax cash flow
- $2,637/yr
For passive investors: Depreciation is non-cash, so a rental often shows a tax loss while cash-flowing — sheltering income. Rental losses are passive: they offset passive income freely, and up to $25,000/yr can offset ordinary (W-2) income if you actively participate and your MAGI is under $100k (phasing out to $0 by $150k); unused losses carry forward. On sale, claimed depreciation is recaptured at up to 25%, and gains may owe capital-gains tax (a 1031 exchange can defer both). Figures are a year-1 estimate at your 24.0% rate — not tax advice; consult a CPA.
Schools (NCES district)
- District
- South Fork Union
- NCES district ID
- 0637470
- Math proficiency
- 25% ▲ 5.00%
- Reading proficiency
- 40% ▲ 5.00%
- Median HH income
- $32,532
- Composite
- 29.31/100
- National rank
- #11836
- State rank
- #1016 of 1400 in CA
Livability — Weldon
- Score
- 48/100
- State rank
- #1218
- US rank
- #26156
Category grades
Schools grade is shown separately in the Schools card above.
Census & demographics
- Census place
- Weldon, CA
- Population (ZIP)
- 2,129
Population outlook (Kern County) Hauer SSP2
- Today (2025)
- 947,286 people
- By 2030
- 978,984 · +3.3%
- By 2040
- 1,045,018 · +10.3%
- By 2050
- 1,105,232 · +16.7%
- By 2075
- 1,229,538 · +29.8%
- By 2100
- 1,238,059 · +30.7%
Race, ethnicity, and origin ACS 2023
- Neighborhood character
- Predominantly White (86%)
- Race & ethnicity
- White 86% Hispanic / Latino 11% Two or more races 7% Native American 2%
- Hispanic origin (detail)
- Mexican 7%
- Common ancestry
- Lithuanian 13% Iranian 1%
- Foreign-born
- 17% · Canada
- Languages at home
- 93% English-only · Spanish 7%
Political lean MEDSL · Kern
- 2024 margin
- Strong R (+21.1) · D 38.2% · R 59.3% · Other 2.5%
- 2008→2024 swing
- -3.3pp toward R · 2008: -17.8pp · 2024: -21.1pp
- All cycles
- 2024: R+21.1 2020: R+10.2 2016: R+15.0 2012: R+20.9 2008: R+17.8
Not yet ingested
- Civics
- —
Market trends
- HPI YoY
- ▲ 8.65%
- Current HPI
- 468.8712
- Rent YoY
- —
- Metro
- —
- State GDP YoY
- ▲ 3.21%
- F500 in state
- 116
Industry mix (Fortune 500 HQ in CA)
| Industry | F500 HQs | Revenue |
|---|---|---|
| Technology | 27 | $1,492B |
|
||
| Financial Services | 3 | $174B |
|
||
| Retail | 3 | $44B |
|
||
| Insurance | 3 | $26B |
|
||
| Media / Entertainment | 2 | $115B |
|
||
| Pharmaceuticals / Biotech | 2 | $62B |
|
||
Price history
+233.0% since first listed33 events — show timeline
- 2026-06-18 Price Changed $99,900 GEMLS
- 2026-06-18 Listed $99,900 CRMLS
- 2026-06-18 Listed $99,900,000 GEMLS
- 2025-08-16 Pending — CRMLS
- 2025-08-15 Pending — GEMLS
- 2025-08-13 Listing Removed — CRMLS
- 2025-06-26 Listed $20,000 GEMLS
- 2025-06-26 Listed $20,000 CRMLS
- 2023-06-14 Sold (Public Records) $135,000 Public Records
- 2023-06-14 Sold (MLS) $135,000 GEMLS
- 2023-06-14 Sold (MLS) $135,000 SSMLS
- 2023-05-02 Pending — SSMLS
- 2023-05-01 Pending — GEMLS
- 2023-03-03 Price Changed $135,000 SSMLS
- 2023-03-02 Price Changed $135,000 GEMLS
- 2023-02-15 Listed $139,000 GEMLS
- 2023-01-31 Listed $139,000 SSMLS
- 2019-08-16 Sold (Public Records) $91,000 Public Records
- 2019-08-16 Sold (MLS) $91,000 SSMLS
- 2019-06-12 Listed $91,000 SSMLS
- 2015-08-07 Sold (Public Records) $75,000 Public Records
- 2015-08-07 Sold (MLS) $75,000 CRMLS
- 2015-05-23 Price Changed $89,000 CRMLS
- 2015-04-02 Price Changed $109,500 CRMLS
- 2015-03-14 Price Changed $119,500 CRMLS
- 2015-01-02 Listed $129,500 CRMLS
- 2010-08-13 Sold (MLS) $28,000 GEMLS
- 2010-07-21 Price Changed $39,900 GEMLS
- 2010-07-21 Delisted — GEMLS
- 2010-05-02 Listed $28,000 GEMLS
- 2005-10-12 Sold (Public Records) $90,000 Public Records
- 2005-10-07 Sold (Public Records) $90,000 Public Records
- 1989-12-07 Sold (Public Records) $30,000 Public Records
Property tax history
-9.4%/yrLatest (2025): $186 · -9.5% YoY. Source: county tax records.
Cash-flow waterfall
monthlySold comps — $/sqft
last 12 mo · ≤1 miLoading sold comps…