21118 Boulder Flts · San Antonio, TX
Flood risk No data
- FEMA flood zone
- —
- Chance of flooding over 30 yrs
- —
- Est. flood insurance / yr
- —
Fire risk No data
- Est. fire insurance / yr
- —
Heat risk No data
- Hot days now (above threshold)
- —
- Hot days in 30 yrs
- —
Wind risk No data
- Chance of severe wind over 30 yrs
- —
Air-quality risk No data
- Unhealthy air days now
- —
- Unhealthy air days in 30 yrs
- —
Risk factors via First Street. Map © Google.
Why this score? — see what drove the D grade
The composite is a weighted blend of 9 inputs, each scored 0–100. Each bar is that input's sub-score; the figure is the points it added to the 100-point composite (weight × sub-score).
- Appreciation +10.0/10.0
- Cash flow +7.6/30.0
- ARV discount +7.3/15.0
- Livability +4.0/5.0
- Schools +3.8/10.0
- Rent growth +2.5/5.0
- Condition / age +2.5/5.0
- DSCR +1.7/10.0
- 1% rule +1.2/10.0
$367,950
🖨 Deal sheet (PDF) 📄 Offer letter ✓ Due diligence
Listing remarks
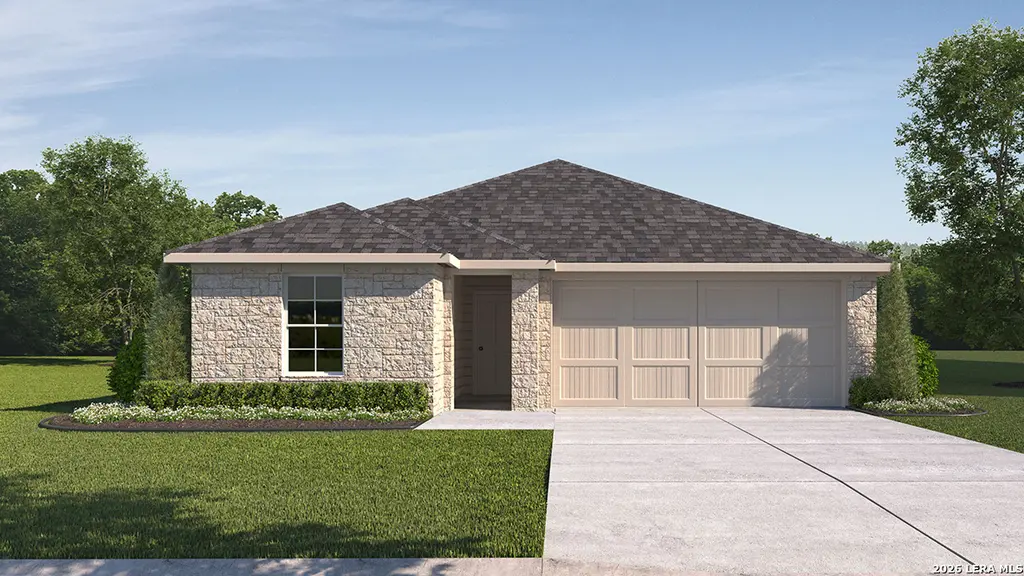
The Easton plan located at beautiful Brookstone Creek in San Antonio, TX offers a perfect balance of style, comfort, and functionality within a spacious 1680 square foot, single-story layout. Featuring 4 bedrooms and two full bathrooms, this home is designed with you and your loved ones in mind. A welcoming elongated foyer guides you into the heart of the home, where an open-concept kitchen, dining area and living room create a bright, airy space ideal for gatherings and everyday life. The kitchen stands out with stainless steel appliances, a gas cooking range, quartz countertops, a spacious kitchen island and a farmhouse style sink. Stylish flat panel cabinetry and classic white subway til
Key facts
- Quartz countertops
- Open concept kitchen
- Kitchen island
Tags
Neighborhood map
What this means for you Summary
Snapshot
- This is a 4-bed/2.0-bath single-family listed at $368k.
Deal economics
- At list price, monthly cash flow is $-436 ($-5k/yr) — negative.
- To cash-flow at today's rent, offer at most $291k (20.9% below list).
- To meet the 1% rule (rent ≥ 1% of price), the offer needs to be $227k (38.3% below list).
- Recommended offer: $227k (38.3% below list) — sets the bar for 1% rule.
- Cap rate 4.9% vs local median 3.8% in San Antonio — meaningfully above typical; check what's discounted (condition, days-on-market, listing class) to confirm the premium yield is real.
Location & tenants
- Location reads 80/100 on livability (#31 in TX, #1,616 nationally) — a professional / high-income tenant draw. Strengths: amenities A+, commute A+, cost of living A+; Watch: crime F.
- North East ISD (urban): math 38% / reading 49% proficiency, ranked #276 of 826 in TX (top 33%) — families likely to look elsewhere, expect single-tenant / working-renter base with shorter leases.
- Zoned schools: Bulverde Creek (math 51% / reading 58%, grade C, #621 of 4,322 statewide, top 15%, 1,003 students, 39% FRL); Hill Middle (math 51% / reading 64%, grade B, #206 of 1,662 statewide, top 13%, 1,044 students, 28% FRL); Johnson H S (math 69% / reading 80%, grade B+, #82 of 1,632 statewide, top 6%, 3,202 students, 24% FRL).
- Zoned-school proficiency averages 62% at this address vs 44% district-wide (+19 pts) — the actual schools serving this property are materially stronger than the North East ISD average implies; a family-tenant draw the district grade alone would hide.
- Market conditions: 230 active listings in the ZIP; 28 comparable units currently listed for rent nearby; rentals at typical pace (median 20d on market — plan ~3-4 weeks tenant-placement turnaround); 8,308 units permitted in Bexar County in 2024 (2,506 in 5+ unit buildings).
Forward outlook
- In year one you build about $39k of equity ($3k loan paydown + $37k appreciation (10.0% local appreciation)).
- Bexar County population projected at +50% by 2050 — long-run rental-demand tailwind backs the buy-and-hold thesis.
- By year 2, paydown + projected appreciation supports a ~$63k cash-out refi (75% LTV) — recoverable capital for the next deal without selling this one.
Negotiation context
- It's been on market 38 days — a 3% lower offer ($357k) is reasonable based on typical stale-listing flexibility.
Questions for the listing agent
- What do current leases actually rent for vs. the listed asking? Can we see a recent rent roll and the last 12 months of T-12 income?
- It's been on market 38 days. Have you received any prior offers? Is the seller open to a 38% concession, seller financing, or rate buy-down credit?
- What does the HOA fee cover, when was the last increase, and are there any pending special assessments or reserve-fund shortfalls?
- Is there a deadline driving the sale (1031 exchange, divorce, estate, relocation)? That informs how much negotiation room exists.
- Crime grade is F in this area — have there been break-ins, vandalism, or insurance claims at this property in the last 3 years? What carrier currently insures it and at what premium?
- The area grade is low — what's the realistic commute time and amenity access for the typical tenant pool here? Any planned neighborhood developments (good or bad) we should know about?
- What's the average days-on-market for RENTAL listings here right now (not sales)? A rising rental-DOM trend means longer vacancies and softer asking-rent achievability than the comps imply.
- What's the recent tenant-quality profile in this submarket — average credit score on applications, eviction rate, late-payment / NSF rate, and stable-employment percentage? A property-management company in the area should have these aggregated.
- How much new for-sale + rental construction is in the pipeline within 1–3 miles? Heavy new supply typically softens prices + rents 12–24 months out; constrained supply supports both.
Investment metrics
- 1% rule
- 0.62% ✗
- Cap rate
- 4.87%
- Cash-on-cash
- -5.08%
- DSCR
- 0.77
- GRM
- 13.5
CMA / ARV
- ARV (on-the-fly)
- $366,240
- Comps found
- 12
Show comp detail 12 sales within ~0.75 mi
| Address | Dist | Beds/Ba | Sqft | Sold | Price | $/sf | Match |
|---|---|---|---|---|---|---|---|
| 21118 Boulder Flts | 0.00mi | 4/2.0 | 1,680 (0%) | 1mo | $367,950 | $219 | 99 |
| 21162 Boulder Flts | 0.09mi | 4/2.0 | 1,680 (0%) | 1mo | $368,950 | $220 | 94 |
| 21130 Boulder Flts | 0.03mi | 4/2.0 | 1,778 (+6%) | 1mo | $387,950 | $218 | 89 |
| 21150 Boulder Flts | 0.07mi | 4/2.0 | 1,778 (+6%) | 1mo | $384,950 | $217 | 86 |
| 21126 Boulder Flts | 0.02mi | 3/2.0 (-1) | 1,595 (-5%) | 0mo | $379,950 | $238 | 86 |
| 21138 Boulder Flts | 0.04mi | 4/2.5 | 1,823 (+8%) | 2mo | $393,950 | $216 | 80 |
| 20944 Gravel Keep | 0.07mi | 4/2.5 | 1,823 (+8%) | 0mo | $417,500 | $229 | 80 |
| 21154 Boulder Flts | 0.08mi | 4/2.5 | 1,823 (+8%) | 2mo | $391,950 | $215 | 79 |
| 20921 Gravel Keep | 0.13mi | 4/2.5 | 1,823 (+8%) | 0mo | $424,105 | $233 | 77 |
| 21207 Boulder Flts | 0.15mi | 4/2.0 | 1,840 (+10%) | 1mo | $365,000 | $198 | 77 |
| 21170 Boulder Flts | 0.11mi | 4/2.5 | 1,823 (+8%) | 3mo | $390,950 | $214 | 76 |
| 5610 Thunder Oaks | 0.63mi | 3/2.0 (-1) | 1,927 (+15%) | 2mo | $332,000 | $172 | 39 |
Match score weights: distance 35% · size 25% · config 20% · recency 20%. Top-matched comps best support the ARV.
Projected returns pro-forma
10.0% appreciation · 3.0% rent growth · sell at horizon
- IRR
- 20.7%
- Equity multiple
- 2.67×
- Total profit
- $172,448
- Equity at exit
- $331,479
- IRR
- 18.8%
- Equity multiple
- 6.14×
- Total profit
- $529,371
- Equity at exit
- $714,846
Cash invested: $103,026 (down + closing). Projections, not guarantees.
Landlord ↔ Tenant lean methodology
- Overall (STATE)
- 87 Strongly Landlord-Friendly
- State Texas
- 87 Strongly Landlord-Friendly · R+5
- County
- — inherits STATE
- City
- — inherits STATE
ZIP-level market 78266
- Home prices YoY
- 3.9%
- Active inventory
- 230
- Price-to-rent
- 13.5×
Monthly cashflow live
- Estimated rent
- $2,271 high interval (Pro) →
- Mortgage (P&I)
- −$1,930
- Tax from tax record
- −$68 /mo · $811/yr
- Insurance
- −$153
- HOA
- −$80
- Vacancy / Maint / Mgmt
- −$477
- Net cashflow
- $-436
Break-even live
Sensitivity live
| Price | -10% $-228 | -5% $-332 | +0% $-436 | +5% $-540 | +10% $-645 |
|---|---|---|---|---|---|
| Rent | -10% $-616 | -5% $-526 | +0% $-436 | +5% $-347 | +10% $-257 |
| Rate | -1.0pp $-251 | -0.5pp $-343 | base $-436 | +0.5pp $-532 | +1.0pp $-629 |
UW: 25.0% down · 7.5% · 30yr · 1.5% tax · 5.0% vac · 8.0% maint · 8.0% mgmt
Financing live
Cash to close
- Down payment
- $91,988
- Closing costs
- $11,038
- Reserves months
- —
- Total cash needed
- —
Loan-product check · same deal, 3 products live
Conventional
25% down · 7.5% · 30yr
- Down + closing
- —
- Monthly P&I
- —
- Monthly cashflow
- —
- DSCR
- —
- Eligible?
- —
Personal DTI + credit; lowest rate.
DSCR
20% down · 8.5% · 30yr
- Down + closing
- —
- Monthly P&I
- —
- Monthly cashflow
- —
- DSCR
- —
- Eligible?
- —
No personal income docs; deal must DSCR.
Hard money
10% down · 12.0% · 12mo
- Down + closing
- —
- Monthly P&I
- —
- Monthly cashflow
- —
- DSCR
- —
- Eligible?
- —
Short-term bridge; refi at stabilization.
Rent comps 28 comps
| Address | Beds | Baths | Sqft | Rent | $/sqft | DOM | Units | Dist |
|---|---|---|---|---|---|---|---|---|
| 5536 Jewel Curv San Antonio, TX | 4.0 | 2.0 | 1750 | $2,500 | $1.43 | 45d | 1 | 0.28mi |
| 5714 Pin Pt San Antonio, TX | 4.0 | 2.5 | 2146 | $2,400 | $1.12 | 0d | 1 | 0.33mi |
| 5518 Stormie Keep San Antonio, TX | 4.0 | 2.0 | 1779 | $2,250 | $1.26 | 4d | 1 | 0.36mi |
| 5518 Stormie Keep San Antonio, TX | 4.0 | 2.0 | 1778 | $2,250 | $1.27 | 3d | 1 | 0.36mi |
| 5103 Gully Way San Antonio, TX | 4.0 | 2.0 | 1778 | $2,200 | $1.24 | 14d | 1 | 0.37mi |
| 20859 Rindle Ln San Antonio, TX | 4.0 | 3.0 | 2032 | $2,500 | $1.23 | 21d | 1 | 0.40mi |
| 5015 Gully Way San Antonio, TX | 4.0 | 2.5 | 2023 | $2,400 | $1.19 | 0d | 1 | 0.42mi |
| 5602 Chestnut Xing San Antonio, TX | 3.0 | 2.5 | 1958 | $2,250 | $1.15 | 25d | 1 | 0.42mi |
| 21027 Watercourse Way San Antonio, TX | 4.0 | 2.5 | 1823 | $2,195 | $1.20 | 22d | 1 | 0.43mi |
| 21339 Watercourse Way San Antonio, TX | 4.0 | 2.5 | 2171 | $2,300 | $1.06 | 46d | 1 | 0.53mi |
| 21514 Thunder Basin San Antonio, TX | 3.0 | 2.5 | 1928 | $2,100 | $1.09 | 19d | 1 | 0.69mi |
| 4610 Sebastian Oak San Antonio, TX | 3.0 | 2.0 | 2094 | $2,095 | $1.00 | 19d | 1 | 0.92mi |
| 5951 Southern Knl San Antonio, TX | 3.0 | 2.0 | 1648 | $2,500 | $1.52 | 0d | 1 | 1.00mi |
| 4526 Bexley Trl San Antonio, TX | 3.0 | 2.0 | 1657 | $1,975 | $1.19 | 3d | 1 | 1.01mi |
| 22507 Green Jacket San Antonio, TX | 3.0 | 2.0 | 1535 | $2,100 | $1.37 | 45d | 1 | 1.07mi |
| 20803 Cape Coral San Antonio, TX | 4.0 | 2.0 | 1699 | $2,200 | $1.29 | 15d | 1 | 1.09mi |
| 22618 Double Bogey San Antonio, TX | 4.0 | 2.0 | 1720 | $1,950 | $1.13 | 5d | 1 | 1.10mi |
| 5131 Blind Shot San Antonio, TX | 4.0 | 2.0 | 1572 | $2,100 | $1.34 | 45d | 1 | 1.13mi |
| 5707 Tpc Pkwy San Antonio, TX | 4.0 | 1.0–3.0 | 1013 | $1,838 | $1.81 | 3d | 19 | 1.16mi |
| 6015 Akin Stroll San Antonio, TX | 3.0 | 2.0 | 1534 | $2,100 | $1.37 | 45d | 1 | 1.18mi |
| 5714 Agave Spine San Antonio, TX | 4.0 | 3.0 | 2011 | $2,600 | $1.29 | 45d | 1 | 1.19mi |
| 5819 Akin Pl San Antonio, TX | 4.0 | 2.0 | 1648 | $1,800 | $1.09 | 25d | 1 | 1.27mi |
| 22763 Tee Shot San Antonio, TX | 3.0 | 2.5 | 2041 | $2,300 | $1.13 | 45d | 1 | 1.31mi |
| 5505 TPC Pkwy Unit 3213 San Antonio, TX | 3.0 | 2.0 | 1895 | $2,438 | $1.29 | 0d | 1 | 1.33mi |
| 5106 Blind Shot San Antonio, TX | 5.0 | 2.5 | 1950 | $2,400 | $1.23 | 45d | 1 | 1.34mi |
| 23215 Langdon Lndg San Antonio, TX | 4.0 | 2.5 | 2075 | $2,550 | $1.23 | 4d | 1 | 1.41mi |
| 6035 Akin Pl San Antonio, TX | 3.0 | 2.0 | 1690 | $2,100 | $1.24 | 6d | 1 | 1.42mi |
| 6022 Akin Quay San Antonio, TX | 4.0 | 2.0 | 1739 | $2,200 | $1.27 | 6d | 1 | 1.42mi |
HOA detail
- Monthly dues
- $80 · $960/yr
- Likely covers
- gassecurity
Listing history 4 events
-
2026-04-27status Pending
-
2026-04-04price $367,950
-
2026-04-02price $408,000
-
2026-03-20$406,000 New
ⓘ Source: listings_history table (triggers on properties + properties_extension) + one-shot
backfill from property_details.listing_events for pre-trigger history.
Tax reassessment forecast TX · Resets to sale price
- Current annual tax
- $811 · $68/mo
- Projected year-2 tax
- $6,733 · $561/mo
- Expected delta
- +$5,923/yr (+$494/mo · 730.3%)
ⓘ Screening estimate from a state-policy table — verify with the county assessor before closing.
Nearby sold comps map
Loading sold comps map…
Walkable amenities ~0.75 mi
Loading nearby amenities…
Taxation est. · year 1
- Rental income
- $27,253
- − Mortgage interest
- −$20,611
- − Property taxes
- −$811
- − Insurance
- −$1,840
- − Repairs & maintenance
- −$2,180
- − Management
- −$2,180
- − HOA
- −$960
- − Depreciation
- −$10,704
- Taxable loss
- −$12,033
- Est. tax savings @ 24.0%
- +$2,888
- After-tax cash flow
- $-2,348/yr
For passive investors: Depreciation is non-cash, so a rental often shows a tax loss while cash-flowing — sheltering income. Rental losses are passive: they offset passive income freely, and up to $25,000/yr can offset ordinary (W-2) income if you actively participate and your MAGI is under $100k (phasing out to $0 by $150k); unused losses carry forward. On sale, claimed depreciation is recaptured at up to 25%, and gains may owe capital-gains tax (a 1031 exchange can defer both). Figures are a year-1 estimate at your 24.0% rate — not tax advice; consult a CPA.
Schools (NCES district)
- District
- North East ISD
- NCES district ID
- 4832940
- Math proficiency
- 38% ▼ -14.00%
- Reading proficiency
- 49% ▼ -4.00%
- Median HH income
- $57,715
- Composite
- 38.1/100
- National rank
- #4276
- State rank
- #276 of 826 in TX
Livability — San Antonio
- Score
- 80/100
- State rank
- #31
- US rank
- #1616
Category grades
Schools grade is shown separately in the Schools card above.
Census & demographics
- City population
- 1,806,925
- Population (ZIP)
- 7,274
Population outlook (Bexar County) Hauer SSP2
- Today (2025)
- 2,336,851 people
- By 2030
- 2,560,728 · +9.6%
- By 2040
- 3,020,569 · +29.3%
- By 2050
- 3,493,522 · +49.5%
- By 2075
- 4,668,459 · +99.8%
- By 2100
- 5,533,242 · +136.8%
Race, ethnicity, and origin ACS 2023
- Neighborhood character
- Diverse neighborhood (Simpson 0.65)
- Race & ethnicity
- White 44% Hispanic / Latino 36% Two or more races 25% Black 14%
- Hispanic origin (detail)
- Mexican 30%
- Common ancestry
- Romanian 3% Serbian 2% Lithuanian 1%
- Foreign-born
- 6% · Canada, South Korea
- Languages at home
- 85% English-only · Spanish 11% German/W. Germanic 2% Korean 1%
Political lean MEDSL · Bexar
- 2024 margin
- Lean D (+9.8) · D 54.3% · R 44.6% · Other 1.1%
- 2008→2024 swing
- +4.2pp toward D · 2008: 5.6pp · 2024: 9.8pp
- All cycles
- 2024: D+9.8 2020: D+18.2 2016: D+13.5 2012: D+4.6 2008: D+5.6
Not yet ingested
- Civics
- —
Market trends
- HPI YoY
- ▲ 13.56%
- Current HPI
- 361.01
- Rent YoY
- —
- Metro
- —
- State GDP YoY
- ▲ 3.95%
- F500 in state
- 110
Industry mix (Fortune 500 HQ in TX)
| Industry | F500 HQs | Revenue |
|---|---|---|
| Energy | 16 | $1,198B |
|
||
| Technology | 5 | $198B |
|
||
| Engineering / Construction | 4 | $72B |
|
||
| Energy Services | 3 | $60B |
|
||
| Utilities | 3 | $41B |
|
||
| Healthcare | 2 | $330B |
|
||
Price history
-9.4% since first listed4 events — show timeline
- 2026-04-27 Pending — LERA
- 2026-04-04 Price Changed $367,950 LERA
- 2026-04-02 Price Changed $408,000 LERA
- 2026-03-20 Listed $406,000 LERA
Property tax history
+1.9%/yrLatest (2025): $811 · +1.9% YoY. Source: county tax records.
Cash-flow waterfall
monthlySold comps — $/sqft
last 12 mo · ≤1 miLoading sold comps…