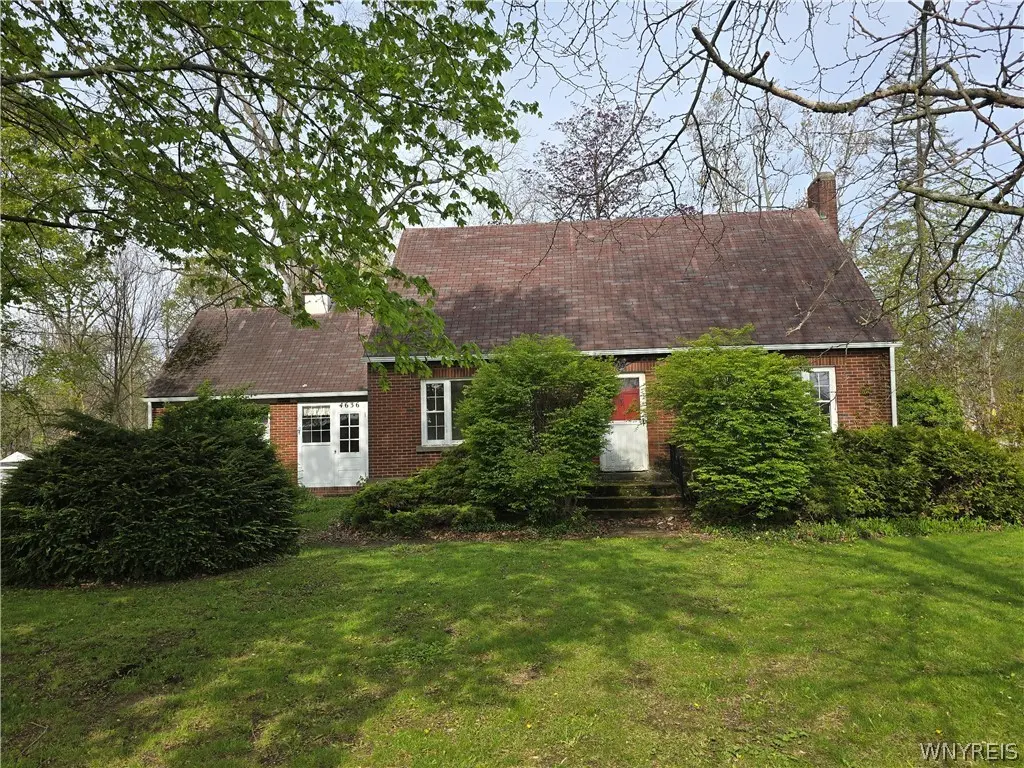
4636 Alabama Rd · Medina, NY
Flood risk 1/10 · Minimal
- FEMA flood zone
- X
- Chance of flooding over 30 yrs
- 0.0%
- Est. flood insurance / yr
- $473 – $860
Fire risk 1/10 · Minimal
- Est. fire insurance / yr
- $691 – $1,283
Heat risk 2/10 · Minimal
- Hot days now (above 94°F)
- 7 days/yr
- Hot days in 30 yrs
- 15 days/yr
Wind risk 1/10 · Minimal
- Chance of severe wind over 30 yrs
- —
Air-quality risk 2/10 · Minimal
- Unhealthy air days now
- 1 days/yr
- Unhealthy air days in 30 yrs
- 2 days/yr
Risk factors via First Street. Map © Google.
Why this score? — see what drove the D grade
The composite is a weighted blend of 9 inputs, each scored 0–100. Each bar is that input's sub-score; the figure is the points it added to the 100-point composite (weight × sub-score).
- ARV discount +15.0/15.0
- Cash flow +7.1/30.0
- Appreciation +4.9/10.0
- Livability +3.6/5.0
- 1% rule +3.5/10.0
- Schools +3.2/10.0
- Rent growth +2.5/5.0
- Condition / age +2.5/5.0
- DSCR +1.3/10.0
$165,000
🖨 Deal sheet 📄 Offer letter ✓ Due diligence
Listing remarks
Unlock the potential of this classic 3 bedroom/2 bath Cape Cod. Offering a perfect mix of original charm and incredible opportunity. This home features solid construction, with the most beautiful hardwood floors and a captivating, cozy layout. Plenty of space with the attached 1 car garage and a 2 car garage located at the rear of the property. The 1 acre corner lot backs up to a creek that is the perfect spot to entertain or enjoy. Brand new gutters and electrical has been updated. Don't miss your chance to create your own dream home. Delayed negotiations until May 22nd at Noon. Open House Saturday, May 16th from Noon to 2pm.
Key facts
- 1 acre corner lot
- Attached garage
- Brand new gutters
Tags
Property features AI
Exterior
- Parking: Attached 3-car garage; Detached garage
- Utilities: Public water connected; Septic tank sewer; Cable available; High-speed internet available; Electric with circuit breakers
- Home design: Brick construction; One story; Existing/resale condition
- Construction: Block foundation
- Exterior features: Concrete driveway; Corner lot; Rectangular lot (237 x 201)
Interior
- Kitchen: Electric oven; Electric range; Gas cooktop; Refrigerator
- Bedrooms: One bedroom on the main level; Two bedrooms on the second level; One additional bedroom on the first level
- Flooring: Hardwood; Laminate; Varies
- Bathrooms: Two full bathrooms; One full bathroom on the main level
- Heating & cooling: Gas heating with forced air
- Interior features: Separate/formal dining room; Separate/formal living room; Bedroom on main level; Full basement
- Laundry & utility: Laundry in basement; Gas water heater
Neighborhood map
What this means for you Summary
Snapshot
- This is a 2-bed/1.5-bath single-family listed at $165k.
Deal economics
- At list price, monthly cash flow is $-236 ($-3k/yr) — negative.
- To cash-flow at today's rent, offer at most $123k (25.3% below list).
- To meet the 1% rule (rent ≥ 1% of price), the offer needs to be $140k (15.0% below list).
- Recommended offer: $123k (25.3% below list) — sets the bar for cash-flow.
Location & tenants
- Location reads 72/100 on livability (#344 in NY) — a middle-class / working-renter tenant base. Strengths: cost of living A+, housing A+, health & safety A+; Watch: crime D-, amenities F, commute F.
- Medina Central School District (town): math 37% / reading 38% proficiency, ranked #548 of 590 in NY (top 93%) — families likely to look elsewhere, expect single-tenant / working-renter base with shorter leases.
- Market conditions: 57 active listings in the ZIP; 28 units permitted in Orleans County in 2024 (0 in 5+ unit buildings).
Forward outlook
- In year one you build about $705 of equity ($1k loan paydown + $-436 appreciation (-0.3% local appreciation)).
- Orleans County population projected at -20% by 2050 — secular population decline; favor cash flow + early exit over multi-decade hold.
Negotiation context
- It's been on market 16 days — a 2% lower offer ($163k) is reasonable based on typical stale-listing flexibility.
Risks & watch-outs
- Watch-outs: property tax is 3.0% of price; built in 1950 — expect roof / HVAC / electrical / plumbing capex.
Questions for the listing agent
- What do current leases actually rent for vs. the listed asking? Can we see a recent rent roll and the last 12 months of T-12 income?
- Built in 1950 — when were the roof, HVAC, electrical panel, plumbing, and water heater last replaced?
- Property tax is high relative to price — has the assessment been appealed recently, and will the sale trigger a re-assessment?
- Is there a deadline driving the sale (1031 exchange, divorce, estate, relocation)? That informs how much negotiation room exists.
- Crime grade is D in this area — have there been break-ins, vandalism, or insurance claims at this property in the last 3 years? What carrier currently insures it and at what premium?
- The area grade is low — what's the realistic commute time and amenity access for the typical tenant pool here? Any planned neighborhood developments (good or bad) we should know about?
- What's the average days-on-market for RENTAL listings here right now (not sales)? A rising rental-DOM trend means longer vacancies and softer asking-rent achievability than the comps imply.
- What's the recent tenant-quality profile in this submarket — average credit score on applications, eviction rate, late-payment / NSF rate, and stable-employment percentage? A property-management company in the area should have these aggregated.
- How much new for-sale + rental construction is in the pipeline within 1–3 miles? Heavy new supply typically softens prices + rents 12–24 months out; constrained supply supports both.
Investment metrics
- 1% rule
- 0.85% ✗
- Cap rate
- 4.57%
- Cash-on-cash
- -6.14%
- DSCR
- 0.73
- GRM
- 9.8
CMA / ARV
- ARV (median comp)
- $230,433
- List price
- $165,000
- Delta
- -28.40%
- Verdict
- UNDERPRICED
- Comps
- 8 within 1.0 mi
Projected returns pro-forma
-0.26% appreciation · 3.0% rent growth · sell at horizon
- IRR
- -10.3%
- Equity multiple
- 0.53×
- Total profit
- $-21,778
- Equity at exit
- $45,744
- IRR
- -3.9%
- Equity multiple
- 0.60×
- Total profit
- $-18,388
- Equity at exit
- $53,285
Cash invested: $46,200 (down + closing). Projections, not guarantees.
Landlord ↔ Tenant lean methodology
- Overall (STATE)
- 15 Strongly Tenant-Friendly
- State New York
- 15 Strongly Tenant-Friendly · D+10
- County
- — inherits STATE
- City
- — inherits STATE
ZIP-level market 14103
- Home prices YoY
- -0.1%
- Active inventory
- 57
- Price-to-rent
- 9.8×
Monthly cashflow live
- Estimated rent
- $1,403 medium interval (Pro) →
- Mortgage (P&I)
- −$865
- Tax from tax record
- −$410 /mo · $4,926/yr
- Insurance
- −$69
- HOA
- −$0
- Vacancy / Maint / Mgmt
- −$295
- Net cashflow
- $-236
Break-even live
UW: 25.0% down · 7.5% · 30yr · 1.5% tax · 5.0% vac · 8.0% maint · 8.0% mgmt
Financing live
Cash to close
- Down payment
- $41,250
- Closing costs
- $4,950
- Reserves months
- —
- Total cash needed
- —
Loan-product check · same deal, 3 products live
Conventional
25% down · 7.5% · 30yr
- Down + closing
- —
- Monthly P&I
- —
- Monthly cashflow
- —
- DSCR
- —
- Eligible?
- —
Personal DTI + credit; lowest rate.
DSCR
20% down · 8.5% · 30yr
- Down + closing
- —
- Monthly P&I
- —
- Monthly cashflow
- —
- DSCR
- —
- Eligible?
- —
No personal income docs; deal must DSCR.
Hard money
10% down · 12.0% · 12mo
- Down + closing
- —
- Monthly P&I
- —
- Monthly cashflow
- —
- DSCR
- —
- Eligible?
- —
Short-term bridge; refi at stabilization.
Listing history 1 events
-
2026-05-11$165,000 Active 634-char remark
ⓘ Source: listings_history table (triggers on properties + properties_extension) + one-shot
backfill from property_details.listing_events for pre-trigger history.
Tax reassessment forecast NY · Partial reset (capped growth)
- Current annual tax
- $4,926 · $410/mo
- Projected year-2 tax
- $4,926 · $410/mo
- Expected delta
- $0/yr ($0/mo · 0.0%)
ⓘ Screening estimate from a state-policy table — verify with the county assessor before closing.
Climate risk First Street
- Flood 1/10 Low FEMA zone X · 0% chance over 30 yrs
- Wildfire 1/10 Low
- Heat 2/10 Low 7 d/yr ≥94°F today · 15 d/yr by 30 yrs out
- Wind 1/10 Low
- Air quality 2/10 Low 1 unhealthy d/yr today · 2 by 30 yrs out
Nearby sold comps map
Loading sold comps map…
Walkable amenities ~0.75 mi
Loading nearby amenities…
Taxation est. · year 1
- Rental income
- $16,831
- − Mortgage interest
- −$9,243
- − Property taxes
- −$4,926
- − Insurance
- −$825
- − Repairs & maintenance
- −$1,346
- − Management
- −$1,346
- − Depreciation
- −$4,800
- Taxable loss
- −$5,655
- Est. tax savings @ 24.0%
- +$1,357
- After-tax cash flow
- $-1,480/yr
For passive investors: Depreciation is non-cash, so a rental often shows a tax loss while cash-flowing — sheltering income. Rental losses are passive: they offset passive income freely, and up to $25,000/yr can offset ordinary (W-2) income if you actively participate and your MAGI is under $100k (phasing out to $0 by $150k); unused losses carry forward. On sale, claimed depreciation is recaptured at up to 25%, and gains may owe capital-gains tax (a 1031 exchange can defer both). Figures are a year-1 estimate at your 24.0% rate — not tax advice; consult a CPA.
Schools (NCES district)
- District
- Medina Central School District
- NCES district ID
- 3618960
- Math proficiency
- 37% ▼ -12.00%
- Reading proficiency
- 38% ▼ -6.00%
- Median HH income
- $43,046
- Composite
- 31.76/100
- National rank
- #5901
- State rank
- #548 of 590 in NY
Livability — Medina
- Score
- 72/100
- State rank
- #344
- US rank
- #5814
Category grades
Schools grade is shown separately in the Schools card above.
Census & demographics
- City population
- 10,836
- Population (ZIP)
- 10,836
Population outlook (Orleans County) Hauer SSP2
- Today (2025)
- 39,123 people
- By 2030
- 37,648 · -3.8%
- By 2040
- 34,432 · -12.0%
- By 2050
- 31,487 · -19.5%
- By 2075
- 26,544 · -32.2%
- By 2100
- 22,251 · -43.1%
Race, ethnicity, and origin ACS 2023
- Neighborhood character
- Predominantly White (83%)
- Race & ethnicity
- White 83% Hispanic / Latino 6% Two or more races 5% Black 4% Asian 2%
- Hispanic origin (detail)
- Mexican 4%
- Common ancestry
- Romanian 9% Slovak 2% Lithuanian 1%
- Foreign-born
- 4% · Canada, China
- Languages at home
- 89% English-only · Spanish 5% German/W. Germanic 3% Chinese 1%
Political lean MEDSL · Orleans
- 2024 margin
- Solid R (+40.5) · D 29.8% · R 70.2%
- 2008→2024 swing
- -21.8pp toward R · 2008: -18.7pp · 2024: -40.5pp
- All cycles
- 2024: R+40.5 2020: R+36.0 2016: R+43.4 2012: R+19.4 2008: R+18.7
Not yet ingested
- Civics
- —
Market trends
- HPI YoY
- ▼ -0.26%
- Current HPI
- 307.0342
- Rent YoY
- —
- Metro
- —
- State GDP YoY
- ▲ 2.60%
- F500 in state
- 92
Industry mix (Fortune 500 HQ in NY)
| Industry | F500 HQs | Revenue |
|---|---|---|
| Financial Services | 10 | $950B |
|
||
| Consumer Goods | 9 | $162B |
|
||
| Insurance | 4 | $225B |
|
||
| Telecommunications | 2 | $144B |
|
||
| Pharmaceuticals | 2 | $112B |
|
||
| Media / Entertainment | 2 | $69B |
|
||
Price history
2 events — show timeline
- 2026-05-27 Pending — WNYREIS
- 2026-05-11 Listed $165,000 WNYREIS
Property tax history
+1.1%/yrLatest (2025): $4,926 · +2.0% YoY. Source: county tax records.
Cash-flow waterfall
monthlySold comps — $/sqft
last 12 mo · ≤1 miLoading sold comps…