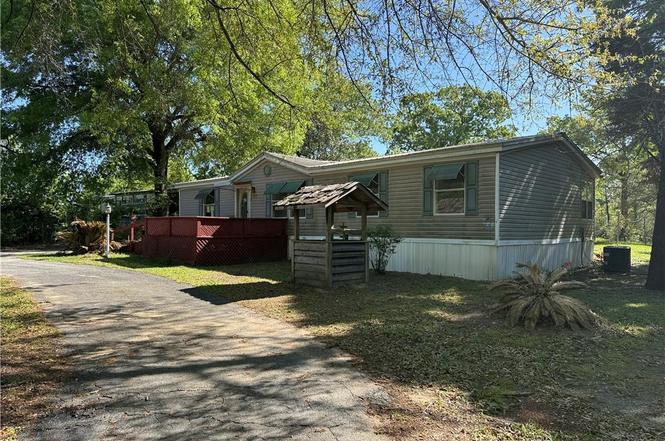
7070 Timber Woods Dr · Semmes, AL
Flood risk 1/10 · Minimal
- FEMA flood zone
- X (unshaded)
- Chance of flooding over 30 yrs
- 0.0%
- Est. flood insurance / yr
- $507 – $1,088
Fire risk 6/10 · Moderate
- Est. fire insurance / yr
- $916 – $1,700
Heat risk 8/10 · Major
- Hot days now (above 105°F)
- 7 days/yr
- Hot days in 30 yrs
- 20 days/yr
Wind risk 9/10 · Severe
- Chance of severe wind over 30 yrs
- 99.0%
Air-quality risk 1/10 · Minimal
- Unhealthy air days now
- 0 days/yr
- Unhealthy air days in 30 yrs
- 0 days/yr
Risk factors via First Street. Map © Google.
Why this score? — see what drove the B- grade
The composite is a weighted blend of 9 inputs, each scored 0–100. Each bar is that input's sub-score; the figure is the points it added to the 100-point composite (weight × sub-score).
- Cash flow +30.0/30.0
- 1% rule +10.0/10.0
- DSCR +10.0/10.0
- ARV discount +7.5/15.0
- Livability +3.0/5.0
- Rent growth +2.5/5.0
- Condition / age +2.5/5.0
- Schools +2.3/10.0
- Appreciation +0.0/10.0
$62,100
🖨 Deal sheet (PDF) 📄 Offer letter ✓ Due diligence
Listing remarks
Opportunity Awaits in Semmes! Welcome to 7070 Timber Woods Dr—a 3-bedroom, 2-bath manufactured home offering over 1,400 square feet of space, nestled on a generously sized lot. While this home does need repairs, the price reflects the value and potential for the right buyer to bring it back to life. This property qualifies for special $100 Down FHA Financing and is eligible for FHA 203(b) repair escrow, giving buyers a unique chance to finance necessary improvements and make the home their own—all in one loan. Whether you're an investor, a DIY enthusiast, or someone looking for an affordable opportunity to customize, this home is full of promise. Don’t miss your chance to
Key facts
- 0.96 acre lot
- 2 parking spots
- Built 1999
Property features AI
Finance
- Other: Not on land lease
Exterior
- Parking: Carport (2 spaces); Driveway
- Utilities: Electricity available (110 volts); Water available; Septic tank
- Home design: Single family residence; Residential property; Located in Timber Woods subdivision; View available
- Construction: Vinyl siding; Shingle roof; Built in 1999; No foundation details specified; No window features specified
- Exterior features: Back yard fencing; Outbuilding; No pool or spa
Interior
- Kitchen: White cabinets; Kitchen island; Laminate counters; Pantry; Open view to family room
- Bedrooms: 3 bedrooms
- Flooring: No flooring specified
- Bathrooms: 2 full bathrooms
- Heating & cooling: Central heating; Other heating; Central air conditioning; Other cooling
- Interior features: Other interior features; No fireplace
- Laundry & utility: Other appliances
Neighborhood map
What this means for you Summary
Snapshot
- This is a 3-bed/2.0-bath other listed at $62k.
Deal economics
- At list price, monthly cash flow is $963 ($12k/yr) — positive.
- The deal already cash-flows at list — no discount required.
- Meets the 1% rule at list price ($2k rent vs $62k).
- Recommended offer: $57k (9.0% below list) — sets the bar for market timing.
- Cap rate 24.9% vs local median 5.3% in Semmes — top-decile yield for the area; either an underpriced asset or a hidden risk that comps aren't pricing in. Stress-test before assuming the spread holds.
Location & tenants
- Location reads 60/100 on livability (#311 in AL) — a middle-class / working-renter tenant base. Strengths: cost of living A+, housing A+; Watch: crime F, amenities F, commute F.
- Mobile County (urban): math 15% / reading 39% proficiency, ranked #81 of 129 in AL (top 63%) — low school quality limits family demand, transient renter base, plan for 1-2y turnover; 67% free/reduced lunch — lower-income household profile, screen leases tightly.
- Zoned schools: Mary G Montgomery High School (math 13% / reading 18%, grade F, #211 of 305 statewide, top 69%, 1,965 students, 53% FRL).
- Market conditions: 184 active listings in the ZIP; 2 comparable units currently listed for rent nearby; 1,678 units permitted in Mobile County in 2024 (264 in 5+ unit buildings).
Forward outlook
- Local home prices are declining (-3.0%/yr); year-one equity from $429 of loan paydown is wiped out by about $2k of value loss. Plan a longer hold.
- Mobile County population projected to shrink 8% by 2050 — rents likely to lag national; underwrite the cash flow, not the appreciation.
- At projected returns (-3.0% appreciation + 3.0% rent growth), your $17k cash investment doubles in ~2 years — after that, you're playing with house money.
Negotiation context
- It's been on market 92 days — a 9% lower offer ($57k) is reasonable based on typical stale-listing flexibility.
- 7 sale attempts; this cycle's ask has dropped $13k (17%) from the opening price — seller is motivated, your offer sets the floor, not the list.
Risks & watch-outs
- Climate carrying-cost: severe wind risk, 99% chance of damaging wind over 30y; major wildfire risk; extreme-heat days projected 7→20/yr by 2055 (HVAC capex compounding) — expect insurance premiums to compound above CPI over the hold.
Questions for the listing agent
- It's been on market 92 days. Have you received any prior offers? Is the seller open to a 9% concession, seller financing, or rate buy-down credit?
- Why hasn't it sold? Are there any deal-killer items the seller is aware of (foundation, flood, title, zoning, code violations)?
- Is there a deadline driving the sale (1031 exchange, divorce, estate, relocation)? That informs how much negotiation room exists.
- Schools are D-rated, which usually means shorter tenancies and higher turnover. Who's the typical renter profile here, and what's been the actual vacancy rate?
- Crime grade is F in this area — have there been break-ins, vandalism, or insurance claims at this property in the last 3 years? What carrier currently insures it and at what premium?
- What's the average days-on-market for RENTAL listings here right now (not sales)? A rising rental-DOM trend means longer vacancies and softer asking-rent achievability than the comps imply.
- What's the recent tenant-quality profile in this submarket — average credit score on applications, eviction rate, late-payment / NSF rate, and stable-employment percentage? A property-management company in the area should have these aggregated.
- How much new for-sale + rental construction is in the pipeline within 1–3 miles? Heavy new supply typically softens prices + rents 12–24 months out; constrained supply supports both.
Investment metrics
- 1% rule
- 2.80% ✓
- Cap rate
- 24.89%
- Cash-on-cash
- 66.43%
- DSCR
- 3.96
- GRM
- 3.0
CMA / ARV
No comps found within radius.
Projected returns pro-forma
-3.0% appreciation · 3.0% rent growth · sell at horizon
- IRR
- 65.7%
- Equity multiple
- 3.95×
- Total profit
- $51,259
- Equity at exit
- $9,259
- IRR
- 70.0%
- Equity multiple
- 8.11×
- Total profit
- $123,635
- Equity at exit
- $5,369
Cash invested: $17,388 (down + closing). Projections, not guarantees.
Landlord ↔ Tenant lean methodology
- Overall (STATE)
- 90 Strongly Landlord-Friendly
- State Alabama
- 90 Strongly Landlord-Friendly · R+15
- County
- — inherits STATE
- City
- — inherits STATE
ZIP-level market 36575
- Home prices YoY
- -21.8%
- Active inventory
- 184
- Price-to-rent
- 3.0×
Monthly cashflow live
- Estimated rent
- $1,737 medium interval (Pro) →
- Mortgage (P&I)
- −$326
- Tax from tax record
- −$58 /mo · $695/yr
- Insurance
- −$26
- HOA
- −$0
- Vacancy / Maint / Mgmt
- −$365
- Net cashflow
- $963
Break-even live
Sensitivity live
| Price | -10% $998 | -5% $980 | +0% $963 | +5% $945 | +10% $927 |
|---|---|---|---|---|---|
| Rent | -10% $825 | -5% $894 | +0% $963 | +5% $1,031 | +10% $1,100 |
| Rate | -1.0pp $994 | -0.5pp $978 | base $963 | +0.5pp $946 | +1.0pp $930 |
UW: 25.0% down · 7.5% · 30yr · 1.5% tax · 5.0% vac · 8.0% maint · 8.0% mgmt
Financing live
Cash to close
- Down payment
- $15,525
- Closing costs
- $1,863
- Reserves months
- —
- Total cash needed
- —
Loan-product check · same deal, 3 products live
Conventional
25% down · 7.5% · 30yr
- Down + closing
- —
- Monthly P&I
- —
- Monthly cashflow
- —
- DSCR
- —
- Eligible?
- —
Personal DTI + credit; lowest rate.
DSCR
20% down · 8.5% · 30yr
- Down + closing
- —
- Monthly P&I
- —
- Monthly cashflow
- —
- DSCR
- —
- Eligible?
- —
No personal income docs; deal must DSCR.
Hard money
10% down · 12.0% · 12mo
- Down + closing
- —
- Monthly P&I
- —
- Monthly cashflow
- —
- DSCR
- —
- Eligible?
- —
Short-term bridge; refi at stabilization.
Rent comps 2 comps
| Address | Beds | Baths | Sqft | Rent | $/sqft | DOM | Units | Dist |
|---|---|---|---|---|---|---|---|---|
| 9530 Fox Hunter Ct W Semmes, AL | 3.0 | 2.0 | 1326 | $1,650 | $1.24 | 22d | 1 | 0.92mi |
| 6208 Marlin Dr Eight Mile, AL | 3.0 | 2.0 | 1595 | $1,895 | $1.19 | 44d | 1 | 1.39mi |
Listing history 17 events
-
2026-04-29status Pending
-
2026-04-28status Active
-
2026-04-27historical
-
2026-04-24status Active
-
2026-04-17status Pending
-
2026-04-05status Active
-
2026-01-09status Pending
-
2026-01-06price $62,100
-
2026-01-01status Active
-
2025-10-22status Pending
-
2025-09-29price $69,000
-
2025-09-29status Active
-
2025-07-03status Pending
-
2025-06-25status Active
-
2025-05-24status Pending
-
2025-04-16$75,000 Active
-
2009-06-03soldstatus $72,195
ⓘ Source: listings_history table (triggers on properties + properties_extension) + one-shot
backfill from property_details.listing_events for pre-trigger history.
Tax reassessment forecast AL · Resets to sale price
- Current annual tax
- $695 · $58/mo
- Projected year-2 tax
- $695 · $58/mo
- Expected delta
- $0/yr ($0/mo · 0.0%)
ⓘ Screening estimate from a state-policy table — verify with the county assessor before closing.
Climate risk First Street
- Flood 1/10 Low FEMA zone X (unshaded) · 0% chance over 30 yrs
- Wildfire 6/10 Major
- Heat 8/10 Severe 7 d/yr ≥105°F today · 20 d/yr by 30 yrs out
- Wind 9/10 Extreme 99% chance of damaging wind over 30 yrs
- Air quality 1/10 Low 0 unhealthy d/yr today · 0 by 30 yrs out
Nearby sold comps map
Loading sold comps map…
Walkable amenities ~0.75 mi
Loading nearby amenities…
Taxation est. · year 1
- Rental income
- $20,840
- − Mortgage interest
- −$3,479
- − Property taxes
- −$695
- − Insurance
- −$310
- − Repairs & maintenance
- −$1,667
- − Management
- −$1,667
- − Depreciation
- −$1,807
- Taxable income
- $11,216
- Est. tax owed @ 24.0%
- −$2,692
- After-tax cash flow
- $8,859/yr
For passive investors: Depreciation is non-cash, so a rental often shows a tax loss while cash-flowing — sheltering income. Rental losses are passive: they offset passive income freely, and up to $25,000/yr can offset ordinary (W-2) income if you actively participate and your MAGI is under $100k (phasing out to $0 by $150k); unused losses carry forward. On sale, claimed depreciation is recaptured at up to 25%, and gains may owe capital-gains tax (a 1031 exchange can defer both). Figures are a year-1 estimate at your 24.0% rate — not tax advice; consult a CPA.
Schools (NCES district)
- District
- Mobile County
- NCES district ID
- 0102370
- Math proficiency
- 15% ▼ -28.00%
- Reading proficiency
- 39% ▬ 0.00%
- Median HH income
- $42,455
- Composite
- 22.9/100
- National rank
- #8002
- State rank
- #81 of 129 in AL
Livability — Semmes
- Score
- 60/100
- State rank
- #311
- US rank
- #19360
Category grades
Schools grade is shown separately in the Schools card above.
Census & demographics
- Population (ZIP)
- 22,444
Population outlook (Mobile County) Hauer SSP2
- Today (2025)
- 415,303 people
- By 2030
- 411,755 · -0.9%
- By 2040
- 399,670 · -3.8%
- By 2050
- 382,616 · -7.9%
- By 2075
- 337,353 · -18.8%
- By 2100
- 283,391 · -31.8%
Race, ethnicity, and origin ACS 2023
- Neighborhood character
- Predominantly White (73%)
- Race & ethnicity
- White 73% Black 19% Hispanic / Latino 5% Two or more races 3%
- Common ancestry
- Lithuanian 2% Slovak 2% Serbian 2%
- Foreign-born
- 2% · Canada, Vietnam
- Languages at home
- 97% English-only · Spanish 2% Vietnamese 1%
Political lean MEDSL · Mobile
- 2024 margin
- R (+16.4) · D 41.3% · R 57.7%
- 2008→2024 swing
- -7.7pp toward R · 2008: -8.7pp · 2024: -16.4pp
- All cycles
- 2024: R+16.4 2020: R+11.9 2016: R+13.9 2012: R+9.3 2008: R+8.7
Not yet ingested
- Civics
- —
Market trends
- HPI YoY
- ▼ -60.58%
- Current HPI
- 217.5112
- Rent YoY
- —
- Metro
- —
- State GDP YoY
- ▲ 2.94%
- F500 in state
- 4
Industry mix (Fortune 500 HQ in AL)
| Industry | F500 HQs | Revenue |
|---|---|---|
| Financial Services | 1 | $8B |
|
||
| Healthcare | 1 | $5B |
|
||
Price history
-14.0% since first listed17 events — show timeline
- 2026-04-29 Pending — GCMLS AL
- 2026-04-28 Relisted — GCMLS AL
- 2026-04-27 Delisted — GCMLS AL
- 2026-04-24 Relisted — GCMLS AL
- 2026-04-17 Pending — GCMLS AL
- 2026-04-05 Relisted — GCMLS AL
- 2026-01-09 Pending — GCMLS AL
- 2026-01-06 Price Changed $62,100 GCMLS AL
- 2026-01-01 Relisted — GCMLS AL
- 2025-10-22 Pending — GCMLS AL
- 2025-09-29 Price Changed $69,000 GCMLS AL
- 2025-09-29 Relisted — GCMLS AL
- 2025-07-03 Pending — GCMLS AL
- 2025-06-25 Relisted — GCMLS AL
- 2025-05-24 Pending — GCMLS AL
- 2025-04-16 Listed $75,000 GCMLS AL
- 2009-06-03 Sold (Public Records) $72,195 Public Records
Property tax history
+15.9%/yrLatest (2025): $695 · +14.6% YoY. Source: county tax records.
Cash-flow waterfall
monthlySold comps — $/sqft
last 12 mo · ≤1 miLoading sold comps…