2536 Northside Dr · Bossier City, LA
Flood risk 1/10 · Minimal
- FEMA flood zone
- X (unshaded)
- Chance of flooding over 30 yrs
- 0.0%
- Est. flood insurance / yr
- $507 – $1,088
Fire risk 1/10 · Minimal
- Est. fire insurance / yr
- $1,269 – $2,357
Heat risk 7/10 · Major
- Hot days now (above 110°F)
- 7 days/yr
- Hot days in 30 yrs
- 21 days/yr
Wind risk 6/10 · Moderate
- Chance of severe wind over 30 yrs
- 63.0%
Air-quality risk 2/10 · Minimal
- Unhealthy air days now
- 1 days/yr
- Unhealthy air days in 30 yrs
- 2 days/yr
Risk factors via First Street. Map © Google.
Why this score? — see what drove the C+ grade
The composite is a weighted blend of 9 inputs, each scored 0–100. Each bar is that input's sub-score; the figure is the points it added to the 100-point composite (weight × sub-score).
- Cash flow +27.7/30.0
- DSCR +9.7/10.0
- 1% rule +6.5/10.0
- ARV discount +5.7/15.0
- Rent growth +4.1/5.0
- Schools +3.8/10.0
- Livability +3.6/5.0
- Condition / age +2.5/5.0
- Appreciation +0.0/10.0
$108,000
🖨 Deal sheet (PDF) 📄 Offer letter ✓ Due diligence
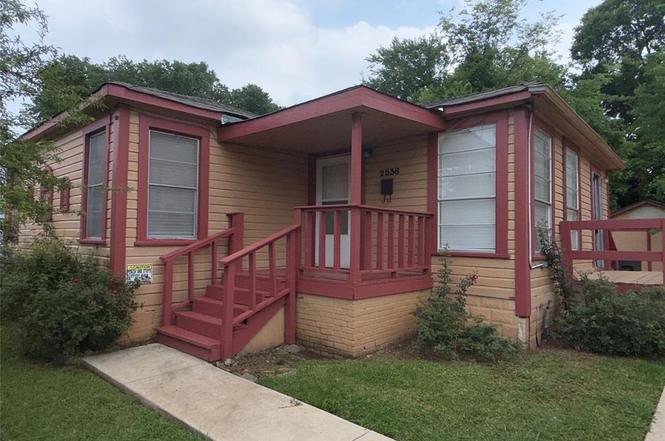
Listing remarks
Step into charm and simplicity with this pier-and-beam cottage that proves great things come in efficient, well-designed spaces. With 2 bedrooms, 1 full bath, and a versatile flex room perfect for a home office or optional third bedroom, this home offers flexibility to fit your lifestyle. Inside find wood-look laminate flooring throughout, creating a cohesive and low-maintenance living space. The galley kitchen is thoughtfully arranged with a refrigerator, microwave, and full-size washer and dryer hookups, and it flows seamlessly into a dedicated dining area, perfect for everyday living or casual entertaining. Just beyond, step out onto a quaint breakfast or bistro-style deck, ideal for mor
Key facts
- Covered porch
- Galley kitchen
- Flex room
Tags
Property features AI
Finance
- Other: Property is not attached and not multi-parcel; Subdivision: Northside Add; County: Bossier; Country: United States; Directions: Between Benton and Airline on Northside (the street by 2Johns Restaurant)
- Financial info: Treat as clear loan type; No second mortgage
- HOA & community: No homeowners association
Exterior
- Parking: Driveway; Garage faces front; Workshop in garage; 1 covered parking space; 1-car garage
- Utilities: City sewer; City water; Electricity connected; Not in a municipal utility district
- Home design: Single family residence; One story; Residential property; Preowned (built in 1960)
- Construction: Shingle roof; Siding and wood construction; Pillar/post/pier foundation; Year built 1960
- Exterior features: Covered porch(es); Covered deck; Large backyard with grass; Chain link fencing; Workshop with electric
Interior
- Kitchen: Electric range; Microwave; Refrigerator
- Bedrooms: 2 bedrooms (both on entry level)
- Flooring: Laminate flooring; Wood flooring
- Bathrooms: 1 full bathroom
- Heating & cooling: Central heating; Central air; Ceiling fan(s)
- Interior features: Eat-in kitchen; Window coverings; One living area; One dining area; 3 total rooms
- Laundry & utility: Laundry area in kitchen; Full-size washer/dryer area
Neighborhood map
What this means for you Summary
Snapshot
- This is a 2-bed/1.0-bath single-family listed at $108k.
Deal economics
- At list price, monthly cash flow is $326 ($4k/yr) — positive.
- The deal already cash-flows at list — no discount required.
- Meets the 1% rule at list price ($1k rent vs $108k).
- Recommended offer: $105k (3.0% below list) — sets the bar for market timing.
- Cap rate 9.9% vs local median 4.7% in Bossier City — top-decile yield for the area; either an underpriced asset or a hidden risk that comps aren't pricing in. Stress-test before assuming the spread holds.
Location & tenants
- Location reads 71/100 on livability (#47 in LA) — a middle-class / working-renter tenant base. Strengths: commute A+, cost of living A+, housing A+; Watch: employment D+, crime F, amenities F.
- Bossier Parish (urban): math 40% / reading 47% proficiency, ranked #17 of 98 in LA (top 17%) — families likely to look elsewhere, expect single-tenant / working-renter base with shorter leases.
- Zoned schools: Plantation Park Elementary School (math 22% / reading 24%, grade F, #408 of 646 statewide, top 64%, 598 students, 92% FRL); Greenacres Middle School (math 24% / reading 33%, grade F, #119 of 218 statewide, top 57%, 611 students, 75% FRL); Airline High School (math 49% / reading 56%, grade C-, #30 of 265 statewide, top 12%, 2,021 students, 56% FRL) — zoned schools average 74% FRL vs 41% district-wide (33 pts higher); higher-poverty schools than district average — tighter screening recommended.
- Market conditions: Rents rising fast (+6.6%/yr); 426 active listings in the ZIP; 9 comparable units currently listed for rent nearby; rentals at typical pace (median 23d on market — plan ~3-4 weeks tenant-placement turnaround); 716 units permitted in Bossier Parish in 2024 (0 in 5+ unit buildings).
Forward outlook
- Local home prices are declining (-3.0%/yr); year-one equity from $747 of loan paydown is wiped out by about $3k of value loss. Plan a longer hold.
- Bossier County population projected at +28% by 2050 — long-run rental-demand tailwind backs the buy-and-hold thesis.
- At projected returns (-3.0% appreciation + 6.6% rent growth), your $30k cash investment doubles in ~7 years — after that, you're playing with house money.
Negotiation context
- It's been on market 51 days — a 3% lower offer ($105k) is reasonable based on typical stale-listing flexibility.
- Current owner paid $41k; list at $108k implies a 163% gain — meaningful room to come down on a strong offer.
Risks & watch-outs
- Climate carrying-cost: major wind risk, 63% chance of damaging wind over 30y; extreme-heat days projected 7→21/yr by 2055 (HVAC capex compounding) — expect insurance premiums to compound above CPI over the hold.
Questions for the listing agent
- It's been on market 51 days. Have you received any prior offers? Is the seller open to a 3% concession, seller financing, or rate buy-down credit?
- Built in 1960 — when were the roof, HVAC, electrical panel, plumbing, and water heater last replaced?
- Is there a deadline driving the sale (1031 exchange, divorce, estate, relocation)? That informs how much negotiation room exists.
- Schools are B-rated — typically a magnet for longer-tenancy family renters. What's the average tenant stay here, and is there a school-zone premium baked into asking?
- Crime grade is F in this area — have there been break-ins, vandalism, or insurance claims at this property in the last 3 years? What carrier currently insures it and at what premium?
- What's the average days-on-market for RENTAL listings here right now (not sales)? A rising rental-DOM trend means longer vacancies and softer asking-rent achievability than the comps imply.
- What's the recent tenant-quality profile in this submarket — average credit score on applications, eviction rate, late-payment / NSF rate, and stable-employment percentage? A property-management company in the area should have these aggregated.
- How much new for-sale + rental construction is in the pipeline within 1–3 miles? Heavy new supply typically softens prices + rents 12–24 months out; constrained supply supports both.
Investment metrics
- 1% rule
- 1.15% ✓
- Cap rate
- 9.91%
- Cash-on-cash
- 12.92%
- DSCR
- 1.57
- GRM
- 7.3
CMA / ARV
- ARV (median comp)
- $103,909
- List price
- $108,000
- Delta
- 3.94%
- Verdict
- FAIR
- Comps
- 20 within 1.0 mi
Show comp detail 12 sales within ~0.75 mi
| Address | Dist | Beds/Ba | Sqft | Sold | Price | $/sf | Match |
|---|---|---|---|---|---|---|---|
| 2608 Northside Dr | 0.08mi | 2/1.0 | 926 (+2%) | 10mo | $89,900 | $97 | 85 |
| 1529 Debra St | 0.25mi | 3/1.0 (+1) | 960 (+5%) | 10mo | $115,000 | $120 | 66 |
| 3103 Shed Rd | 0.67mi | 2/1.0 | 927 (+2%) | 5mo | $81,900 | $88 | 62 |
| 2616 Bardot Ln | 0.13mi | 3/1.0 (+1) | 1,022 (+12%) | 10mo | $129,000 | $126 | 60 |
| 2911 Shiloh Ln | 0.41mi | 3/1.0 (+1) | 863 (-5%) | 14mo | $84,900 | $98 | 56 |
| 2624 Bardot Ln | 0.17mi | 3/1.0 (+1) | 989 (+9%) | 22mo | $45,000 | $46 | 54 |
| 2109 Clovis St | 0.69mi | 2/1.0 | 952 (+4%) | 8mo | $129,500 | $136 | 54 |
| 3113 Malvern | 0.64mi | 3/1.0 (+1) | 939 (+3%) | 11mo | $93,000 | $99 | 51 |
| 2601 Douglas Dr | 0.36mi | 3/1.0 (+1) | 1,026 (+13%) | 10mo | $150,000 | $146 | 49 |
| 2112 Clovis St | 0.71mi | 2/1.0 | 995 (+9%) | 6mo | $124,000 | $125 | 46 |
| 2804 Hood Dr | 0.61mi | 3/1.0 (+1) | 1,027 (+13%) | 3mo | $107,000 | $104 | 43 |
| 3131 Malvern St | 0.68mi | 3/1.0 (+1) | 1,023 (+12%) | 6mo | $97,500 | $95 | 38 |
Match score weights: distance 35% · size 25% · config 20% · recency 20%. Top-matched comps best support the ARV.
Projected returns pro-forma
-3.0% appreciation · 6.56% rent growth · sell at horizon
- IRR
- 6.4%
- Equity multiple
- 1.26×
- Total profit
- $7,786
- Equity at exit
- $16,103
- IRR
- 18.5%
- Equity multiple
- 2.77×
- Total profit
- $53,599
- Equity at exit
- $9,338
Cash invested: $30,240 (down + closing). Projections, not guarantees.
Landlord ↔ Tenant lean methodology
- Overall (STATE)
- 90 Strongly Landlord-Friendly
- State Louisiana
- 90 Strongly Landlord-Friendly · R+12
- County
- — inherits STATE
- City
- — inherits STATE
ZIP-level market 71111
- Home prices YoY
- -34.8%
- Rents YoY
- 6.6%
- Active inventory
- 426
- Price-to-rent
- 7.3×
Monthly cashflow live
- Estimated rent
- $1,238 high interval (Pro) →
- Mortgage (P&I)
- −$566
- Tax from tax record
- −$41 /mo · $495/yr
- Insurance
- −$45
- HOA
- −$0
- Vacancy / Maint / Mgmt
- −$260
- Net cashflow
- $326
Break-even live
Sensitivity live
| Price | -10% $387 | -5% $356 | +0% $326 | +5% $295 | +10% $264 |
|---|---|---|---|---|---|
| Rent | -10% $228 | -5% $277 | +0% $326 | +5% $374 | +10% $423 |
| Rate | -1.0pp $380 | -0.5pp $353 | base $326 | +0.5pp $298 | +1.0pp $269 |
UW: 25.0% down · 7.5% · 30yr · 1.5% tax · 5.0% vac · 8.0% maint · 8.0% mgmt
Financing live
Cash to close
- Down payment
- $27,000
- Closing costs
- $3,240
- Reserves months
- —
- Total cash needed
- —
Loan-product check · same deal, 3 products live
Conventional
25% down · 7.5% · 30yr
- Down + closing
- —
- Monthly P&I
- —
- Monthly cashflow
- —
- DSCR
- —
- Eligible?
- —
Personal DTI + credit; lowest rate.
DSCR
20% down · 8.5% · 30yr
- Down + closing
- —
- Monthly P&I
- —
- Monthly cashflow
- —
- DSCR
- —
- Eligible?
- —
No personal income docs; deal must DSCR.
Hard money
10% down · 12.0% · 12mo
- Down + closing
- —
- Monthly P&I
- —
- Monthly cashflow
- —
- DSCR
- —
- Eligible?
- —
Short-term bridge; refi at stabilization.
Rent comps 9 comps
| Address | Beds | Baths | Sqft | Rent | $/sqft | DOM | Units | Dist |
|---|---|---|---|---|---|---|---|---|
| 1525 Debra St Bossier City, LA | 3.0 | 1.0 | 1033 | $975 | $0.94 | 22d | 1 | 0.26mi |
| 3009 Gaines St Bossier City, LA | 3.0 | 1.0 | 1060 | $1,200 | $1.13 | 22d | 1 | 0.56mi |
| 2804 Hood Dr Bossier City, LA | 3.0 | 1.0 | 1027 | $1,250 | $1.22 | 15d | 1 | 0.59mi |
| 2579 Airline Dr Bossier City, LA | 1.0–2.0 | 1.0–1.5 | 847 | $1,213 | $1.43 | 15d | 6 | 0.78mi |
| 2601 Airline Dr Bossier City, LA | 1.0–2.0 | 1.0–2.0 | 746 | $1,510 | $2.02 | 15d | 10 | 0.91mi |
| 1820 E Texas St Bossier City, LA | 2.0 | 1.0 | 750 | $850 | $1.13 | 45d | 1 | 1.08mi |
| 3325 E Texas St Bossier City, LA | 1.0–2.0 | 1.0–2.0 | 810 | $950 | $1.17 | 22d | 1 | 1.17mi |
| 2604 Benton Rd Bossier City, LA | 1.0 | 1.0 | 713 | $1,160 | $1.63 | 15d | 1 | 1.22mi |
| 400 Preston Blvd Bossier City, LA | 1.0 | 1.0 | 706 | $870 | $1.23 | 45d | 1 | 1.27mi |
Listing history 18 events
-
2026-06-19status $108,000 Pending 51 DOM
-
2026-06-18days on market $108,000 Active Contingent 51 DOM
-
2026-06-17days on market $108,000 Active Contingent 50 DOM
-
2026-06-16days on market $108,000 Active Contingent 49 DOM
-
2026-06-15days on market $108,000 Active Contingent 48 DOM
-
2026-06-14days on market $108,000 Active Contingent 46 DOM
-
2026-06-13days on market $108,000 Active Contingent 45 DOM
-
2026-06-10days on market $108,000 Active Contingent 43 DOM
-
2026-06-09days on market $108,000 Active Contingent 42 DOM
-
2026-06-08days on market $108,000 Active Contingent 41 DOM
-
2026-06-07days on market $108,000 Active Contingent 40 DOM
-
2026-06-02days on market $108,000 Active Contingent 35 DOM
-
2026-06-01days on market $108,000 Active Contingent 34 DOM
-
2026-05-31days on market $108,000 Active Contingent 33 DOM
-
2026-05-30days on market $108,000 Active Contingent 32 DOM
-
2026-05-14price $108,000 1587-char remark
-
2026-04-27$110,000 Active 1587-char remark
-
2006-06-21soldstatus $41,000
ⓘ Source: listings_history table (triggers on properties + properties_extension) + one-shot
backfill from property_details.listing_events for pre-trigger history.
Tax reassessment forecast LA · Resets to sale price
- Current annual tax
- $495 · $41/mo
- Projected year-2 tax
- $594 · $50/mo
- Expected delta
- +$99/yr (+$8/mo · 20.1%)
ⓘ Screening estimate from a state-policy table — verify with the county assessor before closing.
Climate risk First Street
- Flood 1/10 Low FEMA zone X (unshaded) · 0% chance over 30 yrs
- Wildfire 1/10 Low
- Heat 7/10 Severe 7 d/yr ≥110°F today · 21 d/yr by 30 yrs out
- Wind 6/10 Major 63% chance of damaging wind over 30 yrs
- Air quality 2/10 Low 1 unhealthy d/yr today · 2 by 30 yrs out
Nearby sold comps map
Loading sold comps map…
Walkable amenities ~0.75 mi
Loading nearby amenities…
Taxation est. · year 1
- Rental income
- $14,857
- − Mortgage interest
- −$6,050
- − Property taxes
- −$495
- − Insurance
- −$540
- − Repairs & maintenance
- −$1,189
- − Management
- −$1,189
- − Depreciation
- −$3,142
- Taxable income
- $2,254
- Est. tax owed @ 24.0%
- −$541
- After-tax cash flow
- $3,365/yr
For passive investors: Depreciation is non-cash, so a rental often shows a tax loss while cash-flowing — sheltering income. Rental losses are passive: they offset passive income freely, and up to $25,000/yr can offset ordinary (W-2) income if you actively participate and your MAGI is under $100k (phasing out to $0 by $150k); unused losses carry forward. On sale, claimed depreciation is recaptured at up to 25%, and gains may owe capital-gains tax (a 1031 exchange can defer both). Figures are a year-1 estimate at your 24.0% rate — not tax advice; consult a CPA.
Schools (NCES district)
- District
- Bossier Parish
- NCES district ID
- 2200270
- Math proficiency
- 40% ▼ -32.00%
- Reading proficiency
- 47% ▼ -28.00%
- Median HH income
- $51,326
- Composite
- 37.5/100
- National rank
- #4402
- State rank
- #17 of 98 in LA
Livability — Bossier City
- Score
- 71/100
- State rank
- #47
- US rank
- #7044
Category grades
Schools grade is shown separately in the Schools card above.
Census & demographics
- Census place
- Bossier City, LA
- County
- Bossier Parish · 98,704 people
- City population
- 91,925
- Metro
- Shreveport-Bossier City, LA
- Population (ZIP)
- 43,925
- Household income
- $65,292
- Rent vs Own
- Severe rent burden
- 1942.0
Population outlook (Bossier County) Hauer SSP2
- Today (2025)
- 143,247 people
- By 2030
- 151,802 · +6.0%
- By 2040
- 168,194 · +17.4%
- By 2050
- 183,533 · +28.1%
- By 2075
- 217,009 · +51.5%
- By 2100
- 230,091 · +60.6%
Race, ethnicity, and origin ACS 2023
- Neighborhood character
- Diverse neighborhood (Simpson 0.60)
- Race & ethnicity
- White 56% Black 29% Hispanic / Latino 9% Two or more races 8% Asian 3%
- Hispanic origin (detail)
- Mexican 5%
- Common ancestry
- Lithuanian 2% Iranian 1% Slovak 1%
- Foreign-born
- 5% · Canada, Vietnam
- Languages at home
- 90% English-only · Spanish 7% Vietnamese 1% French/Haitian/Cajun 1%
Political lean MEDSL · Bossier
- 2024 margin
- Solid R (+43.3) · D 27.7% · R 71.0% · Other 1.3%
- 2008→2024 swing
- +0.3pp no change · 2008: -43.7pp · 2024: -43.3pp
- All cycles
- 2024: R+43.3 2020: R+41.0 2016: R+45.8 2012: R+45.4 2008: R+43.7
Not yet ingested
- Civics
- —
Market trends
- HPI YoY
- ▼ -79.78%
- Current HPI
- 149.4336
- Rent YoY
- ▲ 6.56%
- Metro
- Shreveport-Bossier City, LA
- State GDP YoY
- ▲ 3.29%
- F500 in state
- 10
Industry mix (Fortune 500 HQ in LA)
| Industry | F500 HQs | Revenue |
|---|---|---|
| Telecommunications | 2 | $23B |
|
||
| Utilities | 1 | $12B |
|
||
| Wholesale / Distribution | 1 | $5B |
|
||
| Advertising | 1 | $2B |
|
||
Price history
+163.4% since first listed5 events — show timeline
- 2026-06-18 Pending — NTREIS
- 2026-05-22 Contingent — NTREIS
- 2026-05-14 Price Changed $108,000 NTREIS
- 2026-04-27 Listed $110,000 NTREIS
- 2006-06-21 Sold (Public Records) $41,000 Public Records
Property tax history
-2.6%/yrLatest (2025): $495 · -1.3% YoY. Source: county tax records.
Cash-flow waterfall
monthlySold comps — $/sqft
last 12 mo · ≤1 miLoading sold comps…