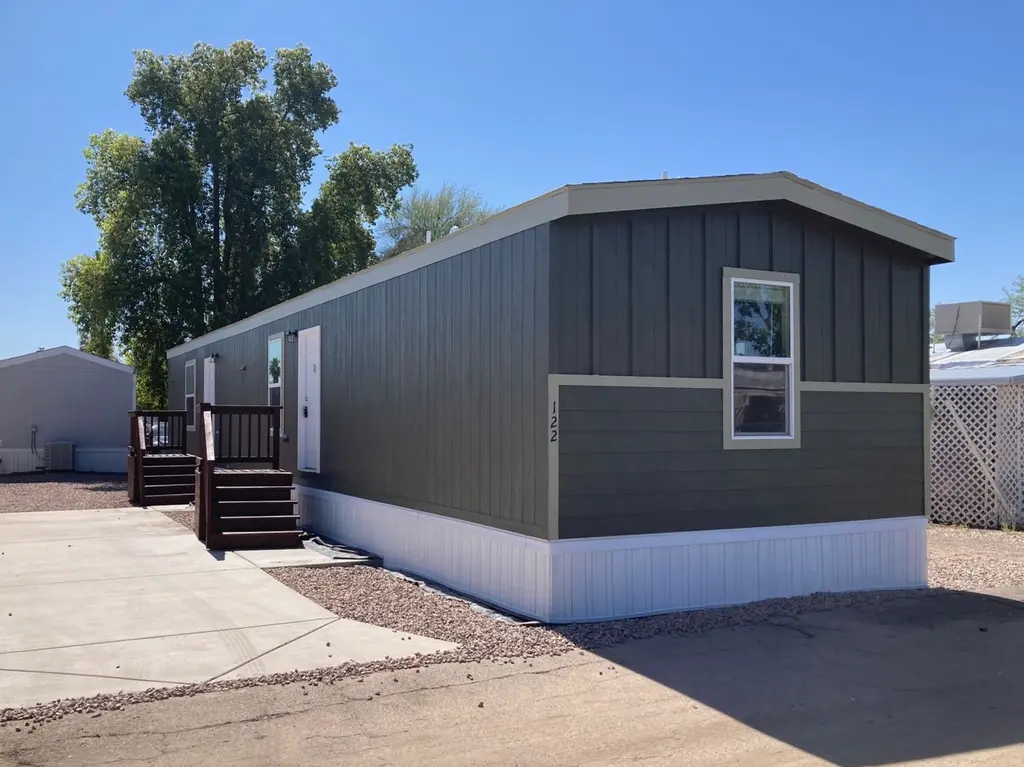
4233 N Flowing Wls #122 · Flowing Wells, AZ
Flood risk 1/10 · Minimal
- FEMA flood zone
- X (unshaded)
- Chance of flooding over 30 yrs
- 0.0%
- Est. flood insurance / yr
- $507 – $1,088
Fire risk 10/10 · Severe
- Est. fire insurance / yr
- $610 – $1,132
Heat risk 8/10 · Major
- Hot days now (above 107°F)
- 6 days/yr
- Hot days in 30 yrs
- 15 days/yr
Wind risk 1/10 · Minimal
- Chance of severe wind over 30 yrs
- —
Air-quality risk 1/10 · Minimal
- Unhealthy air days now
- 0 days/yr
- Unhealthy air days in 30 yrs
- 0 days/yr
Risk factors via First Street. Map © Google.
Why this score? — see what drove the B grade
The composite is a weighted blend of 9 inputs, each scored 0–100. Each bar is that input's sub-score; the figure is the points it added to the 100-point composite (weight × sub-score).
- Cash flow +30.0/30.0
- 1% rule +10.0/10.0
- DSCR +10.0/10.0
- ARV discount +7.5/15.0
- Condition / age +4.8/5.0
- Livability +3.7/5.0
- Rent growth +2.6/5.0
- Schools +2.2/10.0
- Appreciation +0.0/10.0
$49,900
🖨 Deal sheet 📄 Offer letter ✓ Due diligence
Listing remarks
Your brand new 3 bedroom, 2 bathroom home is waiting for you to move in! This comfortable home features premium entry doors, a modern bathroom, as well as new brand name appliances. In the community, enjoy with your friends and family all the amenities we have to offer such as a swimming pool, a hot tub, and a clubhouse. This home won't be on the market long, so call us today for more information or to schedule a tour. Deposits & Fees are subject to change.
Key facts
- Hot tub
- Clubhouse
- Swimming pool
Tags
Property features AI
Finance
- Other: Active listing (last modified 2026-06-12)
- Financial info: List price $49,900
Exterior
- Utilities: Natural gas; Central air conditioning
- Home design: Spec-built property
- Exterior features: Living area of 1024
Interior
- Bedrooms: 3 bedrooms
- Heating & cooling: Natural gas heating; Central air conditioning
- Interior features: 2 bathrooms (total)
Neighborhood map
What this means for you Summary
Snapshot
- This is a 3-bed/2.0-bath manufactured listed at $50k. Condition is rated excellent.
Deal economics
- At list price, monthly cash flow is $761 ($9k/yr) — positive.
- The deal already cash-flows at list — no discount required.
- Meets the 1% rule at list price ($1k rent vs $50k).
- Cap rate 24.6% vs local median 6.1% in Flowing Wells — top-decile yield for the area; either an underpriced asset or a hidden risk that comps aren't pricing in. Stress-test before assuming the spread holds.
Location & tenants
- Location reads 73/100 on livability (#21 in AZ) — a middle-class / working-renter tenant base. Strengths: commute A+, cost of living A+, health & safety A+; Watch: schools D+, crime F, amenities F.
- Flowing Wells Unified District (4405) (suburban): math 23% / reading 30% proficiency, ranked #143 of 249 in AZ (top 57%) — low school quality limits family demand, transient renter base, plan for 1-2y turnover; 64% free/reduced lunch — lower-income household profile, screen leases tightly.
- Market conditions: Rents flat; 177 active listings in the ZIP; 38 comparable units currently listed for rent nearby; rentals lingering (median 44d on market — plan ~5-8 weeks vacancy on turnover, expect pricing pressure); 53% of comp listings sitting > 30 days — soft ceiling on asking rent; lower-income renter base — watch delinquency; 5,268 units permitted in Pima County in 2024 (996 in 5+ unit buildings).
- At $1,400/mo this rent would consume 45% of the median local household income ($37k/yr) (locally 4240% of renters already pay >50% of income on rent) — very limited rent-growth headroom before tenants either downsize or default.
Forward outlook
- Local home prices are declining (-3.0%/yr); year-one equity from $345 of loan paydown is wiped out by about $1k of value loss. Plan a longer hold.
- Pima County population projected at +8% by 2050 — modest demand growth; plan on rents tracking national, not racing it.
- At projected returns (-3.0% appreciation + 0.3% rent growth), your $14k cash investment doubles in ~2 years — after that, you're playing with house money.
Negotiation context
- Only 6 days on market — expect competitive offers; lowballing is unlikely to land.
Risks & watch-outs
- Climate carrying-cost: severe wildfire risk; extreme-heat days projected 6→15/yr by 2055 (HVAC capex compounding) — expect insurance premiums to compound above CPI over the hold.
Questions for the listing agent
- Is there a deadline driving the sale (1031 exchange, divorce, estate, relocation)? That informs how much negotiation room exists.
- Schools are D-rated, which usually means shorter tenancies and higher turnover. Who's the typical renter profile here, and what's been the actual vacancy rate?
- Crime grade is F in this area — have there been break-ins, vandalism, or insurance claims at this property in the last 3 years? What carrier currently insures it and at what premium?
- What's the average days-on-market for RENTAL listings here right now (not sales)? A rising rental-DOM trend means longer vacancies and softer asking-rent achievability than the comps imply.
- What's the recent tenant-quality profile in this submarket — average credit score on applications, eviction rate, late-payment / NSF rate, and stable-employment percentage? A property-management company in the area should have these aggregated.
- How much new for-sale + rental construction is in the pipeline within 1–3 miles? Heavy new supply typically softens prices + rents 12–24 months out; constrained supply supports both.
Investment metrics
- 1% rule
- 2.80% ✓
- Cap rate
- 24.59%
- Cash-on-cash
- 65.34%
- DSCR
- 3.91
- GRM
- 3.0
CMA / ARV
- ARV (on-the-fly)
- $179,200
- Comps found
- 12
Show comp detail 12 sales within ~0.75 mi
| Address | Dist | Beds/Ba | Sqft | Sold | Price | $/sf | Match |
|---|---|---|---|---|---|---|---|
| 4452 N Obetka Ave | 0.38mi | 2/2.0 (-1) | 1,079 (+5%) | 5mo | $87,000 | $81 | 64 |
| 1225 W Allegheny St | 0.64mi | 2/2.0 (-1) | 1,074 (+5%) | 4mo | $145,000 | $135 | 53 |
| 1663 W Seabrooke Dr | 0.65mi | 3/2.0 | 1,056 (+3%) | 14mo | $210,000 | $199 | 53 |
| 1273 W Allegheny St | 0.61mi | 2/1.0 (-1) | 1,000 (-2%) | 9mo | $159,000 | $159 | 51 |
| 1924 W Desert Broom Ln | 0.58mi | 2/2.0 (-1) | 924 (-10%) | 1mo | $161,500 | $175 | 51 |
| 1735 W Seabrooke Dr | 0.69mi | 2/2.0 (-1) | 1,056 (+3%) | 8mo | $215,000 | $204 | 50 |
| 1218 W Allegheny St | 0.68mi | 2/2.0 (-1) | 960 (-6%) | 3mo | $195,000 | $203 | 50 |
| 1629 W Ruth St | 0.71mi | 2/2.0 (-1) | 1,077 (+5%) | 5mo | $205,000 | $190 | 49 |
| 4439 N Old Romero Rd #49 | 0.61mi | 3/2.0 | 1,150 (+12%) | 11mo | $45,000 | $39 | 42 |
| 4611 N Camino Feliz | 0.51mi | 2/1.0 (-1) | 900 (-12%) | 13mo | $125,000 | $139 | 36 |
| 850 W Limberlost Dr | 0.66mi | 3/1.0 | 911 (-11%) | 14mo | $118,000 | $130 | 35 |
| 4761 N Brookline Ct | 0.73mi | 2/2.0 (-1) | 882 (-14%) | 4mo | $209,900 | $238 | 34 |
Match score weights: distance 35% · size 25% · config 20% · recency 20%. Top-matched comps best support the ARV.
Projected returns pro-forma
-3.0% appreciation · 0.3% rent growth · sell at horizon
- IRR
- 61.4%
- Equity multiple
- 3.63×
- Total profit
- $36,688
- Equity at exit
- $7,440
- IRR
- 65.1%
- Equity multiple
- 6.73×
- Total profit
- $80,035
- Equity at exit
- $4,314
Cash invested: $13,972 (down + closing). Projections, not guarantees.
Landlord ↔ Tenant lean methodology
- Overall (STATE)
- 87 Strongly Landlord-Friendly
- State Arizona
- 87 Strongly Landlord-Friendly · R+3
- County
- — inherits STATE
- City
- — inherits STATE
ZIP-level market 85705
- Rents YoY
- 0.3%
- Active inventory
- 177
- Price-to-rent
- 3.0×
Monthly cashflow live
- Estimated rent
- $1,400 high interval (Pro) →
- Mortgage (P&I)
- −$262
- Tax est. 1.5%
- −$62 /mo · $748/yr
- Insurance
- −$21
- HOA
- −$0
- Vacancy / Maint / Mgmt
- −$294
- Net cashflow
- $761
Break-even live
UW: 25.0% down · 7.5% · 30yr · 1.5% tax · 5.0% vac · 8.0% maint · 8.0% mgmt
Financing live
Cash to close
- Down payment
- $12,475
- Closing costs
- $1,497
- Reserves months
- —
- Total cash needed
- —
Loan-product check · same deal, 3 products live
Conventional
25% down · 7.5% · 30yr
- Down + closing
- —
- Monthly P&I
- —
- Monthly cashflow
- —
- DSCR
- —
- Eligible?
- —
Personal DTI + credit; lowest rate.
DSCR
20% down · 8.5% · 30yr
- Down + closing
- —
- Monthly P&I
- —
- Monthly cashflow
- —
- DSCR
- —
- Eligible?
- —
No personal income docs; deal must DSCR.
Hard money
10% down · 12.0% · 12mo
- Down + closing
- —
- Monthly P&I
- —
- Monthly cashflow
- —
- DSCR
- —
- Eligible?
- —
Short-term bridge; refi at stabilization.
Rent comps 38 comps
| Address | Beds | Baths | Sqft | Rent | $/sqft | DOM | Units | Dist |
|---|---|---|---|---|---|---|---|---|
| 4111 N Flowing Wells Rd Tucson, AZ | 2.0 | 2.0–2.5 | 1131 | $1,625 | $1.44 | 23d | 3 | 0.12mi |
| 1357 W Talisman St Tucson, AZ | 4.0 | 1.0 | 1200 | $1,100 | $0.92 | 23d | 1 | 0.16mi |
| 1501 W Roger Rd Tucson, AZ | 2.0 | 1.0 | 850 | $995 | $1.17 | 43d | 1 | 0.27mi |
| 1355 W Roger Rd Tucson, AZ | 1.0–2.0 | 1.0–2.0 | 627 | $1,084 | $1.73 | 43d | 4 | 0.35mi |
| 1215 W Roger Rd Unit 1201-01 Tucson, AZ | 3.0 | 1.5 | 1000 | $1,595 | $1.59 | 43d | 1 | 0.40mi |
| 1215 W Roger Rd Unit 1215-11 Tucson, AZ | 2.0 | 1.0 | 770 | $1,100 | $1.43 | 3d | 1 | 0.40mi |
| 1215 W Roger Rd Unit 1201-13 Tucson, AZ | 3.0 | 1.5 | 1000 | $1,595 | $1.59 | 3d | 1 | 0.40mi |
| 1215 W Roger Rd Unit 1241-04 Tucson, AZ | 2.0 | 1.0 | 770 | $1,100 | $1.43 | 16d | 1 | 0.40mi |
| 4213 N Romero Rd Tucson, AZ | 2.0 | 1.0 | 825 | $1,045 | $1.27 | 43d | 5 | 0.41mi |
| 1865 W La Osa St Tucson, AZ | 2.0 | 1.0 | 821 | $1,450 | $1.77 | 43d | 1 | 0.52mi |
| 1132 W Knox Pl Tucson, AZ | 4.0 | 2.0 | 1322 | $1,849 | $1.40 | 43d | 1 | 0.53mi |
| 4030 N Fairview Ave Tucson, AZ | 3.0 | 2.0 | 1500 | $1,700 | $1.13 | 43d | 1 | 0.65mi |
| 1700 W Prince Rd Tucson, AZ | 1.0–2.0 | 1.0 | 618 | $1,099 | $1.78 | 1d | 25 | 0.69mi |
| 4751 N Flowing Wells Rd Tucson, AZ | 3.0 | 3.0 | 1500 | $1,500 | $1.00 | 43d | 1 | 0.71mi |
| 1448 W Kilburn St Tucson, AZ | 2.0 | 1.0 | 910 | $1,350 | $1.48 | 43d | 1 | 0.88mi |
| 822 W Thurber Rd Unit B Tucson, AZ | 2.0 | 1.0 | 750 | $825 | $1.10 | 43d | 1 | 0.92mi |
| 1435 W Kilburn St Apt 2102 Tucson, AZ | 2.0 | 2.5 | 1202 | $1,495 | $1.24 | 43d | 1 | 0.94mi |
| 1021 W Edgewater Dr Tucson, AZ | 4.0 | 2.0 | 1431 | $1,940 | $1.36 | 43d | 1 | 0.99mi |
| 5021 N Kevy Pl Tucson, AZ | 3.0 | 2.0 | 1350 | $1,650 | $1.22 | 43d | 1 | 1.05mi |
| 4861 N River Vista Dr Tucson, AZ | 3.0 | 2.0 | 1144 | $1,500 | $1.31 | 3d | 1 | 1.07mi |
| 557 W Thurber Rd Tucson, AZ | 2.0 | 1.0 | 800 | $1,050 | $1.31 | 43d | 3 | 1.09mi |
| 1100 W River Rd Unit 7 Tucson, AZ | 2.0 | 2.5 | 1026 | $2,200 | $2.14 | 20d | 1 | 1.11mi |
| 1100 W River Rd Unit 14 Tucson, AZ | 3.0 | 2.5 | 1187 | $2,450 | $2.06 | 1d | 1 | 1.11mi |
| 1100 W River Rd Tucson, AZ | 3.0 | 2.5 | 1187 | $2,250 | $1.90 | 1d | 1 | 1.11mi |
| 5077 N Fortune Teller Way Tucson, AZ | 3.0 | 2.5 | 1370 | $1,875 | $1.37 | 17d | 1 | 1.12mi |
| 570 W Prince Rd Tucson, AZ | 1.0–2.0 | 1.0 | 788 | $975 | $1.24 | 43d | 13 | 1.13mi |
| 5100 N La Canada Dr Tucson, AZ | 2.0 | 2.0 | 938 | $1,408 | $1.50 | 43d | 1 | 1.13mi |
| 5132 Prairie Clover Trl Tucson, AZ | 3.0–4.0 | 2.0–2.5 | 1604 | $1,897 | $1.18 | 1d | 13 | 1.27mi |
| 331 W Pastime Rd Tucson, AZ | 2.0 | 2.0 | 850 | $1,082 | $1.27 | 11d | 2 | 1.28mi |
| 4190 N Western Winds Dr Tucson, AZ | 2.0 | 1.0 | 918 | $1,349 | $1.47 | 43d | 1 | 1.32mi |
| 4190 N Western Winds Dr Tucson, AZ | 2.0 | 1.0 | 918 | $1,349 | $1.47 | 23d | 1 | 1.32mi |
| 223 W Knox Dr Tucson, AZ | 4.0 | 2.0 | 1456 | $2,000 | $1.37 | 43d | 1 | 1.33mi |
| 115 W Limberlost Dr Tucson, AZ | 1.0–2.0 | 1.0–2.0 | 806 | $1,350 | $1.67 | 23d | 1 | 1.38mi |
| 156 W Pastime Rd Tucson, AZ | 3.0 | 2.0 | 1162 | $1,535 | $1.32 | 43d | 1 | 1.43mi |
| 3985 N Stone Ave Tucson, AZ | 1.0–2.0 | 1.0–2.0 | 625 | $1,280 | $2.05 | 43d | 1 | 1.46mi |
| 3985 N Stone Ave Tucson, AZ | 1.0–2.0 | 1.0–2.0 | 625 | $1,075 | $1.72 | 16d | 21 | 1.46mi |
| 3985 N Stone Ave Unit 248 Tucson, AZ | 2.0 | 1.0 | 700 | $979 | $1.40 | 11d | 1 | 1.47mi |
| 3055 N Flowing Wells Rd Tucson, AZ | 1.0–2.0 | 1.0 | 652 | $1,099 | $1.68 | 3d | 3 | 1.47mi |
Listing history 6 events
-
2026-06-18days on market $49,900 Active 6 DOM
-
2026-06-17days on market $49,900 Active 5 DOM
-
2026-06-16days on market $49,900 Active 4 DOM
-
2026-06-15days on market $49,900 Active 3 DOM
-
2026-06-13remarks 463-char remark
-
2026-06-13$49,900 Active 1 DOM
ⓘ Source: listings_history table (triggers on properties + properties_extension) + one-shot
backfill from property_details.listing_events for pre-trigger history.
Climate risk First Street
- Flood 1/10 Low FEMA zone X (unshaded) · 0% chance over 30 yrs
- Wildfire 10/10 Extreme
- Heat 8/10 Severe 6 d/yr ≥107°F today · 15 d/yr by 30 yrs out
- Wind 1/10 Low
- Air quality 1/10 Low 0 unhealthy d/yr today · 0 by 30 yrs out
Nearby sold comps map
Loading sold comps map…
Walkable amenities ~0.75 mi
Loading nearby amenities…
Taxation est. · year 1
- Rental income
- $16,795
- − Mortgage interest
- −$2,795
- − Property taxes
- −$748
- − Insurance
- −$250
- − Repairs & maintenance
- −$1,344
- − Management
- −$1,344
- − Depreciation
- −$1,452
- Taxable income
- $8,863
- Est. tax owed @ 24.0%
- −$2,127
- After-tax cash flow
- $7,003/yr
For passive investors: Depreciation is non-cash, so a rental often shows a tax loss while cash-flowing — sheltering income. Rental losses are passive: they offset passive income freely, and up to $25,000/yr can offset ordinary (W-2) income if you actively participate and your MAGI is under $100k (phasing out to $0 by $150k); unused losses carry forward. On sale, claimed depreciation is recaptured at up to 25%, and gains may owe capital-gains tax (a 1031 exchange can defer both). Figures are a year-1 estimate at your 24.0% rate — not tax advice; consult a CPA.
Condition & rehab AI · 6 photos
This brand new 3-bedroom, 2-bathroom home is move-in ready with modern amenities and a clean, well-maintained appearance. It offers a great value for both resale and rental markets.
Value-add opportunities
- Both Landscaping — Enhances curb appeal and adds value
- Both Painting exterior — Fresh paint can improve curb appeal and value
- Both Landscaping and curb appeal — Improves curb appeal and adds value
Renovation cost estimate screening
Value-add ROI direction
- Both Landscaping — Enhances curb appeal and adds value ↑
- Both Painting exterior — Fresh paint can improve curb appeal and value ↑
- Both Landscaping and curb appeal — Improves curb appeal and adds value ↑
ⓘ Cost ranges are severity-bucket heuristics (US national rule-of-thumb). Get contractor quotes + a written scope before underwriting a rehab budget.
Schools (NCES district)
- District
- Flowing Wells Unified District (4405)
- NCES district ID
- 0403010
- Math proficiency
- 23% ▼ -19.00%
- Reading proficiency
- 30% ▼ -14.00%
- Median HH income
- $33,361
- Composite
- 21.69/100
- National rank
- #8271
- State rank
- #143 of 249 in AZ
Livability — Flowing Wells
- Score
- 73/100
- State rank
- #21
- US rank
- #5288
Category grades
Schools grade is shown separately in the Schools card above.
Census & demographics
- Census place
- Flowing Wells, AZ
- County
- Pima County · 1,012,107 people
- Metro
- Tucson, AZ
- Population (ZIP)
- 54,700
- Household income
- $37,194
- Rent vs Own
- Severe rent burden
- 4240.0
Population outlook (Pima County) Hauer SSP2
- Today (2025)
- 1,066,056 people
- By 2030
- 1,086,684 · +1.9%
- By 2040
- 1,117,160 · +4.8%
- By 2050
- 1,149,778 · +7.9%
- By 2075
- 1,271,480 · +19.3%
- By 2100
- 1,321,160 · +23.9%
Race, ethnicity, and origin ACS 2023
- Neighborhood character
- Diverse neighborhood (Simpson 0.63)
- Race & ethnicity
- Hispanic / Latino 45% White 41% Two or more races 18% Asian 4% Black 3% Native American 3%
- Hispanic origin (detail)
- Mexican 41%
- Common ancestry
- Portuguese 2% Romanian 2% Lithuanian 2%
- Foreign-born
- 18% · Canada, China, Vietnam
- Languages at home
- 65% English-only · Spanish 30% Chinese 1% Vietnamese 1%
Political lean MEDSL · Pima
- 2024 margin
- D (+15.2) · D 57.0% · R 41.8% · Other 1.2%
- 2008→2024 swing
- +9.1pp toward D · 2008: 6.1pp · 2024: 15.2pp
- All cycles
- 2024: D+15.2 2020: D+18.7 2016: D+13.5 2012: D+5.8 2008: D+6.1
Not yet ingested
- Civics
- —
Market trends
- HPI YoY
- ▼ -163.31%
- Current HPI
- 283.0647
- Rent YoY
- ▲ 0.30%
- Metro
- Tucson, AZ
- State GDP YoY
- ▲ 4.54%
- F500 in state
- 20
Industry mix (Fortune 500 HQ in AZ)
| Industry | F500 HQs | Revenue |
|---|---|---|
| Technology | 2 | $13B |
|
||
| Mining / Metals | 1 | $23B |
|
||
| Environmental Services | 1 | $16B |
|
||
| Metals / Steel | 1 | $14B |
|
||
| Technology Distribution | 1 | $9B |
|
||
| Homebuilding | 1 | $8B |
|
||
Cash-flow waterfall
monthlySold comps — $/sqft
last 12 mo · ≤1 miLoading sold comps…