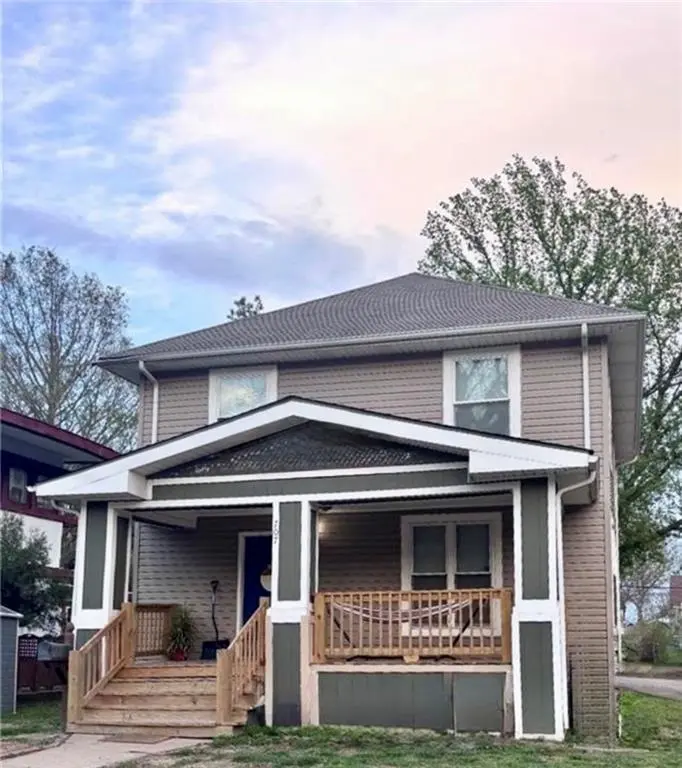
707 S Park Ave · Independence, MO
Flood risk 1/10 · Minimal
- FEMA flood zone
- X (unshaded)
- Chance of flooding over 30 yrs
- 0.0%
- Est. flood insurance / yr
- $473 – $860
Fire risk 1/10 · Minimal
- Est. fire insurance / yr
- $1,054 – $1,958
Heat risk 4/10 · Minor
- Hot days now (above 106°F)
- 7 days/yr
- Hot days in 30 yrs
- 17 days/yr
Wind risk 2/10 · Minimal
- Chance of severe wind over 30 yrs
- —
Air-quality risk 3/10 · Minor
- Unhealthy air days now
- 3 days/yr
- Unhealthy air days in 30 yrs
- 3 days/yr
Risk factors via First Street. Map © Google.
Why this score? — see what drove the D grade
The composite is a weighted blend of 9 inputs, each scored 0–100. Each bar is that input's sub-score; the figure is the points it added to the 100-point composite (weight × sub-score).
- ARV discount +12.7/15.0
- Cash flow +10.2/30.0
- Livability +4.1/5.0
- Rent growth +3.9/5.0
- DSCR +2.9/10.0
- 1% rule +2.7/10.0
- Schools +2.7/10.0
- Condition / age +2.5/5.0
- Appreciation +0.0/10.0
$184,900
🖨 Deal sheet (PDF) 📄 Offer letter ✓ Due diligence
Listing remarks MLS
This practical 3 bed, 2 bath home offers 1,560 sq ft of well-designed living space that feels both open and functional. Natural light fills the home, highlighting the spacious layout and comfortable flow between living, dining, and kitchen areas, perfect for everyday living or hosting. Generous room sizes provide flexibility, while the outdoor space gives you room to relax or entertain. Conveniently located near schools, shopping, dining, and major highways for an easy commute. Tons of opportunity to add your own style over time. Perfect for a first-time buyer or an investor looking for a great addition to their portfolio.
Key facts
- 8,712 sq ft lot
- Built 1915
- Listed 42 days
Neighborhood map
What this means for you Summary
Snapshot
- This is a 3-bed/1.5-bath single-family listed at $185k.
Deal economics
- At list price, monthly cash flow is $-106 ($-1k/yr) — negative.
- To cash-flow at today's rent, offer at most $166k (10.1% below list).
- To meet the 1% rule (rent ≥ 1% of price), the offer needs to be $142k (23.1% below list).
- Recommended offer: $142k (23.1% below list) — sets the bar for 1% rule.
Location & tenants
- Location reads 82/100 on livability (#10 in MO, #1,296 nationally) — a professional / high-income tenant draw. Strengths: amenities A+, commute A+, cost of living A+; Watch: schools C-, employment D+, crime F.
- Independence 30 (suburban): math 26% / reading 38% proficiency, ranked #252 of 324 in MO (top 78%) — families likely to look elsewhere, expect single-tenant / working-renter base with shorter leases.
- Market conditions: Rents rising fast (+5.4%/yr); 134 active listings in the ZIP; 14 comparable units currently listed for rent nearby; rentals at typical pace (median 18d on market — plan ~3-4 weeks tenant-placement turnaround); 4,002 units permitted in Jackson County in 2024 (2,271 in 5+ unit buildings).
Forward outlook
- Local home prices are declining (-3.0%/yr); year-one equity from $1k of loan paydown is wiped out by about $6k of value loss. Plan a longer hold.
- Jackson County population projected at +4% by 2050 — modest demand growth; plan on rents tracking national, not racing it.
Negotiation context
- It's been on market 42 days — a 3% lower offer ($179k) is reasonable based on typical stale-listing flexibility.
- 4 sale attempts since 8y ago; this cycle's ask has dropped $14k (7%) from the opening price — seller is motivated, your offer sets the floor, not the list.
Risks & watch-outs
- Watch-outs: built in 1915 — expect roof / HVAC / electrical / plumbing capex.
Questions for the listing agent
- What do current leases actually rent for vs. the listed asking? Can we see a recent rent roll and the last 12 months of T-12 income?
- It's been on market 42 days. Have you received any prior offers? Is the seller open to a 23% concession, seller financing, or rate buy-down credit?
- Built in 1915 — when were the roof, HVAC, electrical panel, plumbing, and water heater last replaced?
- Is there a deadline driving the sale (1031 exchange, divorce, estate, relocation)? That informs how much negotiation room exists.
- Crime grade is F in this area — have there been break-ins, vandalism, or insurance claims at this property in the last 3 years? What carrier currently insures it and at what premium?
- The area grade is low — what's the realistic commute time and amenity access for the typical tenant pool here? Any planned neighborhood developments (good or bad) we should know about?
- What's the average days-on-market for RENTAL listings here right now (not sales)? A rising rental-DOM trend means longer vacancies and softer asking-rent achievability than the comps imply.
- What's the recent tenant-quality profile in this submarket — average credit score on applications, eviction rate, late-payment / NSF rate, and stable-employment percentage? A property-management company in the area should have these aggregated.
- How much new for-sale + rental construction is in the pipeline within 1–3 miles? Heavy new supply typically softens prices + rents 12–24 months out; constrained supply supports both.
Investment metrics
- 1% rule
- 0.77% ✗
- Cap rate
- 5.61%
- Cash-on-cash
- -2.45%
- DSCR
- 0.89
- GRM
- 10.8
CMA / ARV
- ARV (median comp)
- $209,036
- List price
- $184,900
- Delta
- -11.55%
- Verdict
- UNDERPRICED
- Comps
- 20 within 1.0 mi
Show comp detail 12 sales within ~0.75 mi
| Address | Dist | Beds/Ba | Sqft | Sold | Price | $/sf | Match |
|---|---|---|---|---|---|---|---|
| 809 S Crysler Ave | 0.19mi | 2/2.0 (-1) | 1,547 (-1%) | 5mo | $150,000 | $97 | 78 |
| 2020 S Vermont Ave | 0.49mi | 2/2.5 (-1) | 1,596 (+2%) | 7mo | $199,000 | $125 | 58 |
| 1795 S Norwood Ave | 0.32mi | 3/2.5 | 1,704 (+9%) | 12mo | $259,000 | $152 | 56 |
| 1613 S Norwood Ave | 0.35mi | 2/1.0 (-1) | 1,363 (-13%) | 1mo | $160,000 | $117 | 55 |
| 611 W 23rd St | 0.73mi | 2/1.0 (-1) | 1,520 (-3%) | 2mo | $144,900 | $95 | 53 |
| 1809 S Sterling Ave | 0.59mi | 3/2.5 | 1,647 (+6%) | 9mo | $214,900 | $130 | 51 |
| 1311 W Bryson St | 0.68mi | 4/2.0 (+1) | 1,532 (-2%) | 9mo | $209,999 | $137 | 51 |
| 1835 S Claremont Ave | 0.49mi | 3/3.0 | 1,400 (-10%) | 9mo | $155,000 | $111 | 47 |
| 1110 24th St | 0.67mi | 3/2.5 | 1,747 (+12%) | 3mo | $245,900 | $141 | 43 |
| 1215 Leoti St | 0.64mi | 2/2.0 (-1) | 1,759 (+13%) | 4mo | $142,000 | $81 | 38 |
| 314 N Crysler Ave | 0.67mi | 3/3.0 | 1,718 (+10%) | 9mo | $215,000 | $125 | 38 |
| 2258 S Sterling Ave E | 0.71mi | 4/2.5 (+1) | 1,741 (+12%) | 8mo | $190,000 | $109 | 32 |
Match score weights: distance 35% · size 25% · config 20% · recency 20%. Top-matched comps best support the ARV.
Projected returns pro-forma
-3.0% appreciation · 5.43% rent growth · sell at horizon
- IRR
- -17.8%
- Equity multiple
- 0.36×
- Total profit
- $-33,138
- Equity at exit
- $27,569
- IRR
- -6.0%
- Equity multiple
- 0.57×
- Total profit
- $-22,195
- Equity at exit
- $15,987
Cash invested: $51,772 (down + closing). Projections, not guarantees.
Landlord ↔ Tenant lean methodology
- Overall (STATE)
- 81 Strongly Landlord-Friendly
- State Missouri
- 81 Strongly Landlord-Friendly · R+10
- County
- — inherits STATE
- City
- — inherits STATE
ZIP-level market 64052
- Home prices YoY
- -34.6%
- Rents YoY
- 5.4%
- Active inventory
- 134
- Price-to-rent
- 10.8×
Monthly cashflow live
- Estimated rent
- $1,422 high interval (Pro) →
- Mortgage (P&I)
- −$970
- Tax from tax record
- −$182 /mo · $2,190/yr
- Insurance
- −$77
- HOA
- −$0
- Vacancy / Maint / Mgmt
- −$299
- Net cashflow
- $-106
Break-even live
Sensitivity live
| Price | -10% $-1 | -5% $-53 | +0% $-106 | +5% $-158 | +10% $-210 |
|---|---|---|---|---|---|
| Rent | -10% $-218 | -5% $-162 | +0% $-106 | +5% $-49 | +10% $7 |
| Rate | -1.0pp $-13 | -0.5pp $-59 | base $-106 | +0.5pp $-154 | +1.0pp $-202 |
UW: 25.0% down · 7.5% · 30yr · 1.5% tax · 5.0% vac · 8.0% maint · 8.0% mgmt
Financing live
Cash to close
- Down payment
- $46,225
- Closing costs
- $5,547
- Reserves months
- —
- Total cash needed
- —
Loan-product check · same deal, 3 products live
Conventional
25% down · 7.5% · 30yr
- Down + closing
- —
- Monthly P&I
- —
- Monthly cashflow
- —
- DSCR
- —
- Eligible?
- —
Personal DTI + credit; lowest rate.
DSCR
20% down · 8.5% · 30yr
- Down + closing
- —
- Monthly P&I
- —
- Monthly cashflow
- —
- DSCR
- —
- Eligible?
- —
No personal income docs; deal must DSCR.
Hard money
10% down · 12.0% · 12mo
- Down + closing
- —
- Monthly P&I
- —
- Monthly cashflow
- —
- DSCR
- —
- Eligible?
- —
Short-term bridge; refi at stabilization.
Rent comps 14 comps
| Address | Beds | Baths | Sqft | Rent | $/sqft | DOM | Units | Dist |
|---|---|---|---|---|---|---|---|---|
| 11709 E Winner Rd Independence, MO | 3.0 | 1.5 | 1300 | $1,195 | $0.92 | 17d | 1 | 0.14mi |
| 11418 E 13th St S Independence, MO | 2.0 | 1.0 | 1760 | $1,100 | $0.62 | 45d | 1 | 0.56mi |
| 2356 S Crysler Ave Independence, MO | 3.0 | 2.0 | 1881 | $1,653 | $0.88 | 25d | 1 | 0.59mi |
| 2110 S Sterling Ave Independence, MO | 3.0 | 2.0 | 1722 | $1,849 | $1.07 | 17d | 1 | 0.66mi |
| 2256 S Sterling Ave Independence, MO | 3.0 | 1.5 | 1284 | $1,399 | $1.09 | 17d | 1 | 0.70mi |
| 10817 E 19th Ter S Independence, MO | 3.0 | 1.0 | 1428 | $1,801 | $1.26 | 17d | 1 | 0.78mi |
| 1425 S Northern Blvd Independence, MO | 3.0 | 1.5 | 1275 | $1,200 | $0.94 | 9d | 1 | 0.91mi |
| 1502 S Pleasant St Independence, MO | 3.0 | 2.0 | 1200 | $1,399 | $1.17 | 45d | 1 | 1.04mi |
| 1404 S Osage St Independence, MO | 4.0 | 2.0 | 1300 | $1,750 | $1.35 | 16d | 1 | 1.08mi |
| 1109 S Appleton Ave Independence, MO | 3.0 | 2.0 | 1200 | $1,195 | $1.00 | 17d | 1 | 1.11mi |
| 10604 E 26th St S Independence, MO | 3.0 | 1.0 | 1068 | $1,610 | $1.51 | 9d | 1 | 1.21mi |
| 11323 E Thompson St Sugar Creek, MO | 3.0 | 2.5 | 1794 | $1,800 | $1.00 | 13d | 1 | 1.33mi |
| 2920 S Harvard Ave Unit A Independence, MO | 4.0 | 2.5 | 1200 | $1,650 | $1.38 | 45d | 1 | 1.38mi |
| 182 Novak St Sugar Creek, MO | 3.0 | 2.0 | 1350 | $1,800 | $1.33 | 18d | 1 | 1.39mi |
Listing history 33 events
-
2026-06-18status $184,900 Pending 42 DOM
-
2026-06-17days on market $184,900 Active 42 DOM
-
2026-06-16days on market $184,900 Active 41 DOM
-
2026-06-15days on market $184,900 Active 40 DOM
-
2026-06-13remarks 633-char remark
-
2026-06-13pricedays on market $184,900 Active 38 DOM
-
2026-06-09days on market $188,000 Active 34 DOM
-
2026-06-08days on market $188,000 Active 33 DOM
-
2026-06-07days on market $188,000 Active 32 DOM
-
2026-06-05days on market $188,000 Active 29 DOM
-
2026-06-03days on market $188,000 Active 28 DOM
-
2026-06-02days on market $188,000 Active 27 DOM
-
2026-06-01days on market $188,000 Active 26 DOM
-
2026-05-31days on market $188,000 Active 25 DOM
-
2026-05-18price $194,000 630-char remark
Show marketing remark (630 chars)
This practical 3 bed, 2 bath home offers 1,560 sq ft of well-designed living space that feels both open and functional. Natural light fills the home, highlighting the spacious layout and comfortable flow between living, dining, and kitchen areas, perfect for everyday living or hosting. Generous room sizes provide flexibility, while the outdoor space gives you room to relax or entertain. Conveniently located near schools, shopping, dining, and major highways for an easy commute. Tons of opportunity to add your own style over time. Perfect for a first-time buyer or an investor looking for a great addition to their portfolio.
-
2026-05-07$199,000 Active 630-char remark
Show marketing remark (630 chars)
This practical 3 bed, 2 bath home offers 1,560 sq ft of well-designed living space that feels both open and functional. Natural light fills the home, highlighting the spacious layout and comfortable flow between living, dining, and kitchen areas, perfect for everyday living or hosting. Generous room sizes provide flexibility, while the outdoor space gives you room to relax or entertain. Conveniently located near schools, shopping, dining, and major highways for an easy commute. Tons of opportunity to add your own style over time. Perfect for a first-time buyer or an investor looking for a great addition to their portfolio.
-
2026-04-13historical $199,000 630-char remark
Show marketing remark (630 chars)
This practical 3 bed, 2 bath home offers 1,560 sq ft of well-designed living space that feels both open and functional. Natural light fills the home, highlighting the spacious layout and comfortable flow between living, dining, and kitchen areas, perfect for everyday living or hosting. Generous room sizes provide flexibility, while the outdoor space gives you room to relax or entertain. Conveniently located near schools, shopping, dining, and major highways for an easy commute. Tons of opportunity to add your own style over time. Perfect for a first-time buyer or an investor looking for a great addition to their portfolio.
-
2022-07-07soldstatus
-
2020-11-18soldstatus
-
2020-11-17soldstatus Closed 168-char remark
Show marketing remark (168 chars)
Taxes, square footage, and lot size are pulled from County Records. Room sizes are approximate-not exact. Buyer(s) and buyer's agent to verify all information provided.
-
2020-10-17status Pending 168-char remark
Show marketing remark (168 chars)
Taxes, square footage, and lot size are pulled from County Records. Room sizes are approximate-not exact. Buyer(s) and buyer's agent to verify all information provided.
-
2020-10-09status Active 168-char remark
Show marketing remark (168 chars)
Taxes, square footage, and lot size are pulled from County Records. Room sizes are approximate-not exact. Buyer(s) and buyer's agent to verify all information provided.
-
2020-08-25status Pending 168-char remark
Show marketing remark (168 chars)
Taxes, square footage, and lot size are pulled from County Records. Room sizes are approximate-not exact. Buyer(s) and buyer's agent to verify all information provided.
-
2020-08-22$125,000 Active 168-char remark
Show marketing remark (168 chars)
Taxes, square footage, and lot size are pulled from County Records. Room sizes are approximate-not exact. Buyer(s) and buyer's agent to verify all information provided.
-
2019-05-17soldstatus
-
2019-05-06soldstatus
-
2019-05-03soldstatus Sold
-
2019-04-30status Pending
-
2019-04-04historical Contingent - Accepting Backup Offers
-
2019-03-13price $119,900
-
2019-02-07price $129,900
-
2018-10-03$139,900 Active
-
1994-04-08soldstatus
ⓘ Source: listings_history table (triggers on properties + properties_extension) + one-shot
backfill from property_details.listing_events for pre-trigger history.
Tax reassessment forecast MO · Resets to sale price
- Current annual tax
- $2,190 · $182/mo
- Projected year-2 tax
- $2,190 · $182/mo
- Expected delta
- $0/yr ($0/mo · 0.0%)
ⓘ Screening estimate from a state-policy table — verify with the county assessor before closing.
Climate risk First Street
- Flood 1/10 Low FEMA zone X (unshaded) · 0% chance over 30 yrs
- Wildfire 1/10 Low
- Heat 4/10 Moderate 7 d/yr ≥106°F today · 17 d/yr by 30 yrs out
- Wind 2/10 Low
- Air quality 3/10 Moderate 3 unhealthy d/yr today · 3 by 30 yrs out
Nearby sold comps map
Loading sold comps map…
Walkable amenities ~0.75 mi
Loading nearby amenities…
Taxation est. · year 1
- Rental income
- $17,066
- − Mortgage interest
- −$10,357
- − Property taxes
- −$2,190
- − Insurance
- −$924
- − Repairs & maintenance
- −$1,365
- − Management
- −$1,365
- − Depreciation
- −$5,379
- Taxable loss
- −$4,515
- Est. tax savings @ 24.0%
- +$1,084
- After-tax cash flow
- $-184/yr
For passive investors: Depreciation is non-cash, so a rental often shows a tax loss while cash-flowing — sheltering income. Rental losses are passive: they offset passive income freely, and up to $25,000/yr can offset ordinary (W-2) income if you actively participate and your MAGI is under $100k (phasing out to $0 by $150k); unused losses carry forward. On sale, claimed depreciation is recaptured at up to 25%, and gains may owe capital-gains tax (a 1031 exchange can defer both). Figures are a year-1 estimate at your 24.0% rate — not tax advice; consult a CPA.
Schools (NCES district)
- District
- Independence 30
- NCES district ID
- 2915480
- Math proficiency
- 26% ▼ -8.00%
- Reading proficiency
- 38% ▼ -5.00%
- Median HH income
- $41,843
- Composite
- 27.04/100
- National rank
- #7054
- State rank
- #252 of 324 in MO
Livability — Independence
- Score
- 82/100
- State rank
- #10
- US rank
- #1296
Category grades
Schools grade is shown separately in the Schools card above.
Census & demographics
- Census place
- Independence, MO
- County
- Jackson County · 687,798 people
- City population
- 117,675
- Metro
- Kansas City, MO-KS
- Population (ZIP)
- 22,138
- Household income
- $59,007
- Rent vs Own
- Severe rent burden
- 965.0
Population outlook (Jackson County) Hauer SSP2
- Today (2025)
- 719,589 people
- By 2030
- 731,456 · +1.6%
- By 2040
- 746,689 · +3.8%
- By 2050
- 749,289 · +4.1%
- By 2075
- 736,227 · +2.3%
- By 2100
- 668,210 · -7.1%
Race, ethnicity, and origin ACS 2023
- Neighborhood character
- Diverse neighborhood (Simpson 0.56)
- Race & ethnicity
- White 62% Hispanic / Latino 23% Two or more races 15% Black 7% Asian 2%
- Hispanic origin (detail)
- Mexican 15%
- Common ancestry
- Italian 12% Slovak 2% Lithuanian 2%
- Foreign-born
- 11% · Canada, China
- Languages at home
- 85% English-only · Spanish 13% Other Asian/Pacific 1%
Political lean MEDSL · Jackson
- 2024 margin
- D (+19.3) · D 58.9% · R 39.5% · Other 1.6%
- 2008→2024 swing
- -6.1pp toward R · 2008: 25.4pp · 2024: 19.3pp
- All cycles
- 2024: D+19.3 2020: D+22.0 2016: D+16.6 2012: D+19.0 2008: D+25.4
Not yet ingested
- Civics
- —
Market trends
- HPI YoY
- ▼ -160.06%
- Current HPI
- 302.1124
- Rent YoY
- ▲ 5.43%
- Metro
- Kansas City, MO-KS
- State GDP YoY
- ▲ 1.84%
- F500 in state
- 20
Industry mix (Fortune 500 HQ in MO)
| Industry | F500 HQs | Revenue |
|---|---|---|
| Healthcare | 1 | $163B |
|
||
| Insurance | 1 | $21B |
|
||
| Industrial Technology | 1 | $17B |
|
||
| Retail | 1 | $16B |
|
||
| Industrial Distribution | 1 | $10B |
|
||
| Utilities | 1 | $9B |
|
||
Price history
+38.7% since first listed19 events — show timeline
- 2026-05-18 Price Changed $194,000 Heartland MLS as Distributed by MLS Grid
- 2026-05-07 Listed $199,000 Heartland MLS as Distributed by MLS Grid
- 2026-04-13 Coming Soon $199,000 Heartland MLS as Distributed by MLS Grid
- 2022-07-07 Sold (Public Records) — Public Records
- 2020-11-18 Sold (Public Records) — Public Records
- 2020-11-17 Sold (MLS) — Heartland MLS as Distributed by MLS Grid
- 2020-10-17 Pending — Heartland MLS as Distributed by MLS Grid
- 2020-10-09 Relisted — Heartland MLS as Distributed by MLS Grid
- 2020-08-25 Pending — Heartland MLS as Distributed by MLS Grid
- 2020-08-22 Listed $125,000 Heartland MLS as Distributed by MLS Grid
- 2019-05-17 Sold (Public Records) — Public Records
- 2019-05-06 Sold (Public Records) — Public Records
- 2019-05-03 Sold (MLS) — Heartland MLS as Distributed by MLS Grid
- 2019-04-30 Pending — Heartland MLS as Distributed by MLS Grid
- 2019-04-04 Contingent — Heartland MLS as Distributed by MLS Grid
- 2019-03-13 Price Changed $119,900 Heartland MLS as Distributed by MLS Grid
- 2019-02-07 Price Changed $129,900 Heartland MLS as Distributed by MLS Grid
- 2018-10-03 Listed $139,900 Heartland MLS as Distributed by MLS Grid
- 1994-04-08 Sold (Public Records) — Public Records
Property tax history
+3.7%/yrLatest (2025): $2,190 · +18.6% YoY. Source: county tax records.
Cash-flow waterfall
monthlySold comps — $/sqft
last 12 mo · ≤1 miLoading sold comps…