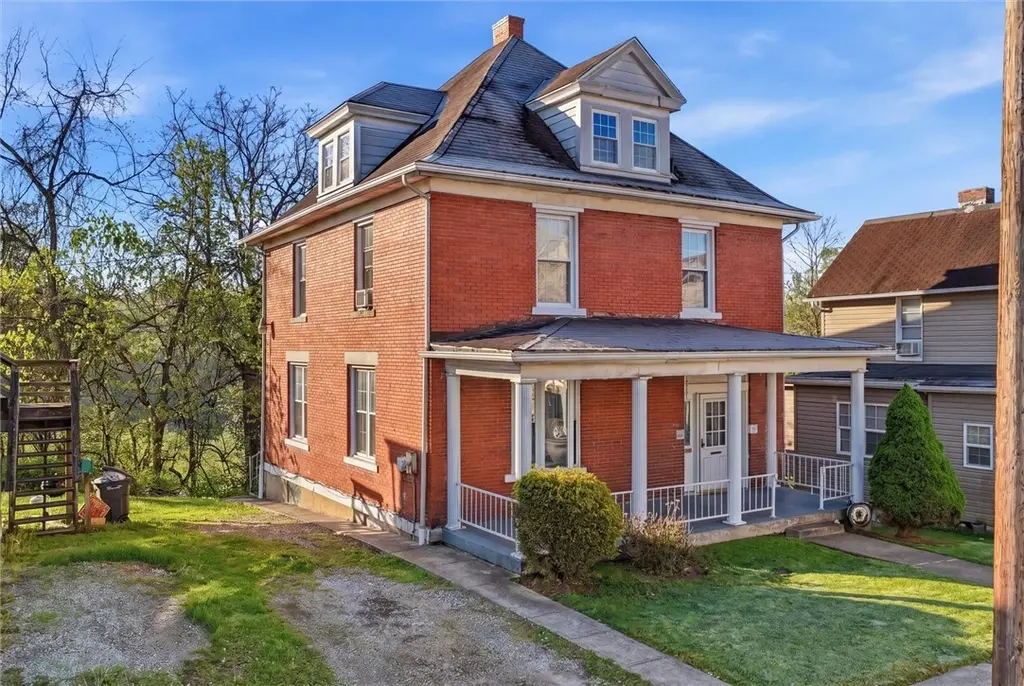
425 Parkinson St · Monongahela, PA
Flood risk 1/10 · Minimal
- FEMA flood zone
- X (unshaded)
- Chance of flooding over 30 yrs
- 0.0%
- Est. flood insurance / yr
- $473 – $860
Fire risk 1/10 · Minimal
- Est. fire insurance / yr
- $511 – $949
Heat risk 4/10 · Minor
- Hot days now (above 98°F)
- 7 days/yr
- Hot days in 30 yrs
- 19 days/yr
Wind risk 2/10 · Minimal
- Chance of severe wind over 30 yrs
- —
Air-quality risk 2/10 · Minimal
- Unhealthy air days now
- 1 days/yr
- Unhealthy air days in 30 yrs
- 2 days/yr
Risk factors via First Street. Map © Google.
Why this score? — see what drove the C grade
The composite is a weighted blend of 9 inputs, each scored 0–100. Each bar is that input's sub-score; the figure is the points it added to the 100-point composite (weight × sub-score).
- Cash flow +19.8/30.0
- ARV discount +15.0/15.0
- DSCR +6.3/10.0
- 1% rule +5.5/10.0
- Livability +3.6/5.0
- Rent growth +2.5/5.0
- Condition / age +2.5/5.0
- Schools +2.4/10.0
- Appreciation +0.0/10.0
$125,000
🖨 Deal sheet (PDF) 📄 Offer letter ✓ Due diligence
Listing remarks
Big. Brick. And Beautiful!! Welcome home to 425 Parkinson Street in Monongahela where small town America is alive and thriving!! You can walk to locally owned shops and restaurants, multiple parks, and the Mon Aquatorium for river fun!! By car you're a short drive to Rt 43 to get you anywhere quickly!! Now that we've established the location is good, let's jump into the house. .. As you arrive you'll love the front porch where you'll relax with a cold beverage or morning coffee. Step inside to find a huge living room with decorative fireplace & crown molding. The Living room is open to both the kitchen and dining room. The large dining room will be a great place for everyday meals and
Key facts
- Massive bonus room
- Custom full bath
- Decorative fireplace
Tags
Property features AI
Finance
- HOA & community: Public transportation nearby
Exterior
- Parking: On-street parking
- Utilities: Public water; Public sewer
- Home design: 2-story brick residence; Resale property
- Construction: Brick construction; Asphalt roof
- Exterior features: 34x135x33x136 lot dimensions
Interior
- Kitchen: Some gas appliances; Stove; Microwave; Dishwasher
- Bedrooms: Upper-level bedrooms (two bedrooms listed + one additional upper room 14x14)
- Flooring: Ceramic tile; Laminate; Carpet
- Bathrooms: 2 full bathrooms
- Heating & cooling: Gas heating (hot water); Wall/window cooling units
- Interior features: Multi-pane windows; Partially finished walk-out basement; Fireplace (1)
Neighborhood map
What this means for you Summary
Snapshot
- This is a 3-bed/1.0-bath single-family listed at $125k.
Deal economics
- At list price, monthly cash flow is $150 ($2k/yr) — positive.
- The deal already cash-flows at list — no discount required.
- Meets the 1% rule at list price ($1k rent vs $125k).
Location & tenants
- Location reads 72/100 on livability (#629 in PA) — a middle-class / working-renter tenant base. Strengths: cost of living A+, housing A+, crime B+; Watch: employment C-, health & safety D+, amenities F.
- Ringgold SD (suburban): math 19% / reading 36% proficiency, ranked #452 of 539 in PA (top 84%) — low school quality limits family demand, transient renter base, plan for 1-2y turnover.
- Zoned schools: Ringgold El Sch South (math 22% / reading 47%, grade F, #1,049 of 1,518 statewide, top 71%, 580 students, 100% FRL); Ringgold Ms (math 9% / reading 29%, grade F, #447 of 512 statewide, top 88%, 787 students, 100% FRL); Ringgold Shs (math 57% / reading 24%, grade F, #255 of 437 statewide, top 60%, 852 students, 82% FRL) — zoned schools average 94% FRL vs 41% district-wide (53 pts higher); higher-poverty schools than district average — tighter screening recommended.
- Market conditions: 67 active listings in the ZIP; 489 units permitted in Washington County in 2024 (30 in 5+ unit buildings).
Forward outlook
- Local home prices are declining (-3.0%/yr); year-one equity from $864 of loan paydown is wiped out by about $4k of value loss. Plan a longer hold.
- Washington County population projected to shrink 6% by 2050 — rents likely to lag national; underwrite the cash flow, not the appreciation.
Negotiation context
- Only 7 days on market — expect competitive offers; lowballing is unlikely to land.
Risks & watch-outs
- Watch-outs: built in 1940 — expect roof / HVAC / electrical / plumbing capex.
Questions for the listing agent
- Built in 1940 — when were the roof, HVAC, electrical panel, plumbing, and water heater last replaced?
- Is there a deadline driving the sale (1031 exchange, divorce, estate, relocation)? That informs how much negotiation room exists.
- Schools are B-rated — typically a magnet for longer-tenancy family renters. What's the average tenant stay here, and is there a school-zone premium baked into asking?
- What's the average days-on-market for RENTAL listings here right now (not sales)? A rising rental-DOM trend means longer vacancies and softer asking-rent achievability than the comps imply.
- What's the recent tenant-quality profile in this submarket — average credit score on applications, eviction rate, late-payment / NSF rate, and stable-employment percentage? A property-management company in the area should have these aggregated.
- How much new for-sale + rental construction is in the pipeline within 1–3 miles? Heavy new supply typically softens prices + rents 12–24 months out; constrained supply supports both.
Investment metrics
- 1% rule
- 1.05% ✓
- Cap rate
- 7.73%
- Cash-on-cash
- 5.14%
- DSCR
- 1.23
- GRM
- 7.9
CMA / ARV
- ARV (on-the-fly)
- $178,450
- Comps found
- 11
Show comp detail 11 sales within ~0.75 mi
| Address | Dist | Beds/Ba | Sqft | Sold | Price | $/sf | Match |
|---|---|---|---|---|---|---|---|
| 136 1/2 Chess St | 0.13mi | 4/2.0 (+1) | 2,076 (-3%) | 0mo | $150,000 | $72 | 79 |
| 624 4th St | 0.39mi | 3/1.0 | 2,084 (-3%) | 4mo | $190,000 | $91 | 73 |
| 504 Marne Ave | 0.33mi | 3/1.5 | 2,324 (+8%) | 1mo | $55,600 | $24 | 68 |
| 500 Chess St | 0.35mi | 3/1.0 | 1,900 (-12%) | 4mo | $61,750 | $33 | 61 |
| 614 Lincoln St | 0.38mi | 3/2.0 | 1,934 (-10%) | 2mo | $160,000 | $83 | 60 |
| 309 Francis Ave | 0.74mi | 3/1.0 | 2,121 (-1%) | 7mo | $44,260 | $21 | 57 |
| 224 Gregg St | 0.32mi | 4/2.0 (+1) | 1,926 (-10%) | 3mo | $228,900 | $119 | 56 |
| 525 W Main St | 0.44mi | 3/1.5 | 1,960 (-9%) | 11mo | $190,000 | $97 | 53 |
| 221 4th Ave | 0.55mi | 3/2.0 | 1,920 (-11%) | 12mo | $229,000 | $119 | 43 |
| 802 Howard St | 0.48mi | 4/2.0 (+1) | 1,842 (-14%) | 6mo | $42,500 | $23 | 40 |
| 606 4th St | 0.35mi | 4/3.0 (+1) | 1,960 (-9%) | 20mo | $170,000 | $87 | 39 |
Match score weights: distance 35% · size 25% · config 20% · recency 20%. Top-matched comps best support the ARV.
Projected returns pro-forma
-3.0% appreciation · 3.0% rent growth · sell at horizon
- IRR
- -8.3%
- Equity multiple
- 0.69×
- Total profit
- $-10,681
- Equity at exit
- $18,638
- IRR
- 1.3%
- Equity multiple
- 1.09×
- Total profit
- $3,124
- Equity at exit
- $10,808
Cash invested: $35,000 (down + closing). Projections, not guarantees.
Landlord ↔ Tenant lean methodology
- Overall (STATE)
- 62 Landlord-Friendly
- State Pennsylvania
- 62 Landlord-Friendly · EVEN
- County
- — inherits STATE
- City
- — inherits STATE
ZIP-level market 15063
- Home prices YoY
- -6.9%
- Active inventory
- 67
- Price-to-rent
- 7.9×
Monthly cashflow live
- Estimated rent
- $1,314 medium interval (Pro) →
- Mortgage (P&I)
- −$656
- Tax from tax record
- −$181 /mo · $2,172/yr
- Insurance
- −$52
- HOA
- −$0
- Vacancy / Maint / Mgmt
- −$276
- Net cashflow
- $150
Break-even live
Sensitivity live
| Price | -10% $221 | -5% $185 | +0% $150 | +5% $114 | +10% $79 |
|---|---|---|---|---|---|
| Rent | -10% $46 | -5% $98 | +0% $150 | +5% $202 | +10% $254 |
| Rate | -1.0pp $213 | -0.5pp $182 | base $150 | +0.5pp $117 | +1.0pp $84 |
UW: 25.0% down · 7.5% · 30yr · 1.5% tax · 5.0% vac · 8.0% maint · 8.0% mgmt
Financing live
Cash to close
- Down payment
- $31,250
- Closing costs
- $3,750
- Reserves months
- —
- Total cash needed
- —
Loan-product check · same deal, 3 products live
Conventional
25% down · 7.5% · 30yr
- Down + closing
- —
- Monthly P&I
- —
- Monthly cashflow
- —
- DSCR
- —
- Eligible?
- —
Personal DTI + credit; lowest rate.
DSCR
20% down · 8.5% · 30yr
- Down + closing
- —
- Monthly P&I
- —
- Monthly cashflow
- —
- DSCR
- —
- Eligible?
- —
No personal income docs; deal must DSCR.
Hard money
10% down · 12.0% · 12mo
- Down + closing
- —
- Monthly P&I
- —
- Monthly cashflow
- —
- DSCR
- —
- Eligible?
- —
Short-term bridge; refi at stabilization.
Listing history 2 events
-
2026-04-29status Pending
-
2026-04-22$125,000 Active
ⓘ Source: listings_history table (triggers on properties + properties_extension) + one-shot
backfill from property_details.listing_events for pre-trigger history.
Tax reassessment forecast PA · Partial reset (capped growth)
- Current annual tax
- $2,172 · $181/mo
- Projected year-2 tax
- $2,172 · $181/mo
- Expected delta
- $0/yr ($0/mo · 0.0%)
ⓘ Screening estimate from a state-policy table — verify with the county assessor before closing.
Climate risk First Street
- Flood 1/10 Low FEMA zone X (unshaded) · 0% chance over 30 yrs
- Wildfire 1/10 Low
- Heat 4/10 Moderate 7 d/yr ≥98°F today · 19 d/yr by 30 yrs out
- Wind 2/10 Low
- Air quality 2/10 Low 1 unhealthy d/yr today · 2 by 30 yrs out
Nearby sold comps map
Loading sold comps map…
Walkable amenities ~0.75 mi
Loading nearby amenities…
Taxation est. · year 1
- Rental income
- $15,773
- − Mortgage interest
- −$7,002
- − Property taxes
- −$2,172
- − Insurance
- −$625
- − Repairs & maintenance
- −$1,262
- − Management
- −$1,262
- − Depreciation
- −$3,636
- Taxable loss
- −$186
- Est. tax savings @ 24.0%
- +$45
- After-tax cash flow
- $1,842/yr
For passive investors: Depreciation is non-cash, so a rental often shows a tax loss while cash-flowing — sheltering income. Rental losses are passive: they offset passive income freely, and up to $25,000/yr can offset ordinary (W-2) income if you actively participate and your MAGI is under $100k (phasing out to $0 by $150k); unused losses carry forward. On sale, claimed depreciation is recaptured at up to 25%, and gains may owe capital-gains tax (a 1031 exchange can defer both). Figures are a year-1 estimate at your 24.0% rate — not tax advice; consult a CPA.
Schools (NCES district)
- District
- Ringgold SD
- NCES district ID
- 4220400
- Math proficiency
- 19% ▼ -20.00%
- Reading proficiency
- 36% ▼ -18.00%
- Median HH income
- $46,754
- Composite
- 23.75/100
- National rank
- #7819
- State rank
- #452 of 539 in PA
Livability — Monongahela
- Score
- 72/100
- State rank
- #629
- US rank
- #6064
Category grades
Schools grade is shown separately in the Schools card above.
Census & demographics
- Census place
- Monongahela, PA
- City population
- 10,479
- Population (ZIP)
- 10,479
Population outlook (Washington County) Hauer SSP2
- Today (2025)
- 208,060 people
- By 2030
- 207,168 · -0.4%
- By 2040
- 202,738 · -2.6%
- By 2050
- 195,269 · -6.1%
- By 2075
- 175,588 · -15.6%
- By 2100
- 145,827 · -29.9%
Race, ethnicity, and origin ACS 2023
- Neighborhood character
- Predominantly White (94%)
- Race & ethnicity
- White 94% Two or more races 4% Hispanic / Latino 3%
- Common ancestry
- Romanian 9% Slovak 4% Scotch-Irish 3%
- Foreign-born
- 2% · Vietnam, Canada
- Languages at home
- 97% English-only · Spanish 2% German/W. Germanic 1%
Political lean MEDSL · Washington
- 2024 margin
- Strong R (+25.5) · D 36.9% · R 62.4%
- 2008→2024 swing
- -20.8pp toward R · 2008: -4.7pp · 2024: -25.5pp
- All cycles
- 2024: R+25.5 2020: R+22.8 2016: R+25.3 2012: R+13.3 2008: R+4.7
Not yet ingested
- Civics
- —
Market trends
- HPI YoY
- ▼ -19.31%
- Current HPI
- 261.0334
- Rent YoY
- —
- Metro
- —
- State GDP YoY
- ▲ 1.68%
- F500 in state
- 34
Industry mix (Fortune 500 HQ in PA)
| Industry | F500 HQs | Revenue |
|---|---|---|
| Healthcare | 2 | $309B |
|
||
| Insurance | 2 | $27B |
|
||
| Telecommunications / Media | 1 | $124B |
|
||
| Industrial Distribution | 1 | $22B |
|
||
| Financial Services | 1 | $20B |
|
||
| Chemicals / Materials | 1 | $18B |
|
||
Price history
2 events — show timeline
- 2026-04-29 Pending — West Penn MLS
- 2026-04-22 Listed $125,000 West Penn MLS
Property tax history
+5.7%/yrLatest (2026): $2,172 · +7.7% YoY. Source: county tax records.
Cash-flow waterfall
monthlySold comps — $/sqft
last 12 mo · ≤1 miLoading sold comps…