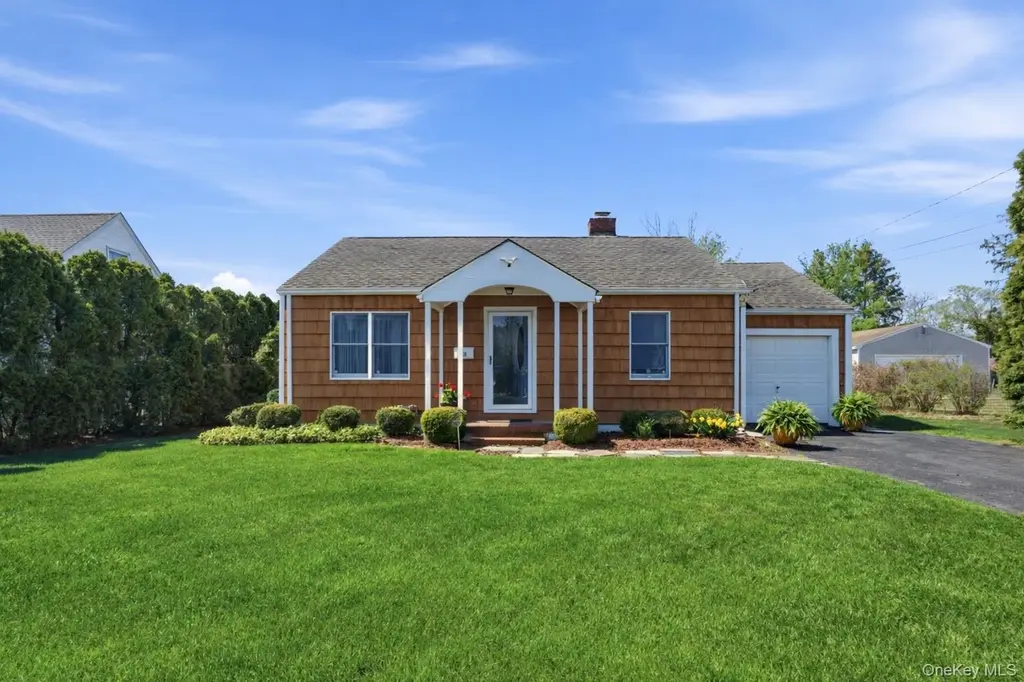
359 Fishel Ave · Riverhead, NY
Flood risk 4/10 · Minor
- FEMA flood zone
- X (unshaded)
- Chance of flooding over 30 yrs
- 0.21%
- Est. flood insurance / yr
- $473 – $860
Fire risk 2/10 · Minimal
- Est. fire insurance / yr
- $691 – $1,283
Heat risk 5/10 · Moderate
- Hot days now (above 92°F)
- 7 days/yr
- Hot days in 30 yrs
- 19 days/yr
Wind risk 8/10 · Major
- Chance of severe wind over 30 yrs
- 80.0%
Air-quality risk 3/10 · Minor
- Unhealthy air days now
- 2 days/yr
- Unhealthy air days in 30 yrs
- 3 days/yr
Risk factors via First Street. Map © Google.
Why this score? — see what drove the B grade
The composite is a weighted blend of 9 inputs, each scored 0–100. Each bar is that input's sub-score; the figure is the points it added to the 100-point composite (weight × sub-score).
- Cash flow +30.0/30.0
- 1% rule +10.0/10.0
- DSCR +10.0/10.0
- ARV discount +8.8/15.0
- Livability +3.7/5.0
- Schools +3.6/10.0
- Rent growth +2.5/5.0
- Condition / age +2.5/5.0
- Appreciation +0.0/10.0
$559,000
🖨 Deal sheet 📄 Offer letter ✓ Due diligence
Listing remarks MLS
Newly renovated ranch home in mint condition on prime residential street. This stylish immaculate 1,550 sq ft home has 2 bedrooms, 1 bath, eat in kitchen, enclosed four season porch, full basement and garage. All new renovations include wood floors throughout, windows, insulation and sheetrock, stainless steel kitchen appliances, new tiled bathroom, central air-conditioning, high-hat lighting throughout, and freshly painted interior and exterior. Professionally landscaped exterior with in-ground sprinkler system. Security system complete with cameras. Conveniently located to schools and Main Street. Local attractions such as the Riverhead Aquarium, North Fork beaches and wineries are nearby.
Key facts
- High-hat lighting
- New tiled bathroom
- Full basement
Tags
Neighborhood map
What this means for you Summary
Snapshot
- This is a 2-bed/1.0-bath single-family listed at $559k.
Deal economics
- At list price, monthly cash flow is $4k ($54k/yr) — positive.
- The deal already cash-flows at list — no discount required.
- Meets the 1% rule at list price ($10k rent vs $559k).
- Recommended offer: $542k (3.0% below list) — sets the bar for market timing.
- Cap rate 15.9% vs local median 4.6% in Riverhead — top-decile yield for the area; either an underpriced asset or a hidden risk that comps aren't pricing in. Stress-test before assuming the spread holds.
Location & tenants
- Location reads 73/100 on livability (#325 in NY) — a middle-class / working-renter tenant base. Strengths: health & safety A+, housing B+; Watch: schools D, cost of living F.
- Riverhead Central School District (suburban): math 34% / reading 48% proficiency, ranked #489 of 590 in NY (top 83%) — families likely to look elsewhere, expect single-tenant / working-renter base with shorter leases.
- Market conditions: 188 active listings in the ZIP; 2 comparable units currently listed for rent nearby; 1,366 units permitted in Suffolk County in 2024 (216 in 5+ unit buildings).
Forward outlook
- Local home prices are declining (-3.0%/yr); year-one equity from $4k of loan paydown is wiped out by about $17k of value loss. Plan a longer hold.
- Suffolk County population projected to shrink 5% by 2050 — rents likely to lag national; underwrite the cash flow, not the appreciation.
- At projected returns (-3.0% appreciation + 3.0% rent growth), your $157k cash investment doubles in ~4 years — after that, you're playing with house money.
Negotiation context
- It's been on market 42 days — a 3% lower offer ($542k) is reasonable based on typical stale-listing flexibility.
Risks & watch-outs
- Watch-outs: built in 1952 — expect roof / HVAC / electrical / plumbing capex.
- Climate carrying-cost: severe wind risk, 80% chance of damaging wind over 30y; extreme-heat days projected 7→19/yr by 2055 (HVAC capex compounding) — expect insurance premiums to compound above CPI over the hold.
Questions for the listing agent
- It's been on market 42 days. Have you received any prior offers? Is the seller open to a 3% concession, seller financing, or rate buy-down credit?
- Built in 1952 — when were the roof, HVAC, electrical panel, plumbing, and water heater last replaced?
- Is there a deadline driving the sale (1031 exchange, divorce, estate, relocation)? That informs how much negotiation room exists.
- Schools are D-rated, which usually means shorter tenancies and higher turnover. Who's the typical renter profile here, and what's been the actual vacancy rate?
- What's the average days-on-market for RENTAL listings here right now (not sales)? A rising rental-DOM trend means longer vacancies and softer asking-rent achievability than the comps imply.
- What's the recent tenant-quality profile in this submarket — average credit score on applications, eviction rate, late-payment / NSF rate, and stable-employment percentage? A property-management company in the area should have these aggregated.
- How much new for-sale + rental construction is in the pipeline within 1–3 miles? Heavy new supply typically softens prices + rents 12–24 months out; constrained supply supports both.
Investment metrics
- 1% rule
- 1.87% ✓
- Cap rate
- 15.91%
- Cash-on-cash
- 34.33%
- DSCR
- 2.53
- GRM
- 4.5
CMA / ARV
- ARV (median comp)
- $575,476
- List price
- $559,000
- Delta
- -2.86%
- Verdict
- FAIR
- Comps
- 20 within 1.0 mi
Show comp detail 7 sales within ~0.75 mi
| Address | Dist | Beds/Ba | Sqft | Sold | Price | $/sf | Match |
|---|---|---|---|---|---|---|---|
| 832 Ostrander Ave | 0.21mi | 3/2.0 (+1) | 1,573 (+1%) | 9mo | $635,000 | $404 | 71 |
| 18 Tyte Dr | 0.56mi | 3/1.5 (+1) | 1,600 (+3%) | 2mo | $590,000 | $369 | 60 |
| 236 Fishel Ave | 0.23mi | 3/1.5 (+1) | 1,400 (-10%) | 10mo | $540,000 | $386 | 58 |
| 204 Union Ave | 0.34mi | 3/1.5 (+1) | 1,740 (+12%) | 2mo | $530,000 | $305 | 55 |
| 294 Elton St | 0.18mi | 3/2.0 (+1) | 1,342 (-14%) | 14mo | $499,000 | $372 | 48 |
| 133 Merritts Pond Rd | 0.74mi | 3/1.0 (+1) | 1,516 (-2%) | 13mo | $553,000 | $365 | 46 |
| 30 Millbrook Ln | 0.45mi | 3/2.0 (+1) | 1,326 (-15%) | 9mo | $575,000 | $434 | 38 |
Match score weights: distance 35% · size 25% · config 20% · recency 20%. Top-matched comps best support the ARV.
Projected returns pro-forma
-3.0% appreciation · 3.0% rent growth · sell at horizon
- IRR
- 29.8%
- Equity multiple
- 2.24×
- Total profit
- $194,740
- Equity at exit
- $83,349
- IRR
- 37.1%
- Equity multiple
- 4.43×
- Total profit
- $537,255
- Equity at exit
- $48,332
Cash invested: $156,520 (down + closing). Projections, not guarantees.
Landlord ↔ Tenant lean methodology
- Overall (STATE)
- 15 Strongly Tenant-Friendly
- State New York
- 15 Strongly Tenant-Friendly · D+10
- County
- — inherits STATE
- City
- — inherits STATE
ZIP-level market 11901
- Home prices YoY
- -29.5%
- Active inventory
- 188
- Price-to-rent
- 4.5×
Monthly cashflow live
- Estimated rent
- $10,443 medium interval (Pro) →
- Mortgage (P&I)
- −$2,931
- Tax from tax record
- −$607 /mo · $7,287/yr
- Insurance
- −$233
- HOA
- −$0
- Vacancy / Maint / Mgmt
- −$2,193
- Net cashflow
- $4,478
Break-even live
UW: 25.0% down · 7.5% · 30yr · 1.5% tax · 5.0% vac · 8.0% maint · 8.0% mgmt
Financing live
Cash to close
- Down payment
- $139,750
- Closing costs
- $16,770
- Reserves months
- —
- Total cash needed
- —
Loan-product check · same deal, 3 products live
Conventional
25% down · 7.5% · 30yr
- Down + closing
- —
- Monthly P&I
- —
- Monthly cashflow
- —
- DSCR
- —
- Eligible?
- —
Personal DTI + credit; lowest rate.
DSCR
20% down · 8.5% · 30yr
- Down + closing
- —
- Monthly P&I
- —
- Monthly cashflow
- —
- DSCR
- —
- Eligible?
- —
No personal income docs; deal must DSCR.
Hard money
10% down · 12.0% · 12mo
- Down + closing
- —
- Monthly P&I
- —
- Monthly cashflow
- —
- DSCR
- —
- Eligible?
- —
Short-term bridge; refi at stabilization.
Rent comps 2 comps
| Address | Beds | Baths | Sqft | Rent | $/sqft | DOM | Units | Dist |
|---|---|---|---|---|---|---|---|---|
| 525 Riverleigh Ave Unit C8 Riverhead, NY | 1.0 | 1.0 | 1200 | $2,100 | $1.75 | 24d | 1 | 1.20mi |
| 97 Grant DR Aquebogue, NY | 3.0 | 2.5 | 1900 | $20,000 | $10.53 | 43d | 1 | 1.46mi |
Listing history 1 events
-
2026-04-15$559,000 Active 703-char remark
Show marketing remark (703 chars)
Newly renovated ranch home in mint condition on prime residential street. This stylish immaculate 1,550 sq ft home has 2 bedrooms, 1 bath, eat in kitchen, enclosed four season porch, full basement and garage. All new renovations include wood floors throughout, windows, insulation and sheetrock, stainless steel kitchen appliances, new tiled bathroom, central air-conditioning, high-hat lighting throughout, and freshly painted interior and exterior. Professionally landscaped exterior with in-ground sprinkler system. Security system complete with cameras. Conveniently located to schools and Main Street. Local attractions such as the Riverhead Aquarium, North Fork beaches and wineries are nearby.
ⓘ Source: listings_history table (triggers on properties + properties_extension) + one-shot
backfill from property_details.listing_events for pre-trigger history.
Tax reassessment forecast NY · Partial reset (capped growth)
- Current annual tax
- $7,287 · $607/mo
- Projected year-2 tax
- $8,367 · $697/mo
- Expected delta
- +$1,080/yr (+$90/mo · 14.8%)
ⓘ Screening estimate from a state-policy table — verify with the county assessor before closing.
Climate risk First Street
- Flood 4/10 Moderate FEMA zone X (unshaded) · 21% chance over 30 yrs
- Wildfire 2/10 Low
- Heat 5/10 Major 7 d/yr ≥92°F today · 19 d/yr by 30 yrs out
- Wind 8/10 Severe 80% chance of damaging wind over 30 yrs
- Air quality 3/10 Moderate 2 unhealthy d/yr today · 3 by 30 yrs out
Nearby sold comps map
Loading sold comps map…
Walkable amenities ~0.75 mi
Loading nearby amenities…
Taxation est. · year 1
- Rental income
- $125,314
- − Mortgage interest
- −$31,313
- − Property taxes
- −$7,287
- − Insurance
- −$2,795
- − Repairs & maintenance
- −$10,025
- − Management
- −$10,025
- − Depreciation
- −$16,262
- Taxable income
- $47,607
- Est. tax owed @ 24.0%
- −$11,426
- After-tax cash flow
- $42,313/yr
For passive investors: Depreciation is non-cash, so a rental often shows a tax loss while cash-flowing — sheltering income. Rental losses are passive: they offset passive income freely, and up to $25,000/yr can offset ordinary (W-2) income if you actively participate and your MAGI is under $100k (phasing out to $0 by $150k); unused losses carry forward. On sale, claimed depreciation is recaptured at up to 25%, and gains may owe capital-gains tax (a 1031 exchange can defer both). Figures are a year-1 estimate at your 24.0% rate — not tax advice; consult a CPA.
Schools (NCES district)
- District
- Riverhead Central School District
- NCES district ID
- 3624690
- Math proficiency
- 34% ▼ -4.00%
- Reading proficiency
- 48% ▲ 13.00%
- Median HH income
- $61,607
- Composite
- 36.38/100
- National rank
- #4683
- State rank
- #489 of 590 in NY
Livability — Riverhead
- Score
- 73/100
- State rank
- #325
- US rank
- #5379
Category grades
Schools grade is shown separately in the Schools card above.
Census & demographics
- Census place
- Riverhead, NY
- City population
- 32,921
- Population (ZIP)
- 32,921
Population outlook (Suffolk County) Hauer SSP2
- Today (2025)
- 1,505,262 people
- By 2030
- 1,498,318 · -0.5%
- By 2040
- 1,471,101 · -2.3%
- By 2050
- 1,424,848 · -5.3%
- By 2075
- 1,337,157 · -11.2%
- By 2100
- 1,217,720 · -19.1%
Race, ethnicity, and origin ACS 2023
- Neighborhood character
- Diverse neighborhood (Simpson 0.63)
- Race & ethnicity
- White 52% Hispanic / Latino 29% Two or more races 14% Black 11% Asian 3%
- Hispanic origin (detail)
- Mexican 4%
- Common ancestry
- Romanian 8% Iranian 1% Portuguese 1%
- Foreign-born
- 25% · Canada, Jamaica
- Languages at home
- 68% English-only · Spanish 26% Other Indo-European 3% Russian/Polish/Slavic 2%
Political lean MEDSL · Suffolk
- 2024 margin
- Lean R (+10.0) · D 45.0% · R 55.0%
- 2008→2024 swing
- -16.0pp toward R · 2008: 6.0pp · 2024: -10.0pp
- All cycles
- 2024: R+10.0 2020: R+0.0 2016: R+8.2 2012: D+2.9 2008: D+6.0
Not yet ingested
- Civics
- —
Market trends
- HPI YoY
- ▼ -182.60%
- Current HPI
- 436.7781
- Rent YoY
- —
- Metro
- —
- State GDP YoY
- ▲ 2.60%
- F500 in state
- 92
Industry mix (Fortune 500 HQ in NY)
| Industry | F500 HQs | Revenue |
|---|---|---|
| Financial Services | 10 | $950B |
|
||
| Consumer Goods | 9 | $162B |
|
||
| Insurance | 4 | $225B |
|
||
| Telecommunications | 2 | $144B |
|
||
| Pharmaceuticals | 2 | $112B |
|
||
| Media / Entertainment | 2 | $69B |
|
||
Price history
1 event — show timeline
- 2026-04-15 Listed $559,000 OneKey® MLS as Distributed by MLS Grid
Property tax history
+1.6%/yrLatest (2025): $7,287 · +0.0% YoY. Source: county tax records.
Cash-flow waterfall
monthlySold comps — $/sqft
last 12 mo · ≤1 miLoading sold comps…