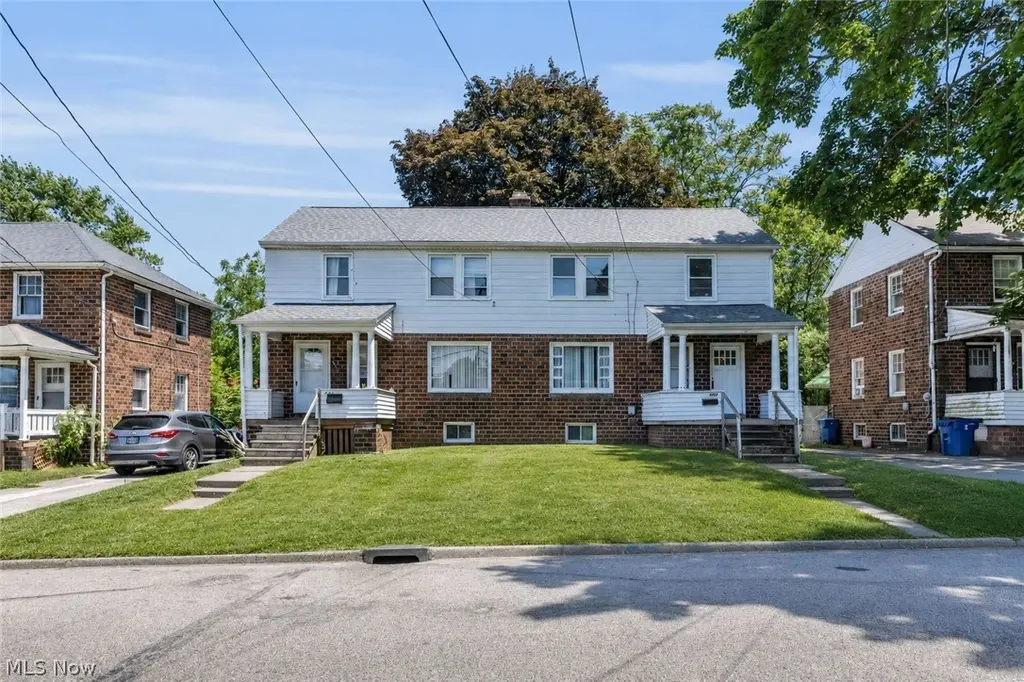
422 5th St · Struthers, OH
Flood risk 1/10 · Minimal
- FEMA flood zone
- X (unshaded)
- Chance of flooding over 30 yrs
- 0.0%
- Est. flood insurance / yr
- $473 – $860
Fire risk 1/10 · Minimal
- Est. fire insurance / yr
- $713 – $1,323
Heat risk 3/10 · Minor
- Hot days now (above 97°F)
- 7 days/yr
- Hot days in 30 yrs
- 17 days/yr
Wind risk 1/10 · Minimal
- Chance of severe wind over 30 yrs
- —
Air-quality risk 3/10 · Minor
- Unhealthy air days now
- 1 days/yr
- Unhealthy air days in 30 yrs
- 4 days/yr
Risk factors via First Street. Map © Google.
Why this score? — see what drove the F grade
The composite is a weighted blend of 9 inputs, each scored 0–100. Each bar is that input's sub-score; the figure is the points it added to the 100-point composite (weight × sub-score).
- Cash flow +10.4/30.0
- Schools +4.0/10.0
- Livability +3.6/5.0
- DSCR +3.0/10.0
- Appreciation +2.9/10.0
- Rent growth +2.5/5.0
- Condition / age +2.5/5.0
- 1% rule +1.8/10.0
- ARV discount +0.0/15.0
$165,000
🖨 Deal sheet 📄 Offer letter ✓ Due diligence
Listing remarks
Welcome to this well maintained duplex in the heart of Struthers offering an excellent opportunity for investors, owner occupants, or those looking for flexible living arrangements with income potential. Featuring a total of 4 bedrooms and 3 full bathrooms, this property provides comfortable living space, functional layouts, and long term value. Each unit offers spacious rooms, inviting living areas, and practical floor plans designed to accommodate everyday living. Whether you are looking to expand your investment portfolio, live in one unit while generating rental income from the other, or create space for extended family, this property offers versatility to fit a variety of needs. A majo
Key facts
- Income potential
- Spacious rooms
- 5,140 sq ft lot
Tags
Property features AI
Finance
- Financial info: Annual tax noted (source data)
Exterior
- Parking: Driveway parking
- Utilities: Public water; Public sewer
- Home design: Two-story residence; Brick and vinyl siding exterior; Asphalt/fiberglass roof; Above-grade finished area approximately 2,016
- Construction: Built per public records; Brick and vinyl siding construction; Asphalt/fiberglass roof; Full unfinished basement
- Exterior features: Paved driveway
Interior
- Bedrooms: Total rooms: 10
- Bathrooms: 3 full bathrooms
- Heating & cooling: Forced air heating; Wall/window cooling units
- Interior features: Full unfinished basement
- Laundry & utility: Laundry located in basement
Neighborhood map
What this means for you Summary
Snapshot
- This is a 2-bed/1.0-bath single-family listed at $165k.
Deal economics
- At list price, monthly cash flow is $-88 ($-1k/yr) — negative.
- To cash-flow at today's rent, offer at most $149k (9.5% below list).
- To meet the 1% rule (rent ≥ 1% of price), the offer needs to be $112k (32.0% below list).
- Recommended offer: $112k (32.0% below list) — sets the bar for 1% rule.
Location & tenants
- Location reads 71/100 on livability (#418 in OH) — a middle-class / working-renter tenant base. Strengths: cost of living A+, housing A+, crime B; Watch: commute C-, amenities F, employment F.
- Struthers City (suburban): math 45% / reading 52% proficiency, ranked #475 of 656 in OH (top 72%) — families likely to look elsewhere, expect single-tenant / working-renter base with shorter leases.
- Market conditions: 66 active listings in the ZIP; 6 comparable units currently listed for rent nearby; rentals lingering (median 44d on market — plan ~5-8 weeks vacancy on turnover, expect pricing pressure); 50% of comp listings sitting > 30 days — soft ceiling on asking rent; 147 units permitted in Mahoning County in 2024 (0 in 5+ unit buildings).
Forward outlook
- Local home prices are declining (-3.0%/yr); year-one equity from $1k of loan paydown is wiped out by about $5k of value loss. Plan a longer hold.
- Mahoning County population projected at -14% by 2050 — secular population decline; favor cash flow + early exit over multi-decade hold.
Negotiation context
- Only 8 days on market — expect competitive offers; lowballing is unlikely to land.
- 3 sale attempts since 10y ago with the ask held roughly flat each time — persistent listings suggest the price (not the market) is what's stuck; bring a comps-based counter.
Risks & watch-outs
- Watch-outs: built in 1918 — expect roof / HVAC / electrical / plumbing capex.
Questions for the listing agent
- What do current leases actually rent for vs. the listed asking? Can we see a recent rent roll and the last 12 months of T-12 income?
- Built in 1918 — when were the roof, HVAC, electrical panel, plumbing, and water heater last replaced?
- Is there a deadline driving the sale (1031 exchange, divorce, estate, relocation)? That informs how much negotiation room exists.
- Schools are B-rated — typically a magnet for longer-tenancy family renters. What's the average tenant stay here, and is there a school-zone premium baked into asking?
- The area grade is low — what's the realistic commute time and amenity access for the typical tenant pool here? Any planned neighborhood developments (good or bad) we should know about?
- What's the average days-on-market for RENTAL listings here right now (not sales)? A rising rental-DOM trend means longer vacancies and softer asking-rent achievability than the comps imply.
- What's the recent tenant-quality profile in this submarket — average credit score on applications, eviction rate, late-payment / NSF rate, and stable-employment percentage? A property-management company in the area should have these aggregated.
- How much new for-sale + rental construction is in the pipeline within 1–3 miles? Heavy new supply typically softens prices + rents 12–24 months out; constrained supply supports both.
Investment metrics
- 1% rule
- 0.68% ✗
- Cap rate
- 5.65%
- Cash-on-cash
- -2.29%
- DSCR
- 0.90
- GRM
- 12.2
CMA / ARV
- ARV (on-the-fly)
- $123,984
- Comps found
- 12
Show comp detail 12 sales within ~0.75 mi
| Address | Dist | Beds/Ba | Sqft | Sold | Price | $/sf | Match |
|---|---|---|---|---|---|---|---|
| 2577 E Midlothian Blvd | 0.25mi | 2/1.0 | 1,004 (-0%) | 8mo | $136,900 | $136 | 82 |
| 2510 E Midlothian Blvd | 0.38mi | 2/2.0 | 1,016 (+1%) | 3mo | $107,500 | $106 | 75 |
| 227 Maplewood Ave | 0.38mi | 2/1.5 | 990 (-2%) | 3mo | $55,000 | $56 | 75 |
| 515 Lincoln Ave | 0.35mi | 3/2.0 (+1) | 984 (-2%) | 1mo | $179,900 | $183 | 70 |
| 155 Morrison St | 0.65mi | 2/1.0 | 1,016 (+1%) | 5mo | $122,000 | $120 | 64 |
| 457 Sexton St | 0.50mi | 2/1.0 | 1,100 (+9%) | 2mo | $127,500 | $116 | 60 |
| 261 Sexton St | 0.44mi | 3/1.0 (+1) | 1,100 (+9%) | 2mo | $135,500 | $123 | 58 |
| 724 8th St | 0.45mi | 3/1.0 (+1) | 960 (-5%) | 11mo | $130,000 | $135 | 57 |
| 612 Maplewood Ave | 0.67mi | 3/1.0 (+1) | 1,056 (+5%) | 3mo | $135,000 | $128 | 54 |
| 741 5th St | 0.61mi | 2/1.0 | 1,060 (+5%) | 14mo | $103,000 | $97 | 52 |
| 3515 Lasalle Ave | 0.46mi | 3/1.0 (+1) | 1,144 (+14%) | 13mo | $81,000 | $71 | 40 |
| 608 Maplewood Ave | 0.66mi | 3/1.0 (+1) | 864 (-14%) | 6mo | $120,000 | $139 | 36 |
Match score weights: distance 35% · size 25% · config 20% · recency 20%. Top-matched comps best support the ARV.
Projected returns pro-forma
-3.0% appreciation · 3.0% rent growth · sell at horizon
- IRR
- -20.2%
- Equity multiple
- 0.30×
- Total profit
- $-32,448
- Equity at exit
- $24,602
- IRR
- -13.3%
- Equity multiple
- 0.22×
- Total profit
- $-35,844
- Equity at exit
- $14,266
Cash invested: $46,200 (down + closing). Projections, not guarantees.
Landlord ↔ Tenant lean methodology
- Overall (STATE)
- 73 Landlord-Friendly
- State Ohio
- 73 Landlord-Friendly · R+6
- County
- — inherits STATE
- City
- — inherits STATE
ZIP-level market 44471
- Home prices YoY
- -1.5%
- Active inventory
- 66
- Price-to-rent
- 12.2×
Monthly cashflow live
- Estimated rent
- $1,123 high interval (Pro) →
- Mortgage (P&I)
- −$865
- Tax from tax record
- −$41 /mo · $495/yr
- Insurance
- −$69
- HOA
- −$0
- Vacancy / Maint / Mgmt
- −$236
- Net cashflow
- $-88
Break-even live
UW: 25.0% down · 7.5% · 30yr · 1.5% tax · 5.0% vac · 8.0% maint · 8.0% mgmt
Financing live
Cash to close
- Down payment
- $41,250
- Closing costs
- $4,950
- Reserves months
- —
- Total cash needed
- —
Loan-product check · same deal, 3 products live
Conventional
25% down · 7.5% · 30yr
- Down + closing
- —
- Monthly P&I
- —
- Monthly cashflow
- —
- DSCR
- —
- Eligible?
- —
Personal DTI + credit; lowest rate.
DSCR
20% down · 8.5% · 30yr
- Down + closing
- —
- Monthly P&I
- —
- Monthly cashflow
- —
- DSCR
- —
- Eligible?
- —
No personal income docs; deal must DSCR.
Hard money
10% down · 12.0% · 12mo
- Down + closing
- —
- Monthly P&I
- —
- Monthly cashflow
- —
- DSCR
- —
- Eligible?
- —
Short-term bridge; refi at stabilization.
Rent comps 6 comps
| Address | Beds | Baths | Sqft | Rent | $/sqft | DOM | Units | Dist |
|---|---|---|---|---|---|---|---|---|
| 2523 E Midlothian Blvd Apt 5 Struthers, OH | 2.0 | 1.0 | 750 | $800 | $1.07 | 13d | 1 | 0.32mi |
| 610 Elm St Struthers, OH | 3.0 | 1.0 | 1050 | $1,500 | $1.43 | 13d | 1 | 0.61mi |
| 2002 Brownlee Ave Youngstown, OH | 1.0 | 1.0 | 820 | $875 | $1.07 | 43d | 1 | 0.82mi |
| 1914 S Heights Ave Youngstown, OH | 3.0 | 1.0 | 1115 | $1,950 | $1.75 | 43d | 1 | 0.90mi |
| 1803 Pointview Ave Youngstown, OH | 2.0 | 1.0 | 950 | $1,000 | $1.05 | 43d | 1 | 1.00mi |
| 240 Center St #3 Struthers, OH | 2.0 | 1.0 | 855 | $600 | $0.70 | 13d | 1 | 1.43mi |
Listing history 8 events
-
2026-06-19days on market $165,000 Active 8 DOM
-
2026-06-18days on market $165,000 Active 7 DOM
-
2026-06-17days on market $165,000 Active 6 DOM
-
2026-06-16days on market $165,000 Active 5 DOM
-
2026-06-15days on market $165,000 Active 4 DOM
-
2026-06-14days on market $165,000 Active 2 DOM
-
2026-06-13remarks 699-char remark
-
2026-06-13$165,000 Active 1 DOM
ⓘ Source: listings_history table (triggers on properties + properties_extension) + one-shot
backfill from property_details.listing_events for pre-trigger history.
Tax reassessment forecast OH · Partial reset (capped growth)
- Current annual tax
- $495 · $41/mo
- Projected year-2 tax
- $1,535 · $128/mo
- Expected delta
- +$1,039/yr (+$87/mo · 209.9%)
ⓘ Screening estimate from a state-policy table — verify with the county assessor before closing.
Climate risk First Street
- Flood 1/10 Low FEMA zone X (unshaded) · 0% chance over 30 yrs
- Wildfire 1/10 Low
- Heat 3/10 Moderate 7 d/yr ≥97°F today · 17 d/yr by 30 yrs out
- Wind 1/10 Low
- Air quality 3/10 Moderate 1 unhealthy d/yr today · 4 by 30 yrs out
Nearby sold comps map
Loading sold comps map…
Walkable amenities ~0.75 mi
Loading nearby amenities…
Taxation est. · year 1
- Rental income
- $13,473
- − Mortgage interest
- −$9,243
- − Property taxes
- −$495
- − Insurance
- −$825
- − Repairs & maintenance
- −$1,078
- − Management
- −$1,078
- − Depreciation
- −$4,800
- Taxable loss
- −$4,046
- Est. tax savings @ 24.0%
- +$971
- After-tax cash flow
- $-89/yr
For passive investors: Depreciation is non-cash, so a rental often shows a tax loss while cash-flowing — sheltering income. Rental losses are passive: they offset passive income freely, and up to $25,000/yr can offset ordinary (W-2) income if you actively participate and your MAGI is under $100k (phasing out to $0 by $150k); unused losses carry forward. On sale, claimed depreciation is recaptured at up to 25%, and gains may owe capital-gains tax (a 1031 exchange can defer both). Figures are a year-1 estimate at your 24.0% rate — not tax advice; consult a CPA.
Schools (NCES district)
- District
- Struthers City
- NCES district ID
- 3904485
- Math proficiency
- 45% ▼ -12.00%
- Reading proficiency
- 52% ▼ -8.00%
- Median HH income
- $37,753
- Composite
- 40.35/100
- National rank
- #3742
- State rank
- #475 of 656 in OH
Livability — Struthers
- Score
- 71/100
- State rank
- #418
- US rank
- #6867
Category grades
Schools grade is shown separately in the Schools card above.
Census & demographics
- Census place
- Struthers, OH
- County
- Mahoning · 224,175 people
- City population
- 10,296
- Metro
- Youngstown-Warren, OH
- Population (ZIP)
- 10,296
- Household income
- $52,811
- Rent vs Own
- Severe rent burden
- 12.2
Population outlook (Mahoning County) Hauer SSP2
- Today (2025)
- 223,932 people
- By 2030
- 218,387 · -2.5%
- By 2040
- 205,367 · -8.3%
- By 2050
- 193,606 · -13.5%
- By 2075
- 173,694 · -22.4%
- By 2100
- 151,147 · -32.5%
Race, ethnicity, and origin ACS 2023
- Neighborhood character
- Predominantly White (82%)
- Race & ethnicity
- White 82% Hispanic / Latino 8% Two or more races 8% Black 4% Asian 1%
- Hispanic origin (detail)
- Mexican 2% Puerto Rican 5%
- Common ancestry
- Romanian 8% Lithuanian 4% Slovak 1%
- Foreign-born
- 2% · Canada
- Languages at home
- 94% English-only · Spanish 4% Arabic 1% Other Indo-European 1%
Political lean MEDSL · Mahoning
- 2024 margin
- Lean R (+9.4) · D 44.9% · R 54.4%
- 2008→2024 swing
- -36.1pp toward R · 2008: 26.6pp · 2024: -9.4pp
- All cycles
- 2024: R+9.4 2020: R+1.9 2016: D+3.0 2012: D+27.7 2008: D+26.6
Not yet ingested
- Civics
- —
Market trends
- HPI YoY
- ▼ -4.12%
- Current HPI
- 274.6394
- Rent YoY
- —
- Metro
- —
- State GDP YoY
- ▲ 1.98%
- F500 in state
- 48
Industry mix (Fortune 500 HQ in OH)
| Industry | F500 HQs | Revenue |
|---|---|---|
| Insurance | 3 | $145B |
|
||
| Industrial Machinery | 3 | $49B |
|
||
| Financial Services | 3 | $24B |
|
||
| Consumer Goods | 2 | $93B |
|
||
| Aerospace / Defense | 2 | $47B |
|
||
| Utilities | 2 | $33B |
|
||
Price history
+537.1% since first listed7 events — show timeline
- 2026-06-11 Listed $165,000 MLSNOW
- 2017-03-01 Listing Removed — MLSNOW
- 2016-10-26 Contingent — MLSNOW
- 2016-08-10 Price Changed $29,900 MLSNOW
- 2016-08-10 Relisted — MLSNOW
- 2016-05-25 Contingent — MLSNOW
- 2016-05-21 Listed $25,900 MLSNOW
Property tax history
+2.3%/yrLatest (2025): $495 · -0.0% YoY. Source: county tax records.
Cash-flow waterfall
monthlySold comps — $/sqft
last 12 mo · ≤1 miLoading sold comps…