514 Ridge Rd SE #111 · Washington, DC
Flood risk 1/10 · Minimal
- FEMA flood zone
- X (unshaded)
- Chance of flooding over 30 yrs
- 0.0%
- Est. flood insurance / yr
- $507 – $1,088
Fire risk 2/10 · Minimal
- Est. fire insurance / yr
- $631 – $1,173
Heat risk 7/10 · Major
- Hot days now (above 104°F)
- 7 days/yr
- Hot days in 30 yrs
- 14 days/yr
Wind risk 4/10 · Minor
- Chance of severe wind over 30 yrs
- 20.0%
Air-quality risk 4/10 · Minor
- Unhealthy air days now
- 4 days/yr
- Unhealthy air days in 30 yrs
- 5 days/yr
Risk factors via First Street. Map © Google.
Why this score? — see what drove the B grade
The composite is a weighted blend of 9 inputs, each scored 0–100. Each bar is that input's sub-score; the figure is the points it added to the 100-point composite (weight × sub-score).
- Cash flow +30.0/30.0
- 1% rule +10.0/10.0
- DSCR +10.0/10.0
- ARV discount +7.5/15.0
- Rent growth +4.0/5.0
- Livability +3.7/5.0
- Schools +3.6/10.0
- Condition / age +2.5/5.0
- Appreciation +0.0/10.0
$70,000
🖨 Deal sheet 📄 Offer letter ✓ Due diligence
Listing remarks MLS
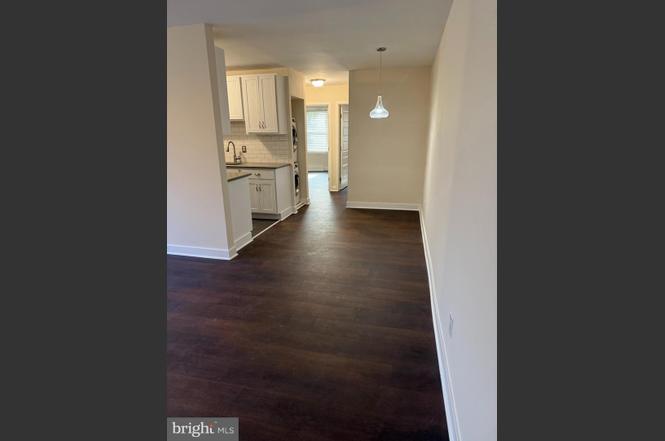
Spacious unit located in fort DuPont park (last building before the park)-building is quiet and secluded. Metro bus stop in front of building. Elementary school across the street. Off street parking available. newly renovated about two years. Won't last long bring your clients.
Key facts
- $347 HOA
- Built 1958
- Listed 118 days
Property features AI
Finance
- Other: Assessor listed living area and year built information; Outside city limits; Directions: follow GPS directions
- HOA & community: Condo fee $347 monthly; Condo fee covers common area maintenance, lawn maintenance, sewer, trash, and water; Pets allowed on a case-by-case basis
Exterior
- Parking: On-street parking; Parking lot
- Utilities: Public water; Public sewer (public septic listed); No municipal trash; Electric heating/cooling/hot water
- Home design: Condominium unit; Garden-style building (1–4 floors); Unit/flat; Entry on level 1
- Construction: Brick construction; Building not winterized; Above-grade and below-grade structures
- Exterior features: Not in a federal flood zone; Tidal water: No
Interior
- Kitchen: Built-in microwave; Built-in range; Dishwasher; Refrigerator
- Bedrooms: 2 bedrooms on main level
- Flooring: Wood floors
- Bathrooms: 1 full bathroom on main level; 1 full bathroom total
- Heating & cooling: Wall unit heating (electric); Ductless/mini-split cooling (electric); Electric hot water
- Interior features: Wood floors; No basement; No stairs (accessible)
- Laundry & utility: Front-loading washer; Front-loading dryer; Washer/dryer hookup in unit
Neighborhood map
What this means for you Summary
Snapshot
- This is a 1-bed/1.0-bath condo listed at $70k.
Deal economics
- At list price, monthly cash flow is $477 ($6k/yr) — positive.
- The deal already cash-flows at list — no discount required.
- Meets the 1% rule at list price ($2k rent vs $70k).
- Recommended offer: $64k (9.0% below list) — sets the bar for market timing.
- Cap rate 14.5% vs local median 2.5% in Washington — top-decile yield for the area; either an underpriced asset or a hidden risk that comps aren't pricing in. Stress-test before assuming the spread holds.
Location & tenants
- Location reads 73/100 on livability (#1 in DC) — a middle-class / working-renter tenant base. Strengths: amenities A+, commute A+, employment A+; Watch: crime F, cost of living F.
- District Of Columbia Public Schools (urban): math 33% / reading 40% proficiency, ranked #8 of 32 in DC (top 25%) — families likely to look elsewhere, expect single-tenant / working-renter base with shorter leases; 65% free/reduced lunch — lower-income household profile, screen leases tightly.
- Market conditions: Rents rising fast (+6.1%/yr); 276 active listings in the ZIP; 40 comparable units currently listed for rent nearby; rentals at typical pace (median 25d on market — plan ~3-4 weeks tenant-placement turnaround); 1,737 units permitted in District of Columbia in 2024 (1,506 in 5+ unit buildings).
- This rent runs 33% of the median local income ($58k/yr) — at the standard rent-burdened threshold; future hikes will face affordability resistance.
Forward outlook
- Local home prices are declining (-3.0%/yr); year-one equity from $484 of loan paydown is wiped out by about $2k of value loss. Plan a longer hold.
- District of Columbia County population projected at +50% by 2050 — long-run rental-demand tailwind backs the buy-and-hold thesis.
- At projected returns (-3.0% appreciation + 6.1% rent growth), your $20k cash investment doubles in ~4 years — after that, you're playing with house money.
Negotiation context
- It's been on market 118 days — a 9% lower offer ($64k) is reasonable based on typical stale-listing flexibility.
- 13 sale attempts since 14y ago; this cycle's ask has dropped $34k (33%) from the opening price — seller is motivated, your offer sets the floor, not the list.
- Current owner paid $45k; list at $70k implies a 56% gain — meaningful room to come down on a strong offer.
Risks & watch-outs
- Watch-outs: HOA is 22% of rent; built in 1958 — expect roof / HVAC / electrical / plumbing capex.
- Climate carrying-cost: extreme-heat days projected 7→14/yr by 2055 (HVAC capex compounding) — expect insurance premiums to compound above CPI over the hold.
Questions for the listing agent
- It's been on market 118 days. Have you received any prior offers? Is the seller open to a 9% concession, seller financing, or rate buy-down credit?
- Built in 1958 — when were the roof, HVAC, electrical panel, plumbing, and water heater last replaced?
- What does the HOA fee cover, when was the last increase, and are there any pending special assessments or reserve-fund shortfalls?
- Any open or pending special assessments — roof, HVAC, plumbing, elevator, façade? What's the per-unit balance and payoff schedule, and is the seller paying it off at close or rolling it to the buyer?
- Why hasn't it sold? Are there any deal-killer items the seller is aware of (foundation, flood, title, zoning, code violations)?
- Is there a deadline driving the sale (1031 exchange, divorce, estate, relocation)? That informs how much negotiation room exists.
- Crime grade is F in this area — have there been break-ins, vandalism, or insurance claims at this property in the last 3 years? What carrier currently insures it and at what premium?
- What's the average days-on-market for RENTAL listings here right now (not sales)? A rising rental-DOM trend means longer vacancies and softer asking-rent achievability than the comps imply.
- What's the recent tenant-quality profile in this submarket — average credit score on applications, eviction rate, late-payment / NSF rate, and stable-employment percentage? A property-management company in the area should have these aggregated.
- How much new apartment / multifamily construction is in the pipeline within 1–3 miles? Heavy new supply (>2% of stock underway) typically softens rents 12–24 months out; light construction supports rent growth.
Investment metrics
- 1% rule
- 2.30% ✓
- Cap rate
- 14.47%
- Cash-on-cash
- 29.22%
- DSCR
- 2.30
- GRM
- 3.6
CMA / ARV
No comps found within radius.
Projected returns pro-forma
-3.0% appreciation · 6.06% rent growth · sell at horizon
- IRR
- 28.3%
- Equity multiple
- 2.24×
- Total profit
- $24,377
- Equity at exit
- $10,437
- IRR
- 38.0%
- Equity multiple
- 5.26×
- Total profit
- $83,570
- Equity at exit
- $6,052
Cash invested: $19,600 (down + closing). Projections, not guarantees.
Landlord ↔ Tenant lean methodology
- Overall (CITY)
- 0 Strongly Tenant-Friendly
- State District of Columbia
- 12 Strongly Tenant-Friendly · D+43
- County
- — inherits STATE
- City Washington
- 0 Strongly Tenant-Friendly · D+43
ZIP-level market 20019
- Rents YoY
- 6.1%
- Active inventory
- 276
- Price-to-rent
- 3.6×
Monthly cashflow live
- Estimated rent
- $1,610 high interval (Pro) →
- Mortgage (P&I)
- −$367
- Tax from tax record
- −$52 /mo · $621/yr
- Insurance
- −$29
- HOA
- −$347
- Vacancy / Maint / Mgmt
- −$338
- Net cashflow
- $477
Break-even live
UW: 25.0% down · 7.5% · 30yr · 1.5% tax · 5.0% vac · 8.0% maint · 8.0% mgmt
Financing live
Cash to close
- Down payment
- $17,500
- Closing costs
- $2,100
- Reserves months
- —
- Total cash needed
- —
Loan-product check · same deal, 3 products live
Conventional
25% down · 7.5% · 30yr
- Down + closing
- —
- Monthly P&I
- —
- Monthly cashflow
- —
- DSCR
- —
- Eligible?
- —
Personal DTI + credit; lowest rate.
DSCR
20% down · 8.5% · 30yr
- Down + closing
- —
- Monthly P&I
- —
- Monthly cashflow
- —
- DSCR
- —
- Eligible?
- —
No personal income docs; deal must DSCR.
Hard money
10% down · 12.0% · 12mo
- Down + closing
- —
- Monthly P&I
- —
- Monthly cashflow
- —
- DSCR
- —
- Eligible?
- —
Short-term bridge; refi at stabilization.
Rent comps 40 comps
| Address | Beds | Baths | Sqft | Rent | $/sqft | DOM | Units | Dist |
|---|---|---|---|---|---|---|---|---|
| 429 Burbank St SE Apt 4 Washington, DC | 1.0 | 1.0 | 594 | $1,235 | $2.08 | 24d | 1 | 0.19mi |
| 4332 Gorman Ter SE Washington, DC | 2.0 | 1.0 | 832 | $2,350 | $2.82 | 22d | 1 | 0.24mi |
| 3738 D St SE Washington, DC | 1.0–2.0 | 1.0 | 542 | $1,179 | $2.17 | 7d | 12 | 0.26mi |
| 4213 Hildreth St SE Washington, DC | 2.0 | 1.5 | 832 | $2,500 | $3.00 | 24d | 1 | 0.35mi |
| 300 37th St SE Unit 101 Washington, DC | 2.0 | 1.0 | 850 | $1,550 | $1.82 | 24d | 1 | 0.44mi |
| 305 37th St SE Washington, DC | 1.0–2.0 | 1.0–1.5 | 787 | $1,250 | $1.59 | 24d | 1 | 0.46mi |
| 3600 Ely Pl SE Washington, DC | 1.0–3.0 | 1.0 | 719 | $1,598 | $2.22 | 3d | 10 | 0.47mi |
| 3516 Ely Pl SE Unit 4 Washington, DC | 1.0 | 1.0 | 700 | $1,450 | $2.07 | 24d | 1 | 0.51mi |
| 301 Anacostia Rd SE Unit 2 BEDROOM Washington, DC | 2.0 | 1.0 | 600 | $1,300 | $2.17 | 24d | 1 | 0.53mi |
| 319 Anacostia Rd SE Unit 1 Washington, DC | 2.0 | 1.0 | 724 | $1,035 | $1.43 | 24d | 1 | 0.54mi |
| 4040 E Capitol St NE Washington, DC | 1.0–2.0 | 1.0–1.5 | 716 | $1,403 | $1.96 | 7d | 1 | 0.57mi |
| 4473 B St SE #304 Washington, DC | 2.0 | 1.0 | 775 | $1,999 | $2.58 | 22d | 1 | 0.58mi |
| 4427 A St SE Unit 1 Washington, DC | 2.0 | 1.0 | 920 | $1,900 | $2.07 | 24d | 1 | 0.60mi |
| 4805 Texas Ave SE Washington, DC | 1.0–2.0 | 1.0 | 775 | $1,166 | $1.50 | 24d | 1 | 0.61mi |
| 4701 Benning Rd SE Washington, DC | 1.0 | 1.0 | 600 | $1,100 | $1.83 | 24d | 1 | 0.61mi |
| 4110 Ames St NE #14 Washington, DC | 2.0 | 1.0 | 1098 | $1,850 | $1.68 | 24d | 1 | 0.64mi |
| 3539 A St SE Washington, DC | 1.0–2.0 | 1.0–2.0 | 807 | $1,123 | $1.39 | 18d | 1 | 0.64mi |
| 4732 Benning Rd SE #102 Washington, DC | 1.0 | 1.0 | 581 | $1,150 | $1.98 | 24d | 1 | 0.67mi |
| 3427 B St SE Unit 4 Washington, DC | 1.0 | 1.0 | 558 | $1,300 | $2.33 | 24d | 1 | 0.67mi |
| 4511 B St SE Washington, DC | 1.0–2.0 | 1.0 | 675 | $1,500 | $2.22 | 24d | 2 | 0.68mi |
| 4020 Blaine St NE Washington, DC | — | 1.0 | 1000 | $1,400 | $1.40 | 18d | 1 | 0.70mi |
| 3315 Dubois Pl SE Washington, DC | 1.0 | 1.0 | 650 | $1,000 | $1.54 | 24d | 1 | 0.73mi |
| 4820 C St SE #304 Washington, DC | 2.0 | 1.0 | 635 | $1,600 | $2.52 | 24d | 1 | 0.74mi |
| 3313 C St SE Washington, DC | 1.0–2.0 | 1.0 | 750 | $1,245 | $1.66 | 1d | 2 | 0.75mi |
| 324 Saint Louis St SE Washington, DC | 2.0 | 1.0 | 640 | $1,750 | $2.73 | 7d | 1 | 0.77mi |
| 4615 Central Ave NE Unit B Washington, DC | 2.0 | 1.0 | 875 | $1,450 | $1.66 | 24d | 1 | 0.78mi |
| 4236 Benning Rd NE Washington, DC | 1.0 | 1.0 | 700 | $1,095 | $1.56 | 4d | 1 | 0.78mi |
| 4236 Benning Rd NE Unit 302 Washington, DC | 1.0 | 1.0 | 770 | $1,195 | $1.55 | 24d | 1 | 0.78mi |
| 3217 Dubois Pl SE Unit 2 Washington, DC | 1.0 | 1.0 | 800 | $1,150 | $1.44 | 11d | 1 | 0.80mi |
| 165 35th St NE Unit 2 Washington, DC | 1.0 | 1.0 | 700 | $1,495 | $2.14 | 24d | 1 | 0.80mi |
| 165 35th St NE Unit 3 Washington, DC | 1.0 | 1.0 | 750 | $1,625 | $2.17 | 24d | 1 | 0.80mi |
| 134 35th St NE Washington, DC | 2.0 | 1.5 | 832 | $2,275 | $2.73 | 24d | 1 | 0.80mi |
| 229 43rd Rd NE Washington, DC | 2.0 | 1.0 | 800 | $1,500 | $1.88 | 18d | 1 | 0.81mi |
| 195 35th St NE Unit 1 Washington, DC | 2.0 | 1.0 | 716 | $1,800 | $2.51 | 24d | 1 | 0.82mi |
| 212 36th St NE #1 Washington, DC | 2.0 | 1.0 | 750 | $2,550 | $3.40 | 24d | 1 | 0.83mi |
| 4601 Blaine St NE Unit 1 Washington, DC | 2.0 | 1.0 | 750 | $1,500 | $2.00 | 24d | 1 | 0.84mi |
| 5005 D St SE #104 Washington, DC | 2.0 | 1.0 | 772 | $1,700 | $2.20 | 5d | 1 | 0.84mi |
| 4348 Southern Ave SE Washington, DC | 2.0 | 1.0 | 650 | $2,300 | $3.54 | 24d | 1 | 0.86mi |
| 4348 Southern Ave SE Unit Radiance Washington, DC | 2.0 | 1.0 | 550 | $2,200 | $4.00 | 18d | 1 | 0.86mi |
| 21 Randle Cir SE Washington, DC | 2.0 | 1.0 | 1100 | $2,477 | $2.25 | 24d | 1 | 0.87mi |
HOA detail condo
- Monthly dues
- $347 · $4,164/yr
- Assessments
- None detected in remarks — confirm with the listing agent.
Listing history 41 events
-
2026-06-18pricestatus $70,000 Active 118 DOM
-
2026-05-06price $80,000
-
2026-05-06status Active
-
2026-04-22historical Active Under Contract
-
2026-03-25price $95,000
-
2026-01-16$104,500 Active
-
2026-01-09historical $104,500
-
2025-03-28historical $1,590
-
2025-03-11price $1,590
-
2025-03-10status Pending
-
2025-03-10historical Active Under Contract
-
2025-03-10historical
-
2025-03-07status Active
-
2025-02-16historical Active Under Contract
-
2025-02-15price $1,700
-
2025-02-13$1,850
-
2025-02-12$104,500 Active
-
2025-02-08historical
-
2023-07-03historical
-
2016-02-01soldstatus $45,000
-
2016-01-19soldstatus $45,000 279-char remark
Show marketing remark (279 chars)
Spacious unit located in fort DuPont park (last building before the park)-building is quiet and secluded. Metro bus stop in front of building. Elementary school across the street. Off street parking available. newly renovated about two years. Won't last long bring your clients.
-
2016-01-19soldstatus $45,000 Sold
Show marketing remark (279 chars)
Spacious unit located in fort DuPont park (last building before the park)-building is quiet and secluded. Metro bus stop in front of building. Elementary school across the street. Off street parking available. newly renovated about two years. Won't last long bring your clients.
-
2015-12-21status Contract
-
2015-12-01status Active
-
2015-11-06status Contract
-
2015-10-20status Active
-
2015-10-15status Contract
-
2015-10-14status Active
-
2015-10-13status Contract
-
2015-09-18$49,950 Active
-
2013-04-23soldstatus $22,000
-
2012-08-05soldstatus $22,000
-
2012-08-05soldstatus $22,000
-
2012-08-05$20,500
-
2012-08-05$20,500
-
2012-06-22historical Withdrawn
-
2012-06-22historical
-
2012-06-05status Contingent (No Kick Out)
-
2012-06-03Active
-
2012-06-03$20,500
-
1970-01-08soldstatus $14,400
ⓘ Source: listings_history table (triggers on properties + properties_extension) + one-shot
backfill from property_details.listing_events for pre-trigger history.
Tax reassessment forecast DC · Partial reset (capped growth)
- Current annual tax
- $621 · $52/mo
- Projected year-2 tax
- $621 · $52/mo
- Expected delta
- $0/yr ($0/mo · 0.0%)
ⓘ Screening estimate from a state-policy table — verify with the county assessor before closing.
Climate risk First Street
- Flood 1/10 Low FEMA zone X (unshaded) · 0% chance over 30 yrs
- Wildfire 2/10 Low
- Heat 7/10 Severe 7 d/yr ≥104°F today · 14 d/yr by 30 yrs out
- Wind 4/10 Moderate 20% chance of damaging wind over 30 yrs
- Air quality 4/10 Moderate 4 unhealthy d/yr today · 5 by 30 yrs out
Nearby sold comps map
Loading sold comps map…
Walkable amenities ~0.75 mi
Loading nearby amenities…
Taxation est. · year 1
- Rental income
- $19,325
- − Mortgage interest
- −$3,921
- − Property taxes
- −$621
- − Insurance
- −$350
- − Repairs & maintenance
- −$1,546
- − Management
- −$1,546
- − HOA
- −$4,164
- − Depreciation
- −$2,036
- Taxable income
- $5,140
- Est. tax owed @ 24.0%
- −$1,234
- After-tax cash flow
- $4,493/yr
For passive investors: Depreciation is non-cash, so a rental often shows a tax loss while cash-flowing — sheltering income. Rental losses are passive: they offset passive income freely, and up to $25,000/yr can offset ordinary (W-2) income if you actively participate and your MAGI is under $100k (phasing out to $0 by $150k); unused losses carry forward. On sale, claimed depreciation is recaptured at up to 25%, and gains may owe capital-gains tax (a 1031 exchange can defer both). Figures are a year-1 estimate at your 24.0% rate — not tax advice; consult a CPA.
Schools (NCES district)
- District
- District Of Columbia Public Schools
- NCES district ID
- 1100030
- Math proficiency
- 33% ▲ 3.00%
- Reading proficiency
- 40% ▲ 5.00%
- Median HH income
- $67,671
- Composite
- 35.84/100
- National rank
- #9606
- State rank
- #8 of 32 in DC
Livability — Washington
- Score
- 73/100
- State rank
- #1
- US rank
- #5327
Category grades
Schools grade is shown separately in the Schools card above.
Census & demographics
- Census place
- Washington, DC
- County
- District of Columbia · 671,873 people
- City population
- 671,873
- Metro
- Washington-Arlington-Alexandria, DC-VA-MD-WV
- Population (ZIP)
- 63,380
- Household income
- $58,296
- Rent vs Own
- Severe rent burden
- 5115.0
Population outlook (District of Columbia County) Hauer SSP2
- Today (2025)
- 821,926 people
- By 2030
- 899,517 · +9.4%
- By 2040
- 1,061,162 · +29.1%
- By 2050
- 1,231,493 · +49.8%
- By 2075
- 1,603,312 · +95.1%
- By 2100
- 1,847,141 · +124.7%
Race, ethnicity, and origin ACS 2023
- Neighborhood character
- Predominantly Black (87%)
- Race & ethnicity
- Black 87% Hispanic / Latino 7% Two or more races 4% White 2%
- Hispanic origin (detail)
- Mexican 1% Dominican 1%
- Foreign-born
- 6% · Canada
- Languages at home
- 91% English-only · Spanish 6% French/Haitian/Cajun 1%
Political lean MEDSL · District of Columbia
- 2024 margin
- Solid D (+86.1) · D 91.2% · R 5.1% · Other 3.8%
- 2008→2024 swing
- +0.1pp no change · 2008: 85.9pp · 2024: 86.1pp
- All cycles
- 2024: D+86.1 2020: D+86.8 2016: D+88.7 2012: D+84.2 2008: D+85.9
Not yet ingested
- Civics
- —
Market trends
- HPI YoY
- ▼ -416.91%
- Current HPI
- 326.4481
- Rent YoY
- ▲ 6.06%
- Metro
- Washington-Arlington-Alexandria, DC-VA-MD-WV
- State GDP YoY
- ▲ 1.33%
- F500 in state
- 6
Industry mix (Fortune 500 HQ in DC)
| Industry | F500 HQs | Revenue |
|---|---|---|
| Financial Services | 1 | $153B |
|
||
| Life Sciences / Industrials | 1 | $25B |
|
||
| Industrial Machinery | 1 | $8B |
|
||
Price history
+455.6% since first listed40 events — show timeline
- 2026-05-06 Price Changed $80,000 BRIGHT MLS
- 2026-05-06 Relisted — BRIGHT MLS
- 2026-04-22 Contingent — BRIGHT MLS
- 2026-03-25 Price Changed $95,000 BRIGHT MLS
- 2026-01-16 Listed $104,500 BRIGHT MLS
- 2026-01-09 Coming Soon $104,500 BRIGHT MLS
- 2025-03-28 Rental Removed $1,590 BRIGHTMLS
- 2025-03-11 Price Changed $1,590 BRIGHTMLS
- 2025-03-10 Pending — BRIGHT MLS
- 2025-03-10 Contingent — BRIGHT MLS
- 2025-03-10 Listing Removed — BRIGHT MLS
- 2025-03-07 Relisted — BRIGHT MLS
- 2025-02-16 Contingent — BRIGHT MLS
- 2025-02-15 Price Changed $1,700 BRIGHTMLS
- 2025-02-13 Listed for Rent $1,850 BRIGHTMLS
- 2025-02-12 Listed $104,500 BRIGHT MLS
- 2025-02-08 Coming Soon — BRIGHT MLS
- 2023-07-03 Rental Removed — APPFOLIO
- 2016-02-01 Sold (Public Records) $45,000 Public Records
- 2016-01-19 Sold (MLS) $45,000 MRIS
- 2016-01-19 Sold (MLS) $45,000 BRIGHT MLS
- 2015-12-21 Pending — MRIS
- 2015-12-01 Relisted — MRIS
- 2015-11-06 Pending — MRIS
- 2015-10-20 Relisted — MRIS
- 2015-10-15 Pending — MRIS
- 2015-10-14 Relisted — MRIS
- 2015-10-13 Pending — MRIS
- 2015-09-18 Listed $49,950 MRIS
- 2013-04-23 Sold (Public Records) $22,000 Public Records
- 2012-08-05 Listed $20,500 MRIS
- 2012-08-05 Listed $20,500 BRIGHT MLS
- 2012-08-05 Sold (MLS) $22,000 MRIS
- 2012-08-05 Sold (MLS) $22,000 BRIGHT MLS
- 2012-06-22 Delisted — MRIS
- 2012-06-22 Listing Removed — BRIGHT MLS
- 2012-06-05 Pending — MRIS
- 2012-06-03 Listed — MRIS
- 2012-06-03 Listed $20,500 BRIGHT MLS
- 1970-01-08 Sold (Public Records) $14,400 Public Records
Property tax history
-2.0%/yrLatest (2025): $621 · +8.1% YoY. Source: county tax records.
Cash-flow waterfall
monthlySold comps — $/sqft
last 12 mo · ≤1 miLoading sold comps…