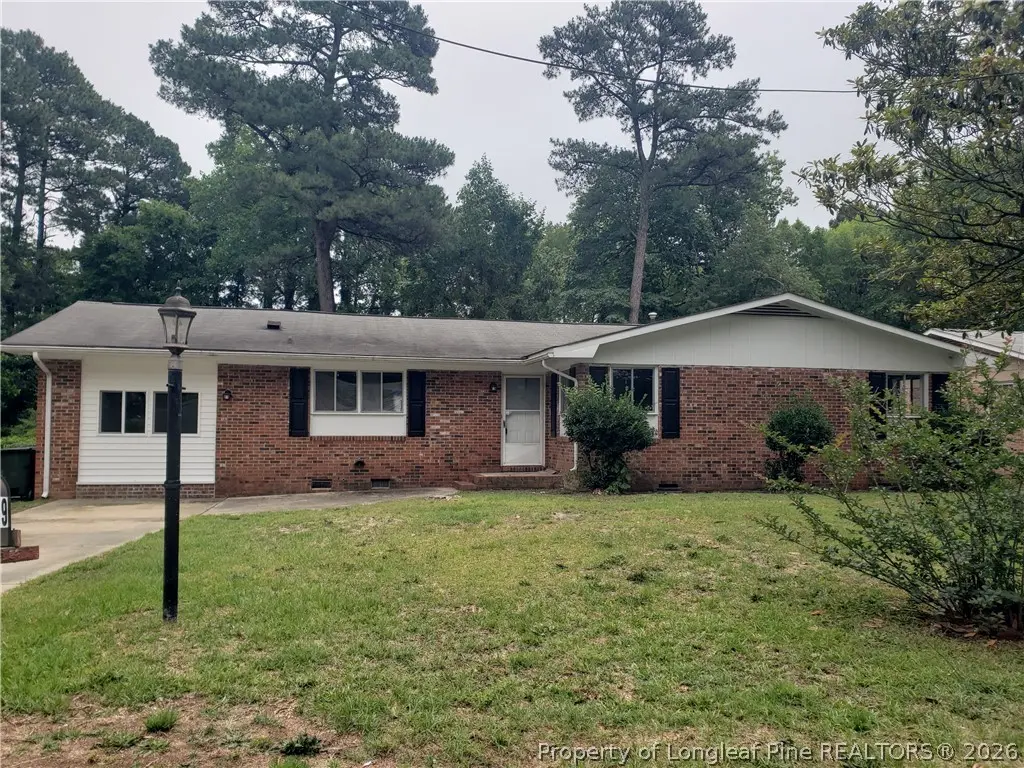
1939 Ashton Rd · Fayetteville, NC
Flood risk 1/10 · Minimal
- FEMA flood zone
- X (unshaded)
- Chance of flooding over 30 yrs
- 0.0%
- Est. flood insurance / yr
- $507 – $1,088
Fire risk 5/10 · Moderate
- Est. fire insurance / yr
- $906 – $1,684
Heat risk 7/10 · Major
- Hot days now (above 106°F)
- 7 days/yr
- Hot days in 30 yrs
- 16 days/yr
Wind risk 6/10 · Moderate
- Chance of severe wind over 30 yrs
- 74.0%
Air-quality risk 1/10 · Minimal
- Unhealthy air days now
- 0 days/yr
- Unhealthy air days in 30 yrs
- 0 days/yr
Risk factors via First Street. Map © Google.
Why this score? — see what drove the D grade
The composite is a weighted blend of 9 inputs, each scored 0–100. Each bar is that input's sub-score; the figure is the points it added to the 100-point composite (weight × sub-score).
- Cash flow +12.3/30.0
- ARV discount +11.7/15.0
- Livability +3.8/5.0
- DSCR +3.7/10.0
- Rent growth +3.3/5.0
- 1% rule +3.2/10.0
- Schools +3.1/10.0
- Condition / age +2.5/5.0
- Appreciation +0.0/10.0
$195,000
🖨 Deal sheet (PDF) 📄 Offer letter ✓ Due diligence
Listing remarks MLS
3 BEDROOM 2 BATH RANCH HOME.
Key facts
- 0.23 acre lot
- Built 1965
- Listed 11 days
Property features AI
Exterior
- Utilities: Public water; Public sewer
- Home design: Single-family residence; Residential property
- Construction: Brick veneer exterior
- Exterior features: Covered porch; Patio; Partial fencing
Interior
- Kitchen: Refrigerator; Dishwasher; Range; Range hood; Water heater
- Bedrooms: 7 total rooms (includes bedrooms and living spaces)
- Flooring: Laminate; Vinyl; Carpet
- Bathrooms: 2 full bathrooms
- Heating & cooling: Natural gas forced-air heating; Central electric air conditioning; Ceiling fan(s)
- Interior features: Ceiling fans; Pantry; Crawl space basement
- Laundry & utility: Washer hookup
Neighborhood map
What this means for you Summary
Snapshot
- This is a 3-bed/2.0-bath single-family listed at $195k.
Deal economics
- At list price, monthly cash flow is $-35 ($-415/yr) — negative.
- To cash-flow at today's rent, offer at most $189k (3.1% below list).
- To meet the 1% rule (rent ≥ 1% of price), the offer needs to be $160k (17.9% below list).
- Recommended offer: $160k (17.9% below list) — sets the bar for 1% rule.
- Cap rate 6.1% vs local median 4.8% in Fayetteville — meaningfully above typical; check what's discounted (condition, days-on-market, listing class) to confirm the premium yield is real.
Location & tenants
- Location reads 75/100 on livability (#45 in NC, #4,031 nationally) — a middle-class / working-renter tenant base. Strengths: commute A+, cost of living A+, housing A+; Watch: crime F, employment D-.
- Cumberland County Schools (urban): math 32% / reading 41% proficiency, ranked #126 of 178 in NC (top 71%) — families likely to look elsewhere, expect single-tenant / working-renter base with shorter leases.
- Zoned schools: Sherwood Park Elementary (math 22% / reading 22%, grade F, #1,190 of 1,410 statewide, top 86%, 279 students, 99% FRL); Douglas Byrd Middle (math 13% / reading 30%, grade F, #422 of 475 statewide, top 89%, 935 students, 100% FRL); Douglas Byrd High (math 22% / reading 42%, grade F, #445 of 535 statewide, top 84%, 940 students, 99% FRL) — zoned schools average 99% FRL vs 55% district-wide (45 pts higher); higher-poverty schools than district average — tighter screening recommended.
- Market conditions: Rents rising (+3.2%/yr); 308 active listings in the ZIP; 28 comparable units currently listed for rent nearby; rentals at typical pace (median 25d on market — plan ~3-4 weeks tenant-placement turnaround); 1,125 units permitted in Cumberland County in 2024 (104 in 5+ unit buildings).
- This rent runs 33% of the median local income ($59k/yr) — at the standard rent-burdened threshold; future hikes will face affordability resistance.
Forward outlook
- Local home prices are declining (-3.0%/yr); year-one equity from $1k of loan paydown is wiped out by about $6k of value loss. Plan a longer hold.
Negotiation context
- Only 11 days on market — expect competitive offers; lowballing is unlikely to land.
- 2 sale attempts since 12y ago; this cycle's ask is 12481% above the opening price — seller raised mid-cycle; expect resistance to lowballs.
- Current owner paid $82k; list at $195k implies a 136% gain — meaningful room to come down on a strong offer.
Risks & watch-outs
- Climate carrying-cost: major wind risk, 74% chance of damaging wind over 30y; moderate wildfire risk; extreme-heat days projected 7→16/yr by 2055 (HVAC capex compounding) — expect insurance premiums to compound above CPI over the hold.
Questions for the listing agent
- What do current leases actually rent for vs. the listed asking? Can we see a recent rent roll and the last 12 months of T-12 income?
- Built in 1965 — when were the roof, HVAC, electrical panel, plumbing, and water heater last replaced?
- Is there a deadline driving the sale (1031 exchange, divorce, estate, relocation)? That informs how much negotiation room exists.
- Crime grade is F in this area — have there been break-ins, vandalism, or insurance claims at this property in the last 3 years? What carrier currently insures it and at what premium?
- The area grade is low — what's the realistic commute time and amenity access for the typical tenant pool here? Any planned neighborhood developments (good or bad) we should know about?
- What's the average days-on-market for RENTAL listings here right now (not sales)? A rising rental-DOM trend means longer vacancies and softer asking-rent achievability than the comps imply.
- What's the recent tenant-quality profile in this submarket — average credit score on applications, eviction rate, late-payment / NSF rate, and stable-employment percentage? A property-management company in the area should have these aggregated.
- How much new for-sale + rental construction is in the pipeline within 1–3 miles? Heavy new supply typically softens prices + rents 12–24 months out; constrained supply supports both.
Investment metrics
- 1% rule
- 0.82% ✗
- Cap rate
- 6.08%
- Cash-on-cash
- -0.76%
- DSCR
- 0.97
- GRM
- 10.2
CMA / ARV
- ARV (on-the-fly)
- $215,232
- Comps found
- 12
Show comp detail 12 sales within ~0.75 mi
| Address | Dist | Beds/Ba | Sqft | Sold | Price | $/sf | Match |
|---|---|---|---|---|---|---|---|
| 2167 Quail Ridge Dr | 0.29mi | 3/1.5 | 1,420 (+0%) | 2mo | $205,000 | $144 | 83 |
| 4251 Knollwood Dr | 0.37mi | 3/2.0 | 1,401 (-1%) | 4mo | $275,000 | $196 | 78 |
| 2502 Nobie St | 0.34mi | 3/2.0 | 1,492 (+5%) | 4mo | $205,000 | $137 | 72 |
| 1810 Ashton Rd | 0.42mi | 3/1.5 | 1,348 (-5%) | 2mo | $204,900 | $152 | 69 |
| 1953 Glenwick Dr | 0.51mi | 3/2.0 | 1,367 (-4%) | 6mo | $230,000 | $168 | 66 |
| 4823 Old Field Rd | 0.51mi | 3/2.0 | 1,473 (+4%) | 5mo | $215,000 | $146 | 65 |
| 4604 Sterling St | 0.45mi | 3/2.0 | 1,292 (-9%) | 4mo | $207,500 | $161 | 61 |
| 4737 Dominion Rd | 0.44mi | 3/2.0 | 1,552 (+10%) | 7mo | $150,000 | $97 | 58 |
| 2175 Quailridge Dr | 0.31mi | 3/2.0 | 1,208 (-15%) | 5mo | $189,800 | $157 | 57 |
| 4627 Cheltenham Rd | 0.58mi | 4/2.5 (+1) | 1,568 (+11%) | 0mo | $228,000 | $145 | 48 |
| 2205 Stornoway Ct | 0.70mi | 3/2.0 | 1,536 (+8%) | 6mo | $255,000 | $166 | 48 |
| 1933 Saint Paul Ave | 0.71mi | 4/2.0 (+1) | 1,610 (+14%) | 6mo | $130,000 | $81 | 34 |
Match score weights: distance 35% · size 25% · config 20% · recency 20%. Top-matched comps best support the ARV.
Projected returns pro-forma
-3.0% appreciation · 3.17% rent growth · sell at horizon
- IRR
- -17.4%
- Equity multiple
- 0.39×
- Total profit
- $-33,534
- Equity at exit
- $29,075
- IRR
- -9.1%
- Equity multiple
- 0.43×
- Total profit
- $-30,933
- Equity at exit
- $16,860
Cash invested: $54,600 (down + closing). Projections, not guarantees.
Landlord ↔ Tenant lean methodology
- Overall (STATE)
- 85 Strongly Landlord-Friendly
- State North Carolina
- 85 Strongly Landlord-Friendly · R+3
- County
- — inherits STATE
- City
- — inherits STATE
ZIP-level market 28304
- Home prices YoY
- -21.7%
- Rents YoY
- 3.2%
- Active inventory
- 308
- Price-to-rent
- 10.2×
Monthly cashflow live
- Estimated rent
- $1,600 high interval (Pro) →
- Mortgage (P&I)
- −$1,023
- Tax from tax record
- −$195 /mo · $2,341/yr
- Insurance
- −$81
- HOA
- −$0
- Vacancy / Maint / Mgmt
- −$336
- Net cashflow
- $-35
Break-even live
Sensitivity live
| Price | -10% $76 | -5% $21 | +0% $-35 | +5% $-90 | +10% $-145 |
|---|---|---|---|---|---|
| Rent | -10% $-161 | -5% $-98 | +0% $-35 | +5% $29 | +10% $92 |
| Rate | -1.0pp $64 | -0.5pp $15 | base $-35 | +0.5pp $-85 | +1.0pp $-137 |
UW: 25.0% down · 7.5% · 30yr · 1.5% tax · 5.0% vac · 8.0% maint · 8.0% mgmt
Financing live
Cash to close
- Down payment
- $48,750
- Closing costs
- $5,850
- Reserves months
- —
- Total cash needed
- —
Loan-product check · same deal, 3 products live
Conventional
25% down · 7.5% · 30yr
- Down + closing
- —
- Monthly P&I
- —
- Monthly cashflow
- —
- DSCR
- —
- Eligible?
- —
Personal DTI + credit; lowest rate.
DSCR
20% down · 8.5% · 30yr
- Down + closing
- —
- Monthly P&I
- —
- Monthly cashflow
- —
- DSCR
- —
- Eligible?
- —
No personal income docs; deal must DSCR.
Hard money
10% down · 12.0% · 12mo
- Down + closing
- —
- Monthly P&I
- —
- Monthly cashflow
- —
- DSCR
- —
- Eligible?
- —
Short-term bridge; refi at stabilization.
Rent comps 28 comps
| Address | Beds | Baths | Sqft | Rent | $/sqft | DOM | Units | Dist |
|---|---|---|---|---|---|---|---|---|
| 4630 Canterbury Rd Fayetteville, NC | 3.0 | 2.0 | 1250 | $1,350 | $1.08 | 25d | 1 | 0.22mi |
| 5032 Shimmer Dr Fayetteville, NC | 4.0 | 2.0 | 1473 | $1,700 | $1.15 | 15d | 1 | 0.27mi |
| 5032 Shimmer Dr Fayetteville, NC | 4.0 | 2.0 | 1473 | $1,750 | $1.19 | 25d | 1 | 0.27mi |
| 1819 Cawdor Dr Fayetteville, NC | 3.0 | 2.5 | 1572 | $1,600 | $1.02 | 15d | 1 | 0.65mi |
| 2524 Penny Dr Fayetteville, NC | 3.0 | 2.0 | 1330 | $1,400 | $1.05 | 25d | 1 | 0.71mi |
| 5532 Robmont Dr Fayetteville, NC | 2.0 | 2.0 | 1301 | $1,800 | $1.38 | 15d | 1 | 0.86mi |
| 2207 Puffin Pl Fayetteville, NC | 3.0 | 2.0 | 1214 | $1,950 | $1.61 | 15d | 1 | 0.94mi |
| 2579 Gotts Ln Fayetteville, NC | 2.0 | 2.0 | 1200 | $1,295 | $1.08 | 23d | 1 | 0.97mi |
| 5151 Queensdale Dr Fayetteville, NC | 3.0 | 2.0 | 1107 | $1,295 | $1.17 | 15d | 1 | 0.97mi |
| 5151 Queensdale Dr Fayetteville, NC | 3.0 | 2.0 | 1107 | $1,295 | $1.17 | 25d | 1 | 0.97mi |
| 2517 Forest Lodge Dr Fayetteville, NC | 3.0 | 2.0 | 1670 | $1,800 | $1.08 | 25d | 1 | 1.03mi |
| 2690 Belhaven Rd Fayetteville, NC | 3.0 | 1.0 | 1264 | $1,350 | $1.07 | 25d | 1 | 1.06mi |
| 3918 Donna St Fayetteville, NC | 3.0 | 1.0 | 1000 | $1,350 | $1.35 | 25d | 1 | 1.09mi |
| 4101 Coventry Rd Fayetteville, NC | 3.0 | 1.0 | 1132 | $1,150 | $1.02 | 15d | 1 | 1.11mi |
| 1805 Wayne Ln Fayetteville, NC | 3.0 | 1.0 | 975 | $2,400 | $2.46 | 25d | 1 | 1.14mi |
| 3038 Walesby Dr Fayetteville, NC | 3.0 | 2.0 | 1272 | $1,650 | $1.30 | 25d | 1 | 1.19mi |
| 5629 Thackeray Dr Fayetteville, NC | 3.0 | 2.0 | 1536 | $1,725 | $1.12 | 25d | 1 | 1.19mi |
| 1209 Snowy Egret Dr Fayetteville, NC | 3.0 | 2.5 | 1470 | $1,800 | $1.22 | 25d | 1 | 1.22mi |
| 2219 Gray Goose Loop Fayetteville, NC | 3.0 | 2.5 | 1799 | $1,900 | $1.06 | 23d | 1 | 1.28mi |
| 5632 Birch Rd Fayetteville, NC | 3.0 | 1.0 | 1228 | $1,250 | $1.02 | 25d | 1 | 1.30mi |
| 3325 Boone Trl Fayetteville, NC | 4.0 | 2.0 | 1494 | $1,960 | $1.31 | 15d | 1 | 1.33mi |
| 5721 Randleman St Fayetteville, NC | 3.0 | 2.0 | 1050 | $1,575 | $1.50 | 25d | 1 | 1.40mi |
| 909 Sandalwood Dr Fayetteville, NC | 3.0 | 1.0 | 1346 | $1,595 | $1.18 | 25d | 1 | 1.44mi |
| 5744 Randleman St Fayetteville, NC | 3.0 | 2.0 | 1171 | $1,395 | $1.19 | 25d | 1 | 1.46mi |
| 821 Sandalwood Dr Fayetteville, NC | 3.0 | 1.0 | 1204 | $1,200 | $1.00 | 15d | 1 | 1.46mi |
| 3526 Furman Dr Fayetteville, NC | 3.0 | 1.5 | 1050 | $1,500 | $1.43 | 25d | 1 | 1.46mi |
| 910 Miller Ave Unit 910 Fayetteville, NC | 2.0 | 2.0 | 1000 | $1,250 | $1.25 | 25d | 1 | 1.47mi |
| 5595 Quietwood Pl Fayetteville, NC | 3.0 | 2.0 | 1288 | $1,395 | $1.08 | 25d | 1 | 1.48mi |
Listing history 13 events
-
2026-06-21days on market $195,000 Active 11 DOM
-
2026-06-18days on market $195,000 Active 8 DOM
-
2026-06-17days on market $195,000 Active 7 DOM
-
2026-06-16days on market $195,000 Active 6 DOM
-
2026-06-15days on market $195,000 Active 5 DOM
-
2026-06-14days on market $195,000 Active 3 DOM
-
2026-06-13statusdays on market $195,000 Active 2 DOM
-
2026-06-10days on market $195,000 Coming Soon 8 DOM
-
2026-06-09days on market $195,000 Coming Soon 7 DOM
-
2026-06-08days on market $195,000 Coming Soon 6 DOM
-
2026-06-07days on market $195,000 Coming Soon 5 DOM
-
2026-06-03remarks 583-char remark
-
2026-06-03$195,000 Coming Soon 1 DOM
ⓘ Source: listings_history table (triggers on properties + properties_extension) + one-shot
backfill from property_details.listing_events for pre-trigger history.
Tax reassessment forecast NC · Resets to sale price
- Current annual tax
- $2,341 · $195/mo
- Projected year-2 tax
- $2,341 · $195/mo
- Expected delta
- $0/yr ($0/mo · 0.0%)
ⓘ Screening estimate from a state-policy table — verify with the county assessor before closing.
Climate risk First Street
- Flood 1/10 Low FEMA zone X (unshaded) · 0% chance over 30 yrs
- Wildfire 5/10 Major
- Heat 7/10 Severe 7 d/yr ≥106°F today · 16 d/yr by 30 yrs out
- Wind 6/10 Major 74% chance of damaging wind over 30 yrs
- Air quality 1/10 Low 0 unhealthy d/yr today · 0 by 30 yrs out
Nearby sold comps map
Loading sold comps map…
Walkable amenities ~0.75 mi
Loading nearby amenities…
Taxation est. · year 1
- Rental income
- $19,206
- − Mortgage interest
- −$10,923
- − Property taxes
- −$2,341
- − Insurance
- −$975
- − Repairs & maintenance
- −$1,536
- − Management
- −$1,536
- − Depreciation
- −$5,673
- Taxable loss
- −$3,780
- Est. tax savings @ 24.0%
- +$907
- After-tax cash flow
- $492/yr
For passive investors: Depreciation is non-cash, so a rental often shows a tax loss while cash-flowing — sheltering income. Rental losses are passive: they offset passive income freely, and up to $25,000/yr can offset ordinary (W-2) income if you actively participate and your MAGI is under $100k (phasing out to $0 by $150k); unused losses carry forward. On sale, claimed depreciation is recaptured at up to 25%, and gains may owe capital-gains tax (a 1031 exchange can defer both). Figures are a year-1 estimate at your 24.0% rate — not tax advice; consult a CPA.
Schools (NCES district)
- District
- Cumberland County Schools
- NCES district ID
- 3700011
- Math proficiency
- 32% ▼ -2.00%
- Reading proficiency
- 41% ▼ -1.00%
- Median HH income
- $44,168
- Composite
- 31.0/100
- National rank
- #6096
- State rank
- #126 of 178 in NC
Livability — Fayetteville
- Score
- 75/100
- State rank
- #45
- US rank
- #4031
Category grades
Schools grade is shown separately in the Schools card above.
Census & demographics
- Census place
- Fayetteville, NC
- County
- Cumberland County · 265,314 people
- City population
- 226,118
- Metro
- Fayetteville, NC
- Population (ZIP)
- 37,140
- Household income
- $58,563
- Rent vs Own
- Severe rent burden
- 1667.0
Population outlook (Cumberland County) Hauer SSP2
- Today (2025)
- 330,855 people
- By 2030
- 333,523 · +0.8%
- By 2040
- 335,583 · +1.4%
- By 2050
- 335,325 · +1.4%
- By 2075
- 342,853 · +3.6%
- By 2100
- 340,698 · +3.0%
Race, ethnicity, and origin ACS 2023
- Neighborhood character
- Highly diverse neighborhood (Simpson 0.70)
- Race & ethnicity
- Black 39% White 36% Hispanic / Latino 14% Two or more races 12% Asian 3% Native American 1%
- Hispanic origin (detail)
- Mexican 5% Puerto Rican 5%
- Common ancestry
- Slovak 2% Italian 1% Serbian 1%
- Foreign-born
- 8% · Canada, South Korea, Vietnam
- Languages at home
- 87% English-only · Spanish 9% Tagalog/Filipino 1% French/Haitian/Cajun 1%
Political lean MEDSL · Cumberland
- 2024 margin
- D (+13.4) · D 56.1% · R 42.7% · Other 1.2%
- 2008→2024 swing
- -4.3pp toward R · 2008: 17.7pp · 2024: 13.4pp
- All cycles
- 2024: D+13.4 2020: D+16.6 2016: D+16.0 2012: D+19.7 2008: D+17.7
Not yet ingested
- Civics
- —
Market trends
- HPI YoY
- ▼ -59.90%
- Current HPI
- 215.927
- Rent YoY
- ▲ 3.17%
- Metro
- Fayetteville, NC
- State GDP YoY
- ▲ 3.28%
- F500 in state
- 26
Industry mix (Fortune 500 HQ in NC)
| Industry | F500 HQs | Revenue |
|---|---|---|
| Financial Services | 2 | $213B |
|
||
| Retail | 2 | $95B |
|
||
| Industrial Conglomerate | 1 | $38B |
|
||
| Metals / Steel | 1 | $35B |
|
||
| Utilities | 1 | $30B |
|
||
| Industrial Machinery | 1 | $19B |
|
||
Price history
+202.3% since first listed10 events — show timeline
- 2026-06-02 Coming Soon $195,000 LPRMLS
- 2025-02-23 Rental Removed $1,450 BUILDIUM
- 2025-02-04 Price Changed $1,450 BUILDIUM
- 2024-12-06 Price Changed $1,495 BUILDIUM
- 2024-11-05 Listed for Rent $1,550 BUILDIUM
- 2022-11-10 Sold (Public Records) $82,500 Public Records
- 2014-10-02 Sold (Public Records) $87,000 Public Records
- 2014-09-30 Sold (MLS) $87,000 LPRMLS
- 2014-08-11 Listed $87,500 LPRMLS
- 1992-02-12 Sold (Public Records) $64,500 Public Records
Property tax history
+5.8%/yrLatest (2025): $2,341 · +43.9% YoY. Source: county tax records.
Cash-flow waterfall
monthlySold comps — $/sqft
last 12 mo · ≤1 miLoading sold comps…