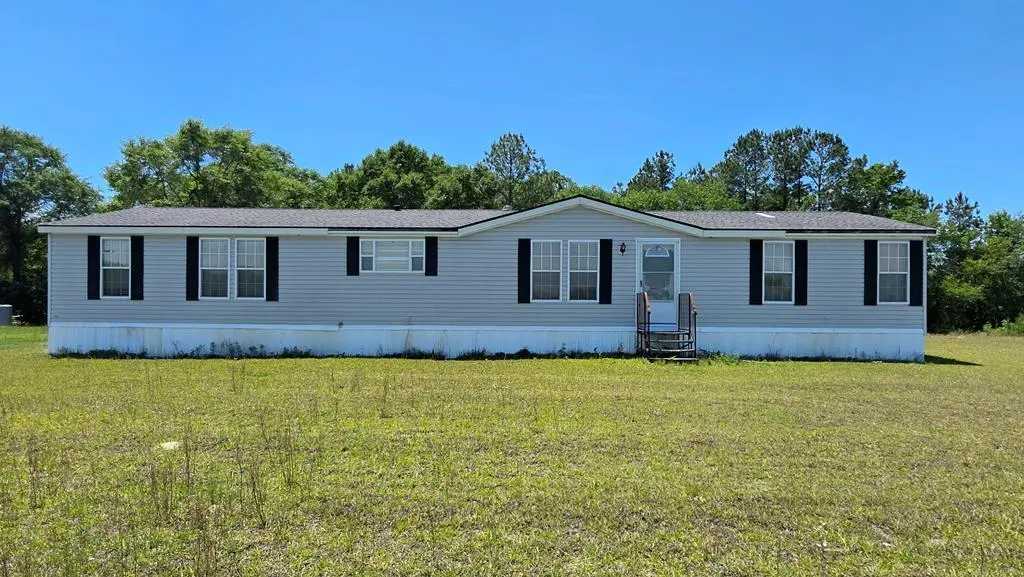
173 Salem Church Rd · Fitzgerald, GA
Flood risk 1/10 · Minimal
- FEMA flood zone
- X (unshaded)
- Chance of flooding over 30 yrs
- 0.0%
- Est. flood insurance / yr
- $507 – $1,088
Fire risk 5/10 · Moderate
- Est. fire insurance / yr
- $963 – $1,789
Heat risk 7/10 · Major
- Hot days now (above 108°F)
- 7 days/yr
- Hot days in 30 yrs
- 19 days/yr
Wind risk 8/10 · Major
- Chance of severe wind over 30 yrs
- 80.0%
Air-quality risk 3/10 · Minor
- Unhealthy air days now
- 3 days/yr
- Unhealthy air days in 30 yrs
- 3 days/yr
Risk factors via First Street. Map © Google.
Why this score? — see what drove the B- grade
The composite is a weighted blend of 9 inputs, each scored 0–100. Each bar is that input's sub-score; the figure is the points it added to the 100-point composite (weight × sub-score).
- Cash flow +30.0/30.0
- 1% rule +10.0/10.0
- DSCR +10.0/10.0
- ARV discount +7.5/15.0
- Livability +2.8/5.0
- Rent growth +2.5/5.0
- Condition / age +2.5/5.0
- Schools +1.6/10.0
- Appreciation +0.0/10.0
$67,500
🖨 Deal sheet (PDF) 📄 Offer letter ✓ Due diligence
Listing remarks
HOME MUST BE MOVED. This 4 bedroom 2 bathroom home is spacious and ready for its new location and homeowner to make it the affordable place of their own. The home has a split floor plan with space for everyone. The master suite is grand with its own private retreat/relaxing area along with an oversized walk-in closet. If you are in the market for a large home to put on your land, this one is worth noting and seeing in person! Set up your appointment and start envisioning your dreams and what your home sweet home could transform to look like!
Key facts
- Built 2002
- Listed 33 days
Property features AI
Exterior
- Parking: Attached parking
- Home design: Residential mobile home
- Construction: Vinyl siding; Shingle roof
- Exterior features: Porch
Interior
- Kitchen: Dishwasher; Electric cooktop; Microwave; Refrigerator
- Flooring: Laminate
- Bathrooms: 2 full bathrooms
- Heating & cooling: Ceiling fans
- Interior features: Pantry; Window coverings; Wood-burning fireplace
- Laundry & utility: Electric water heater
Neighborhood map
What this means for you Summary
Snapshot
- This is a 4-bed/2.0-bath other listed at $68k.
Deal economics
- At list price, monthly cash flow is $562 ($7k/yr) — positive.
- The deal already cash-flows at list — no discount required.
- Meets the 1% rule at list price ($1k rent vs $68k).
- Recommended offer: $65k (3.0% below list) — sets the bar for market timing.
- Cap rate 16.3% vs local median 5.0% in Fitzgerald — top-decile yield for the area; either an underpriced asset or a hidden risk that comps aren't pricing in. Stress-test before assuming the spread holds.
Location & tenants
- Location reads 55/100 on livability (#513 in GA) — a working-class tenant base; expect higher turnover. Strengths: cost of living A+, housing B+; Watch: health & safety C-, crime F, amenities F.
- Ben Hill County (rural): math 19% / reading 22% proficiency, ranked #145 of 174 in GA (top 83%) — low school quality limits family demand, transient renter base, plan for 1-2y turnover; 72% free/reduced lunch — lower-income household profile, screen leases tightly.
- Zoned schools: Ben Hill County Primary School (864 students, 89% FRL); Ben Hill County Middle School (math 15% / reading 24%, grade F, #356 of 470 statewide, top 78%, 687 students, 89% FRL); Fitzgerald High School School College And Career Academy (math 20% / reading 12%, grade F, #287 of 424 statewide, top 68%, 861 students, 65% FRL).
- Market conditions: 124 active listings in the ZIP; 6 units permitted in Ben Hill County in 2024 (0 in 5+ unit buildings).
Forward outlook
- Local home prices are declining (-3.0%/yr); year-one equity from $467 of loan paydown is wiped out by about $2k of value loss. Plan a longer hold.
- Ben Hill County population projected at -19% by 2050 — secular population decline; favor cash flow + early exit over multi-decade hold.
- At projected returns (-3.0% appreciation + 3.0% rent growth), your $19k cash investment doubles in ~4 years — after that, you're playing with house money.
Negotiation context
- It's been on market 33 days — a 3% lower offer ($65k) is reasonable based on typical stale-listing flexibility.
Risks & watch-outs
- Climate carrying-cost: severe wind risk, 80% chance of damaging wind over 30y; moderate wildfire risk; extreme-heat days projected 7→19/yr by 2055 (HVAC capex compounding) — expect insurance premiums to compound above CPI over the hold.
Questions for the listing agent
- It's been on market 33 days. Have you received any prior offers? Is the seller open to a 3% concession, seller financing, or rate buy-down credit?
- Is there a deadline driving the sale (1031 exchange, divorce, estate, relocation)? That informs how much negotiation room exists.
- Schools are F-rated, which usually means shorter tenancies and higher turnover. Who's the typical renter profile here, and what's been the actual vacancy rate?
- Crime grade is F in this area — have there been break-ins, vandalism, or insurance claims at this property in the last 3 years? What carrier currently insures it and at what premium?
- What's the average days-on-market for RENTAL listings here right now (not sales)? A rising rental-DOM trend means longer vacancies and softer asking-rent achievability than the comps imply.
- What's the recent tenant-quality profile in this submarket — average credit score on applications, eviction rate, late-payment / NSF rate, and stable-employment percentage? A property-management company in the area should have these aggregated.
- How much new for-sale + rental construction is in the pipeline within 1–3 miles? Heavy new supply typically softens prices + rents 12–24 months out; constrained supply supports both.
Investment metrics
- 1% rule
- 1.80% ✓
- Cap rate
- 16.29%
- Cash-on-cash
- 35.70%
- DSCR
- 2.59
- GRM
- 4.6
CMA / ARV
No comps found within radius.
Projected returns pro-forma
-3.0% appreciation · 3.0% rent growth · sell at horizon
- IRR
- 31.3%
- Equity multiple
- 2.31×
- Total profit
- $24,846
- Equity at exit
- $10,064
- IRR
- 38.5%
- Equity multiple
- 4.58×
- Total profit
- $67,649
- Equity at exit
- $5,836
Cash invested: $18,900 (down + closing). Projections, not guarantees.
Landlord ↔ Tenant lean methodology
- Overall (STATE)
- 90 Strongly Landlord-Friendly
- State Georgia
- 90 Strongly Landlord-Friendly · R+3
- County
- — inherits STATE
- City
- — inherits STATE
ZIP-level market 31750
- Home prices YoY
- -8.0%
- Active inventory
- 124
- Price-to-rent
- 4.6×
Monthly cashflow live
- Estimated rent
- $1,217 medium interval (Pro) →
- Mortgage (P&I)
- −$354
- Tax from tax record
- −$17 /mo · $202/yr
- Insurance
- −$28
- HOA
- −$0
- Vacancy / Maint / Mgmt
- −$255
- Net cashflow
- $562
Break-even live
Sensitivity live
| Price | -10% $600 | -5% $581 | +0% $562 | +5% $543 | +10% $524 |
|---|---|---|---|---|---|
| Rent | -10% $466 | -5% $514 | +0% $562 | +5% $610 | +10% $658 |
| Rate | -1.0pp $596 | -0.5pp $579 | base $562 | +0.5pp $545 | +1.0pp $527 |
UW: 25.0% down · 7.5% · 30yr · 1.5% tax · 5.0% vac · 8.0% maint · 8.0% mgmt
Financing live
Cash to close
- Down payment
- $16,875
- Closing costs
- $2,025
- Reserves months
- —
- Total cash needed
- —
Loan-product check · same deal, 3 products live
Conventional
25% down · 7.5% · 30yr
- Down + closing
- —
- Monthly P&I
- —
- Monthly cashflow
- —
- DSCR
- —
- Eligible?
- —
Personal DTI + credit; lowest rate.
DSCR
20% down · 8.5% · 30yr
- Down + closing
- —
- Monthly P&I
- —
- Monthly cashflow
- —
- DSCR
- —
- Eligible?
- —
No personal income docs; deal must DSCR.
Hard money
10% down · 12.0% · 12mo
- Down + closing
- —
- Monthly P&I
- —
- Monthly cashflow
- —
- DSCR
- —
- Eligible?
- —
Short-term bridge; refi at stabilization.
Listing history 18 events
-
2026-06-21days on market $67,500 Active 33 DOM
-
2026-06-21days on market $67,500 Active 32 DOM
-
2026-06-18days on market $67,500 Active 30 DOM
-
2026-06-17days on market $67,500 Active 29 DOM
-
2026-06-16days on market $67,500 Active 28 DOM
-
2026-06-15days on market $67,500 Active 27 DOM
-
2026-06-13days on market $67,500 Active 25 DOM
-
2026-06-12days on market $67,500 Active 24 DOM
-
2026-06-09days on market $67,500 Active 21 DOM
-
2026-06-08days on market $67,500 Active 20 DOM
-
2026-06-07days on market $67,500 Active 19 DOM
-
2026-06-07days on market $67,500 Active 18 DOM
-
2026-06-04days on market $67,500 Active 15 DOM
-
2026-06-02days on market $67,500 Active 14 DOM
-
2026-06-01days on market $67,500 Active 13 DOM
-
2026-05-31days on market $67,500 Active 12 DOM
-
2026-05-31days on market $67,500 Active 11 DOM
-
2026-05-19$67,500 Active
ⓘ Source: listings_history table (triggers on properties + properties_extension) + one-shot
backfill from property_details.listing_events for pre-trigger history.
Tax reassessment forecast GA · Resets to sale price
- Current annual tax
- $202 · $17/mo
- Projected year-2 tax
- $621 · $52/mo
- Expected delta
- +$419/yr (+$35/mo · 207.0%)
ⓘ Screening estimate from a state-policy table — verify with the county assessor before closing.
Climate risk First Street
- Flood 1/10 Low FEMA zone X (unshaded) · 0% chance over 30 yrs
- Wildfire 5/10 Major
- Heat 7/10 Severe 7 d/yr ≥108°F today · 19 d/yr by 30 yrs out
- Wind 8/10 Severe 80% chance of damaging wind over 30 yrs
- Air quality 3/10 Moderate 3 unhealthy d/yr today · 3 by 30 yrs out
Nearby sold comps map
Loading sold comps map…
Walkable amenities ~0.75 mi
Loading nearby amenities…
Taxation est. · year 1
- Rental income
- $14,600
- − Mortgage interest
- −$3,781
- − Property taxes
- −$202
- − Insurance
- −$338
- − Repairs & maintenance
- −$1,168
- − Management
- −$1,168
- − Depreciation
- −$1,964
- Taxable income
- $5,979
- Est. tax owed @ 24.0%
- −$1,435
- After-tax cash flow
- $5,311/yr
For passive investors: Depreciation is non-cash, so a rental often shows a tax loss while cash-flowing — sheltering income. Rental losses are passive: they offset passive income freely, and up to $25,000/yr can offset ordinary (W-2) income if you actively participate and your MAGI is under $100k (phasing out to $0 by $150k); unused losses carry forward. On sale, claimed depreciation is recaptured at up to 25%, and gains may owe capital-gains tax (a 1031 exchange can defer both). Figures are a year-1 estimate at your 24.0% rate — not tax advice; consult a CPA.
Schools (NCES district)
- District
- Ben Hill County
- NCES district ID
- 1300360
- Math proficiency
- 19% ▼ -6.00%
- Reading proficiency
- 22% ▼ -2.00%
- Median HH income
- $30,617
- Composite
- 16.47/100
- National rank
- #9186
- State rank
- #145 of 174 in GA
Livability — Fitzgerald
- Score
- 55/100
- State rank
- #513
- US rank
- #23277
Category grades
Schools grade is shown separately in the Schools card above.
Census & demographics
- Population (ZIP)
- 18,582
Population outlook (Ben Hill County) Hauer SSP2
- Today (2025)
- 16,426 people
- By 2030
- 15,788 · -3.9%
- By 2040
- 14,582 · -11.2%
- By 2050
- 13,351 · -18.7%
- By 2075
- 10,301 · -37.3%
- By 2100
- 7,652 · -53.4%
Race, ethnicity, and origin ACS 2023
- Neighborhood character
- Diverse neighborhood (Simpson 0.57)
- Race & ethnicity
- White 54% Black 35% Hispanic / Latino 9% Two or more races 2%
- Hispanic origin (detail)
- Mexican 7%
- Common ancestry
- Slovak 1% Italian 1% Lithuanian 1%
- Foreign-born
- 3% · Canada
- Languages at home
- 91% English-only · Spanish 8% Other Indo-European 1%
Political lean MEDSL · Ben Hill
- 2024 margin
- Solid R (+32.0) · D 33.8% · R 65.8%
- 2008→2024 swing
- -18.3pp toward R · 2008: -13.7pp · 2024: -32.0pp
- All cycles
- 2024: R+32.0 2020: R+26.2 2016: R+27.6 2012: R+14.9 2008: R+13.7
Not yet ingested
- Civics
- —
Market trends
- HPI YoY
- ▼ -17.36%
- Current HPI
- 200.1257
- Rent YoY
- —
- Metro
- —
- State GDP YoY
- ▲ 2.66%
- F500 in state
- 28
Industry mix (Fortune 500 HQ in GA)
| Industry | F500 HQs | Revenue |
|---|---|---|
| Paper / Packaging | 2 | $29B |
|
||
| Retail | 1 | $160B |
|
||
| Transportation / Logistics | 1 | $91B |
|
||
| Airlines | 1 | $62B |
|
||
| Consumer Goods | 1 | $47B |
|
||
| Utilities | 1 | $25B |
|
||
Price history
1 event — show timeline
- 2026-05-19 Listed $67,500 TBOR
Property tax history
-7.0%/yrLatest (2025): $202 · +26.7% YoY. Source: county tax records.
Cash-flow waterfall
monthlySold comps — $/sqft
last 12 mo · ≤1 miLoading sold comps…