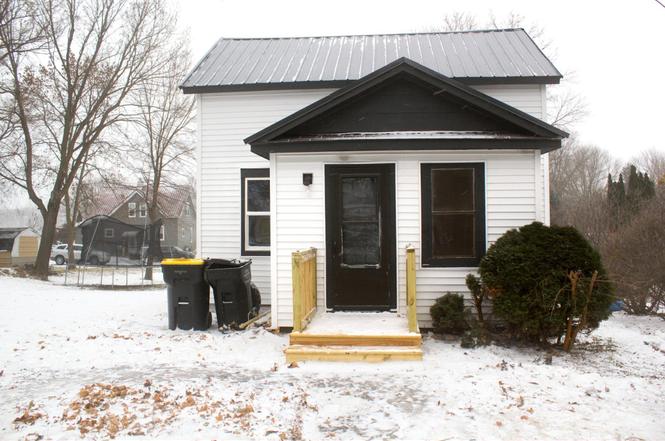
113 1st St SW · Fairfax, MN
Flood risk 1/10 · Minimal
- FEMA flood zone
- X (unshaded)
- Chance of flooding over 30 yrs
- 0.0%
- Est. flood insurance / yr
- $473 – $860
Fire risk 1/10 · Minimal
- Est. fire insurance / yr
- $888 – $1,650
Heat risk 2/10 · Minimal
- Hot days now (above 99°F)
- 7 days/yr
- Hot days in 30 yrs
- 15 days/yr
Wind risk 2/10 · Minimal
- Chance of severe wind over 30 yrs
- —
Air-quality risk 1/10 · Minimal
- Unhealthy air days now
- 0 days/yr
- Unhealthy air days in 30 yrs
- 0 days/yr
Risk factors via First Street. Map © Google.
Why this score? — see what drove the B- grade
The composite is a weighted blend of 9 inputs, each scored 0–100. Each bar is that input's sub-score; the figure is the points it added to the 100-point composite (weight × sub-score).
- Cash flow +23.4/30.0
- Appreciation +10.0/10.0
- DSCR +7.5/10.0
- ARV discount +7.5/15.0
- 1% rule +5.2/10.0
- Schools +3.8/10.0
- Livability +3.7/5.0
- Rent growth +2.5/5.0
- Condition / age +2.5/5.0
$79,900
🖨 Deal sheet (PDF) 📄 Offer letter ✓ Due diligence
Listing remarks MLS
Great investment home, or first home. This fully furnished home has 2-3 bedrooms, spacious full bath, updated kitchen. Central Air. This home sits on a large lot with so much potential to add on or add a patio and or a garage. Call today to schedule a showing, before this one gets away!!
Key facts
- 8,363 sq ft lot
- Built 1905
- Listed 170 days
Property features AI
Exterior
- Parking: On-street parking only
- Utilities: City water connected; City sewer connected; Natural gas
- Home design: Residential property; One and one-half story; Entry level: main
- Construction: Block foundation; Asphalt roof (age 8 years or less)
- Exterior features: Vinyl exterior; Irregular lot with approximately 50 x 140 dimensions; City street frontage
Interior
- Kitchen: Range; Microwave; Refrigerator; Eat-in layout
- Bedrooms: 2 bedrooms (one on main level, one on upper level); Upper-level bonus room
- Bathrooms: 1 full bathroom on main level
- Heating & cooling: Forced air heating; Central air conditioning
- Interior features: Eat-in kitchen; Partial basement
- Laundry & utility: Washer and dryer; Washer/Dryer hookup; Laundry located in basement
Neighborhood map
What this means for you Summary
Snapshot
- This is a 2-bed/1.0-bath single-family listed at $80k.
Deal economics
- At list price, monthly cash flow is $147 ($2k/yr) — positive.
- The deal already cash-flows at list — no discount required.
- Meets the 1% rule at list price ($811 rent vs $80k).
- Recommended offer: $70k (12.0% below list) — sets the bar for market timing.
Location & tenants
- Location reads 73/100 on livability (#261 in MN) — a middle-class / working-renter tenant base. Strengths: crime A+, cost of living A+, housing A+; Watch: health & safety D+, amenities F, commute F.
- G.F.W. (rural): math 40% / reading 48% proficiency, ranked #186 of 301 in MN (top 62%) — families likely to look elsewhere, expect single-tenant / working-renter base with shorter leases.
- Zoned schools: Gfw Elementary School (math 52% / reading 47%, grade D, #423 of 857 statewide, top 55%, 199 students, 63% FRL); Gfw Middle School (187 students, 59% FRL); Gfw High School (math 32% / reading 47%, grade F, #246 of 471 statewide, top 59%, 214 students, 43% FRL) — zoned schools average 55% FRL vs 32% district-wide (23 pts higher); higher-poverty schools than district average — tighter screening recommended.
- Market conditions: 13 active listings in the ZIP; 1 comparable units currently listed for rent nearby; 17 units permitted in Renville County in 2024 (0 in 5+ unit buildings).
Forward outlook
- In year one you build about $9k of equity ($552 loan paydown + $8k appreciation (10.0% local appreciation)).
- Renville County population projected at -28% by 2050 — secular population decline; favor cash flow + early exit over multi-decade hold.
- At projected returns (10.0% appreciation + 3.0% rent growth), your $22k cash investment doubles in ~3 years — after that, you're playing with house money.
- By year 4, paydown + projected appreciation supports a ~$30k cash-out refi (75% LTV) — recoverable capital for the next deal without selling this one.
Negotiation context
- It's been on market 171 days — a 12% lower offer ($70k) is reasonable based on typical stale-listing flexibility.
- 4 sale attempts since 18y ago; this cycle's ask has dropped $30k (27%) from the opening price — seller is motivated, your offer sets the floor, not the list.
- Current owner paid $37k; list at $80k implies a 116% gain — meaningful room to come down on a strong offer.
Risks & watch-outs
- Watch-outs: built in 1905 — expect roof / HVAC / electrical / plumbing capex.
Questions for the listing agent
- It's been on market 171 days. Have you received any prior offers? Is the seller open to a 12% concession, seller financing, or rate buy-down credit?
- Built in 1905 — when were the roof, HVAC, electrical panel, plumbing, and water heater last replaced?
- Why hasn't it sold? Are there any deal-killer items the seller is aware of (foundation, flood, title, zoning, code violations)?
- Is there a deadline driving the sale (1031 exchange, divorce, estate, relocation)? That informs how much negotiation room exists.
- What's the average days-on-market for RENTAL listings here right now (not sales)? A rising rental-DOM trend means longer vacancies and softer asking-rent achievability than the comps imply.
- What's the recent tenant-quality profile in this submarket — average credit score on applications, eviction rate, late-payment / NSF rate, and stable-employment percentage? A property-management company in the area should have these aggregated.
- How much new for-sale + rental construction is in the pipeline within 1–3 miles? Heavy new supply typically softens prices + rents 12–24 months out; constrained supply supports both.
Investment metrics
- 1% rule
- 1.02% ✓
- Cap rate
- 8.50%
- Cash-on-cash
- 7.89%
- DSCR
- 1.35
- GRM
- 8.2
CMA / ARV
No comps found within radius.
Projected returns pro-forma
10.0% appreciation · 3.0% rent growth · sell at horizon
- IRR
- 30.0%
- Equity multiple
- 3.36×
- Total profit
- $52,858
- Equity at exit
- $71,980
- IRR
- 26.0%
- Equity multiple
- 7.63×
- Total profit
- $148,246
- Equity at exit
- $155,228
Cash invested: $22,372 (down + closing). Projections, not guarantees.
Landlord ↔ Tenant lean methodology
- Overall (STATE)
- 46 Balanced
- State Minnesota
- 46 Balanced · D+2
- County
- — inherits STATE
- City
- — inherits STATE
ZIP-level market 55332
- Home prices YoY
- 5.2%
- Active inventory
- 13
- Price-to-rent
- 8.2×
Monthly cashflow live
- Estimated rent
- $811 medium interval (Pro) →
- Mortgage (P&I)
- −$419
- Tax from tax record
- −$41 /mo · $496/yr
- Insurance
- −$33
- HOA
- −$0
- Vacancy / Maint / Mgmt
- −$170
- Net cashflow
- $147
Break-even live
Sensitivity live
| Price | -10% $192 | -5% $170 | +0% $147 | +5% $124 | +10% $102 |
|---|---|---|---|---|---|
| Rent | -10% $83 | -5% $115 | +0% $147 | +5% $179 | +10% $211 |
| Rate | -1.0pp $187 | -0.5pp $167 | base $147 | +0.5pp $126 | +1.0pp $105 |
UW: 25.0% down · 7.5% · 30yr · 1.5% tax · 5.0% vac · 8.0% maint · 8.0% mgmt
Financing live
Cash to close
- Down payment
- $19,975
- Closing costs
- $2,397
- Reserves months
- —
- Total cash needed
- —
Loan-product check · same deal, 3 products live
Conventional
25% down · 7.5% · 30yr
- Down + closing
- —
- Monthly P&I
- —
- Monthly cashflow
- —
- DSCR
- —
- Eligible?
- —
Personal DTI + credit; lowest rate.
DSCR
20% down · 8.5% · 30yr
- Down + closing
- —
- Monthly P&I
- —
- Monthly cashflow
- —
- DSCR
- —
- Eligible?
- —
No personal income docs; deal must DSCR.
Hard money
10% down · 12.0% · 12mo
- Down + closing
- —
- Monthly P&I
- —
- Monthly cashflow
- —
- DSCR
- —
- Eligible?
- —
Short-term bridge; refi at stabilization.
Rent comps 1 comps
| Address | Beds | Baths | Sqft | Rent | $/sqft | DOM | Units | Dist |
|---|---|---|---|---|---|---|---|---|
| 11 Park St N Fairfax, MN | 2.0 | 1.0 | 700 | $811 | $1.16 | 45d | 1 | 0.18mi |
Listing history 30 events
-
2026-06-21days on market $79,900 Active 171 DOM
-
2026-06-21days on market $79,900 Active 170 DOM
-
2026-06-18days on market $79,900 Active 168 DOM
-
2026-06-17days on market $79,900 Active 167 DOM
-
2026-06-16days on market $79,900 Active 166 DOM
-
2026-06-15days on market $79,900 Active 165 DOM
-
2026-06-13days on market $79,900 Active 163 DOM
-
2026-06-12days on market $79,900 Active 162 DOM
-
2026-06-09days on market $79,900 Active 159 DOM
-
2026-06-08days on market $79,900 Active 158 DOM
-
2026-06-07days on market $79,900 Active 157 DOM
-
2026-06-07pricedays on market $79,900 Active 156 DOM
-
2026-06-04days on market $84,900 Active 153 DOM
-
2026-06-02days on market $84,900 Active 152 DOM
-
2026-06-01days on market $84,900 Active 151 DOM
-
2026-05-31days on market $84,900 Active 150 DOM
-
2026-05-31days on market $84,900 Active 149 DOM
-
2026-05-14price $84,900
-
2026-04-29status Active
-
2026-04-27historical Contingent - Inspection
-
2026-03-31price $89,900
-
2026-02-23price $94,900
-
2026-02-06price $102,900
-
2026-01-02$109,900 Active
-
2025-12-23historical $109,900
-
2022-11-18soldstatus $37,000 Sold 292-char remark
Show marketing remark (292 chars)
Great investment home, or first home. This fully furnished home has 2-3 bedrooms, spacious full bath, updated kitchen. Central Air. This home sits on a large lot with so much potential to add on or add a patio and or a garage. Call today to schedule a showing, before this one gets away!!
-
2022-11-18soldstatus $37,000
Show marketing remark (292 chars)
Great investment home, or first home. This fully furnished home has 2-3 bedrooms, spacious full bath, updated kitchen. Central Air. This home sits on a large lot with so much potential to add on or add a patio and or a garage. Call today to schedule a showing, before this one gets away!!
-
2022-10-05status Pending 292-char remark
Show marketing remark (292 chars)
Great investment home, or first home. This fully furnished home has 2-3 bedrooms, spacious full bath, updated kitchen. Central Air. This home sits on a large lot with so much potential to add on or add a patio and or a garage. Call today to schedule a showing, before this one gets away!!
-
2022-09-27$34,900 Active 292-char remark
Show marketing remark (292 chars)
Great investment home, or first home. This fully furnished home has 2-3 bedrooms, spacious full bath, updated kitchen. Central Air. This home sits on a large lot with so much potential to add on or add a patio and or a garage. Call today to schedule a showing, before this one gets away!!
-
2008-09-26$19,900
ⓘ Source: listings_history table (triggers on properties + properties_extension) + one-shot
backfill from property_details.listing_events for pre-trigger history.
Tax reassessment forecast MN · Partial reset (capped growth)
- Current annual tax
- $496 · $41/mo
- Projected year-2 tax
- $695 · $58/mo
- Expected delta
- +$199/yr (+$17/mo · 40.2%)
ⓘ Screening estimate from a state-policy table — verify with the county assessor before closing.
Climate risk First Street
- Flood 1/10 Low FEMA zone X (unshaded) · 0% chance over 30 yrs
- Wildfire 1/10 Low
- Heat 2/10 Low 7 d/yr ≥99°F today · 15 d/yr by 30 yrs out
- Wind 2/10 Low
- Air quality 1/10 Low 0 unhealthy d/yr today · 0 by 30 yrs out
Nearby sold comps map
Loading sold comps map…
Walkable amenities ~0.75 mi
Loading nearby amenities…
Taxation est. · year 1
- Rental income
- $9,732
- − Mortgage interest
- −$4,476
- − Property taxes
- −$496
- − Insurance
- −$400
- − Repairs & maintenance
- −$779
- − Management
- −$779
- − Depreciation
- −$2,324
- Taxable income
- $479
- Est. tax owed @ 24.0%
- −$115
- After-tax cash flow
- $1,650/yr
For passive investors: Depreciation is non-cash, so a rental often shows a tax loss while cash-flowing — sheltering income. Rental losses are passive: they offset passive income freely, and up to $25,000/yr can offset ordinary (W-2) income if you actively participate and your MAGI is under $100k (phasing out to $0 by $150k); unused losses carry forward. On sale, claimed depreciation is recaptured at up to 25%, and gains may owe capital-gains tax (a 1031 exchange can defer both). Figures are a year-1 estimate at your 24.0% rate — not tax advice; consult a CPA.
Schools (NCES district)
- District
- G.F.W.
- NCES district ID
- 2712580
- Math proficiency
- 40% ▼ -12.00%
- Reading proficiency
- 48% ▼ -13.00%
- Median HH income
- $50,233
- Composite
- 37.81/100
- National rank
- #4335
- State rank
- #186 of 301 in MN
Livability — Fairfax
- Score
- 73/100
- State rank
- #261
- US rank
- #5692
Category grades
Schools grade is shown separately in the Schools card above.
Census & demographics
- Census place
- Fairfax, MN
- Population (ZIP)
- 1,714
Population outlook (Renville County) Hauer SSP2
- Today (2025)
- 13,251 people
- By 2030
- 12,443 · -6.1%
- By 2040
- 10,946 · -17.4%
- By 2050
- 9,598 · -27.6%
- By 2075
- 7,411 · -44.1%
- By 2100
- 5,768 · -56.5%
Race, ethnicity, and origin ACS 2023
- Neighborhood character
- Predominantly White (78%)
- Race & ethnicity
- White 78% Hispanic / Latino 17% Two or more races 12% Asian 1%
- Hispanic origin (detail)
- Mexican 15% Cuban 2%
- Common ancestry
- Portuguese 12% Italian 4% Scottish 1%
- Foreign-born
- 10% · Canada, Jamaica
- Languages at home
- 86% English-only · Spanish 12% German/W. Germanic 1% Other Asian/Pacific 1%
Political lean MEDSL · Renville
- 2024 margin
- Solid R (+41.4) · D 28.4% · R 69.8% · Other 1.9%
- 2008→2024 swing
- -40.8pp toward R · 2008: -0.6pp · 2024: -41.4pp
- All cycles
- 2024: R+41.4 2020: R+36.5 2016: R+36.7 2012: R+9.8 2008: R+0.6
Not yet ingested
- Civics
- —
Market trends
- HPI YoY
- ▲ 12.54%
- Current HPI
- 252.2828
- Rent YoY
- —
- Metro
- —
- State GDP YoY
- ▲ 2.41%
- F500 in state
- 34
Industry mix (Fortune 500 HQ in MN)
| Industry | F500 HQs | Revenue |
|---|---|---|
| Healthcare | 2 | $407B |
|
||
| Retail | 2 | $150B |
|
||
| Consumer Goods | 2 | $32B |
|
||
| Industrial Machinery | 2 | $6B |
|
||
| Agriculture | 1 | $40B |
|
||
| Healthcare / Medical Devices | 1 | $32B |
|
||
Price history
+326.6% since first listed13 events — show timeline
- 2026-05-14 Price Changed $84,900 NORTHSTARMLS as Distributed by MLS Grid
- 2026-04-29 Relisted — NORTHSTARMLS as Distributed by MLS Grid
- 2026-04-27 Contingent — NORTHSTARMLS as Distributed by MLS Grid
- 2026-03-31 Price Changed $89,900 NORTHSTARMLS as Distributed by MLS Grid
- 2026-02-23 Price Changed $94,900 NORTHSTARMLS as Distributed by MLS Grid
- 2026-02-06 Price Changed $102,900 NORTHSTARMLS as Distributed by MLS Grid
- 2026-01-02 Listed $109,900 NORTHSTARMLS as Distributed by MLS Grid
- 2025-12-23 Coming Soon $109,900 NORTHSTARMLS as Distributed by MLS Grid
- 2022-11-18 Sold (Public Records) $37,000 Public Records
- 2022-11-18 Sold (MLS) $37,000 NORTHSTARMLS as Distributed by MLS Grid
- 2022-10-05 Pending — NORTHSTARMLS as Distributed by MLS Grid
- 2022-09-27 Listed $34,900 NORTHSTARMLS as Distributed by MLS Grid
- 2008-09-26 Listed $19,900 NORTHSTARMLS as Distributed by MLS Grid
Property tax history
+8.1%/yrLatest (2026): $496 · +7.4% YoY. Source: county tax records.
Cash-flow waterfall
monthlySold comps — $/sqft
last 12 mo · ≤1 miLoading sold comps…