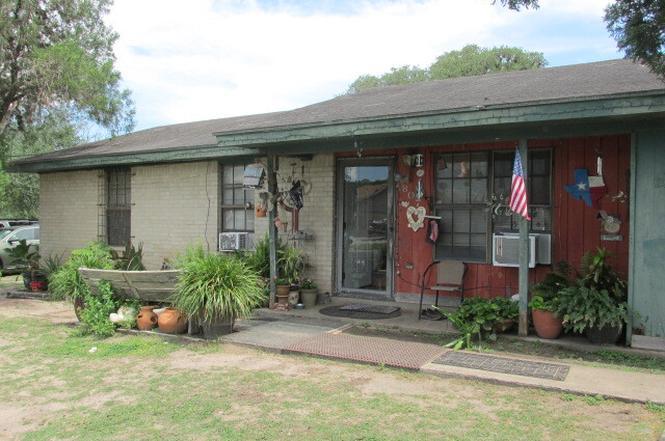
807 W Inez St · Beeville, TX
Flood risk 4/10 · Minor
- FEMA flood zone
- X (unshaded)
- Chance of flooding over 30 yrs
- 0.22%
- Est. flood insurance / yr
- $507 – $1,088
Fire risk 5/10 · Moderate
- Est. fire insurance / yr
- $1,222 – $2,270
Heat risk 8/10 · Major
- Hot days now (above 110°F)
- 7 days/yr
- Hot days in 30 yrs
- 21 days/yr
Wind risk 8/10 · Major
- Chance of severe wind over 30 yrs
- 99.0%
Air-quality risk 1/10 · Minimal
- Unhealthy air days now
- 0 days/yr
- Unhealthy air days in 30 yrs
- 0 days/yr
Risk factors via First Street. Map © Google.
Why this score? — see what drove the C+ grade
The composite is a weighted blend of 9 inputs, each scored 0–100. Each bar is that input's sub-score; the figure is the points it added to the 100-point composite (weight × sub-score).
- Cash flow +22.9/30.0
- ARV discount +15.0/15.0
- 1% rule +7.5/10.0
- DSCR +7.3/10.0
- Livability +3.5/5.0
- Rent growth +2.5/5.0
- Schools +2.5/10.0
- Condition / age +2.5/5.0
- Appreciation +0.0/10.0
$89,000
🖨 Deal sheet (PDF) 📄 Offer letter ✓ Due diligence
Listing remarks
This House has a Park Like Back Yard with it's Multiple Huge Oak Trees - It's a Perfect Place for Family Gatherings and Barbecuing or just Relaxing and Enjoying the Outdoors. This Property does need a bit of TLC but it could be a Real Cute Place, and there are Newer Constructed Homes Across the Street which makes a Nice Setting for this Home.
Key facts
- Park like back yard
- 8,276 sq ft lot
- Garage
Tags
Property features AI
Finance
- Other: Subdivision: B L & I Co
- Financial info: Currently being leased; Tenant will vacate (negotiable)
- HOA & community: Park/playground nearby
Exterior
- Parking: Attached 1-car garage
- Utilities: City water and sewer
- Home design: Pre-owned property; Front faces north
- Construction: Slab foundation; Composition roof
- Exterior features: Brick and wood exterior; Mature trees; Wooded, level lot; Street paved/asphalt; Other - see remarks
Interior
- Kitchen: Stove/Range; Refrigerator
- Bedrooms: Master bedroom on lower level (11 x 9); Bedroom 2 (11 x 9); Bedroom 3 (7 x 8)
- Flooring: Linoleum flooring
- Bathrooms: 1 full bathroom
- Heating & cooling: Electric heating with window unit; One window air conditioner
- Interior features: Ceiling fans; Eat-in kitchen; Laundry on main level; Smoke alarm; Electric water heater; Some window coverings remain
- Laundry & utility: Washer connection; Dryer connection
Neighborhood map
What this means for you Summary
Snapshot
- This is a 3-bed/1.0-bath single-family listed at $89k.
Deal economics
- At list price, monthly cash flow is $156 ($2k/yr) — positive.
- The deal already cash-flows at list — no discount required.
- Meets the 1% rule at list price ($1k rent vs $89k).
- Cap rate 8.4% vs local median 3.4% in Beeville — top-decile yield for the area; either an underpriced asset or a hidden risk that comps aren't pricing in. Stress-test before assuming the spread holds.
Location & tenants
- Location reads 70/100 on livability (#354 in TX) — a middle-class / working-renter tenant base. Strengths: cost of living A+, housing A+, health & safety A+; Watch: schools D+, crime D-, amenities F.
- Beeville ISD (town): math 23% / reading 37% proficiency, ranked #638 of 826 in TX (top 77%) — families likely to look elsewhere, expect single-tenant / working-renter base with shorter leases; 68% free/reduced lunch — lower-income household profile, screen leases tightly.
- Market conditions: 187 active listings in the ZIP; 2 comparable units currently listed for rent nearby; 15 units permitted in Bee County in 2024 (0 in 5+ unit buildings).
Forward outlook
- Local home prices are declining (-3.0%/yr); year-one equity from $615 of loan paydown is wiped out by about $3k of value loss. Plan a longer hold.
- Bee County population projected at +24% by 2050 — long-run rental-demand tailwind backs the buy-and-hold thesis.
Negotiation context
- Only 11 days on market — expect competitive offers; lowballing is unlikely to land.
- 2 sale attempts since 11y ago with the ask held roughly flat each time — persistent listings suggest the price (not the market) is what's stuck; bring a comps-based counter.
Risks & watch-outs
- Watch-outs: property tax is 3.0% of price.
- Climate carrying-cost: severe wind risk, 99% chance of damaging wind over 30y; moderate wildfire risk; extreme-heat days projected 7→21/yr by 2055 (HVAC capex compounding) — expect insurance premiums to compound above CPI over the hold.
Questions for the listing agent
- Property tax is high relative to price — has the assessment been appealed recently, and will the sale trigger a re-assessment?
- Is there a deadline driving the sale (1031 exchange, divorce, estate, relocation)? That informs how much negotiation room exists.
- Schools are D-rated, which usually means shorter tenancies and higher turnover. Who's the typical renter profile here, and what's been the actual vacancy rate?
- Crime grade is D in this area — have there been break-ins, vandalism, or insurance claims at this property in the last 3 years? What carrier currently insures it and at what premium?
- What's the average days-on-market for RENTAL listings here right now (not sales)? A rising rental-DOM trend means longer vacancies and softer asking-rent achievability than the comps imply.
- What's the recent tenant-quality profile in this submarket — average credit score on applications, eviction rate, late-payment / NSF rate, and stable-employment percentage? A property-management company in the area should have these aggregated.
- How much new for-sale + rental construction is in the pipeline within 1–3 miles? Heavy new supply typically softens prices + rents 12–24 months out; constrained supply supports both.
Investment metrics
- 1% rule
- 1.25% ✓
- Cap rate
- 8.39%
- Cash-on-cash
- 7.51%
- DSCR
- 1.33
- GRM
- 6.7
CMA / ARV
- ARV (on-the-fly)
- $128,250
- Comps found
- 7
Show comp detail 7 sales within ~0.75 mi
| Address | Dist | Beds/Ba | Sqft | Sold | Price | $/sf | Match |
|---|---|---|---|---|---|---|---|
| 506 W Inez | 0.15mi | 2/1.0 (-1) | 1,056 (+11%) | 4mo | $75,000 | $71 | 66 |
| 1805 N Washington St | 0.42mi | 3/1.0 | 1,020 (+7%) | 12mo | $157,900 | $155 | 58 |
| 1602 N Fenner | 0.15mi | 2/1.0 (-1) | 1,040 (+10%) | 18mo | $150,000 | $144 | 57 |
| 902 W Flournoy | 0.49mi | 3/1.0 | 1,070 (+13%) | 1mo | $144,400 | $135 | 56 |
| 1102 Saint Marys | 0.60mi | 3/1.0 | 1,056 (+11%) | 1mo | $135,000 | $128 | 52 |
| 507 W Ireland | 0.72mi | 3/1.0 | 1,050 (+10%) | 11mo | $145,000 | $138 | 40 |
| 904 N Morris St | 0.54mi | 3/1.0 | 825 (-13%) | 22mo | $79,500 | $96 | 34 |
Match score weights: distance 35% · size 25% · config 20% · recency 20%. Top-matched comps best support the ARV.
Projected returns pro-forma
-3.0% appreciation · 3.0% rent growth · sell at horizon
- IRR
- -4.7%
- Equity multiple
- 0.82×
- Total profit
- $-4,411
- Equity at exit
- $13,270
- IRR
- 5.0%
- Equity multiple
- 1.37×
- Total profit
- $9,284
- Equity at exit
- $7,695
Cash invested: $24,920 (down + closing). Projections, not guarantees.
Landlord ↔ Tenant lean methodology
- Overall (STATE)
- 87 Strongly Landlord-Friendly
- State Texas
- 87 Strongly Landlord-Friendly · R+5
- County
- — inherits STATE
- City
- — inherits STATE
ZIP-level market 78102
- Home prices YoY
- -34.5%
- Active inventory
- 187
- Price-to-rent
- 6.7×
Monthly cashflow live
- Estimated rent
- $1,115 medium interval (Pro) →
- Mortgage (P&I)
- −$467
- Tax from tax record
- −$221 /mo · $2,657/yr
- Insurance
- −$37
- HOA
- −$0
- Vacancy / Maint / Mgmt
- −$234
- Net cashflow
- $156
Break-even live
Sensitivity live
| Price | -10% $206 | -5% $181 | +0% $156 | +5% $131 | +10% $105 |
|---|---|---|---|---|---|
| Rent | -10% $68 | -5% $112 | +0% $156 | +5% $200 | +10% $244 |
| Rate | -1.0pp $201 | -0.5pp $178 | base $156 | +0.5pp $133 | +1.0pp $109 |
UW: 25.0% down · 7.5% · 30yr · 1.5% tax · 5.0% vac · 8.0% maint · 8.0% mgmt
Financing live
Cash to close
- Down payment
- $22,250
- Closing costs
- $2,670
- Reserves months
- —
- Total cash needed
- —
Loan-product check · same deal, 3 products live
Conventional
25% down · 7.5% · 30yr
- Down + closing
- —
- Monthly P&I
- —
- Monthly cashflow
- —
- DSCR
- —
- Eligible?
- —
Personal DTI + credit; lowest rate.
DSCR
20% down · 8.5% · 30yr
- Down + closing
- —
- Monthly P&I
- —
- Monthly cashflow
- —
- DSCR
- —
- Eligible?
- —
No personal income docs; deal must DSCR.
Hard money
10% down · 12.0% · 12mo
- Down + closing
- —
- Monthly P&I
- —
- Monthly cashflow
- —
- DSCR
- —
- Eligible?
- —
Short-term bridge; refi at stabilization.
Rent comps 2 comps
| Address | Beds | Baths | Sqft | Rent | $/sqft | DOM | Units | Dist |
|---|---|---|---|---|---|---|---|---|
| 1400 N Saint Marys St Apt 102 Beeville, TX | 2.0 | 1.0 | 814 | $900 | $1.11 | 44d | 1 | 0.53mi |
| 1306 N Tyler St Beeville, TX | 2.0 | 1.0 | 944 | $950 | $1.01 | 44d | 1 | 0.85mi |
Listing history 9 events
-
2026-06-19statusdays on market $89,000 Active 11 DOM
-
2026-06-18days on market $89,000 New 10 DOM
-
2026-06-17days on market $89,000 New 9 DOM
-
2026-06-16days on market $89,000 New 8 DOM
-
2026-06-15days on market $89,000 New 7 DOM
-
2026-06-14days on market $89,000 New 5 DOM
-
2026-06-12days on market $89,000 New 4 DOM
-
2026-06-09remarks 344-char remark
-
2026-06-09$89,000 New 1 DOM
ⓘ Source: listings_history table (triggers on properties + properties_extension) + one-shot
backfill from property_details.listing_events for pre-trigger history.
Tax reassessment forecast TX · Resets to sale price
- Current annual tax
- $2,657 · $221/mo
- Projected year-2 tax
- $2,657 · $221/mo
- Expected delta
- $0/yr ($0/mo · 0.0%)
ⓘ Screening estimate from a state-policy table — verify with the county assessor before closing.
Climate risk First Street
- Flood 4/10 Moderate FEMA zone X (unshaded) · 22% chance over 30 yrs
- Wildfire 5/10 Major
- Heat 8/10 Severe 7 d/yr ≥110°F today · 21 d/yr by 30 yrs out
- Wind 8/10 Severe 99% chance of damaging wind over 30 yrs
- Air quality 1/10 Low 0 unhealthy d/yr today · 0 by 30 yrs out
Nearby sold comps map
Loading sold comps map…
Walkable amenities ~0.75 mi
Loading nearby amenities…
Taxation est. · year 1
- Rental income
- $13,383
- − Mortgage interest
- −$4,985
- − Property taxes
- −$2,657
- − Insurance
- −$445
- − Repairs & maintenance
- −$1,071
- − Management
- −$1,071
- − Depreciation
- −$2,589
- Taxable income
- $566
- Est. tax owed @ 24.0%
- −$136
- After-tax cash flow
- $1,734/yr
For passive investors: Depreciation is non-cash, so a rental often shows a tax loss while cash-flowing — sheltering income. Rental losses are passive: they offset passive income freely, and up to $25,000/yr can offset ordinary (W-2) income if you actively participate and your MAGI is under $100k (phasing out to $0 by $150k); unused losses carry forward. On sale, claimed depreciation is recaptured at up to 25%, and gains may owe capital-gains tax (a 1031 exchange can defer both). Figures are a year-1 estimate at your 24.0% rate — not tax advice; consult a CPA.
Schools (NCES district)
- District
- Beeville ISD
- NCES district ID
- 4809720
- Math proficiency
- 23% ▼ -12.00%
- Reading proficiency
- 37% ▲ 3.00%
- Median HH income
- $40,319
- Composite
- 25.23/100
- National rank
- #7503
- State rank
- #638 of 826 in TX
Livability — Beeville
- Score
- 70/100
- State rank
- #354
- US rank
- #7698
Category grades
Schools grade is shown separately in the Schools card above.
Census & demographics
- Census place
- Beeville, TX
- County
- Bee County · 27,455 people
- City population
- 27,455
- Metro
- Beeville, TX
- Population (ZIP)
- 27,455
- Household income
- $58,939
- Rent vs Own
- Severe rent burden
- 853.0
Population outlook (Bee County) Hauer SSP2
- Today (2025)
- 35,003 people
- By 2030
- 36,447 · +4.1%
- By 2040
- 39,810 · +13.7%
- By 2050
- 43,525 · +24.3%
- By 2075
- 51,766 · +47.9%
- By 2100
- 53,434 · +52.7%
Race, ethnicity, and origin ACS 2023
- Neighborhood character
- Majority Hispanic (62%)
- Race & ethnicity
- Hispanic / Latino 62% Two or more races 29% White 27% Black 7%
- Hispanic origin (detail)
- Mexican 55%
- Common ancestry
- Lithuanian 1% Slovak 1%
- Foreign-born
- 5% · Canada
- Languages at home
- 66% English-only · Spanish 33%
Political lean MEDSL · Bee
- 2024 margin
- Solid R (+39.9) · D 29.6% · R 69.5%
- 2008→2024 swing
- -29.8pp toward R · 2008: -10.1pp · 2024: -39.9pp
- All cycles
- 2024: R+39.9 2020: R+28.9 2016: R+15.4 2012: R+11.5 2008: R+10.1
Not yet ingested
- Civics
- —
Market trends
- HPI YoY
- ▼ -76.59%
- Current HPI
- 145.1182
- Rent YoY
- —
- Metro
- Beeville, TX
- State GDP YoY
- ▲ 3.95%
- F500 in state
- 110
Industry mix (Fortune 500 HQ in TX)
| Industry | F500 HQs | Revenue |
|---|---|---|
| Energy | 16 | $1,198B |
|
||
| Technology | 5 | $198B |
|
||
| Engineering / Construction | 4 | $72B |
|
||
| Energy Services | 3 | $60B |
|
||
| Utilities | 3 | $41B |
|
||
| Healthcare | 2 | $330B |
|
||
Price history
+304.5% since first listed5 events — show timeline
- 2026-04-16 Listed $89,000 LERA
- 2016-02-24 Listing Removed — LERA
- 2015-08-24 Listed $22,000 LERA
- 1984-07-03 Sold (Public Records) — Public Records
- 1982-08-25 Sold (Public Records) — Public Records
Property tax history
+5.5%/yrLatest (2025): $2,657 · +4.8% YoY. Source: county tax records.
Cash-flow waterfall
monthlySold comps — $/sqft
last 12 mo · ≤1 miLoading sold comps…