 15-Plex
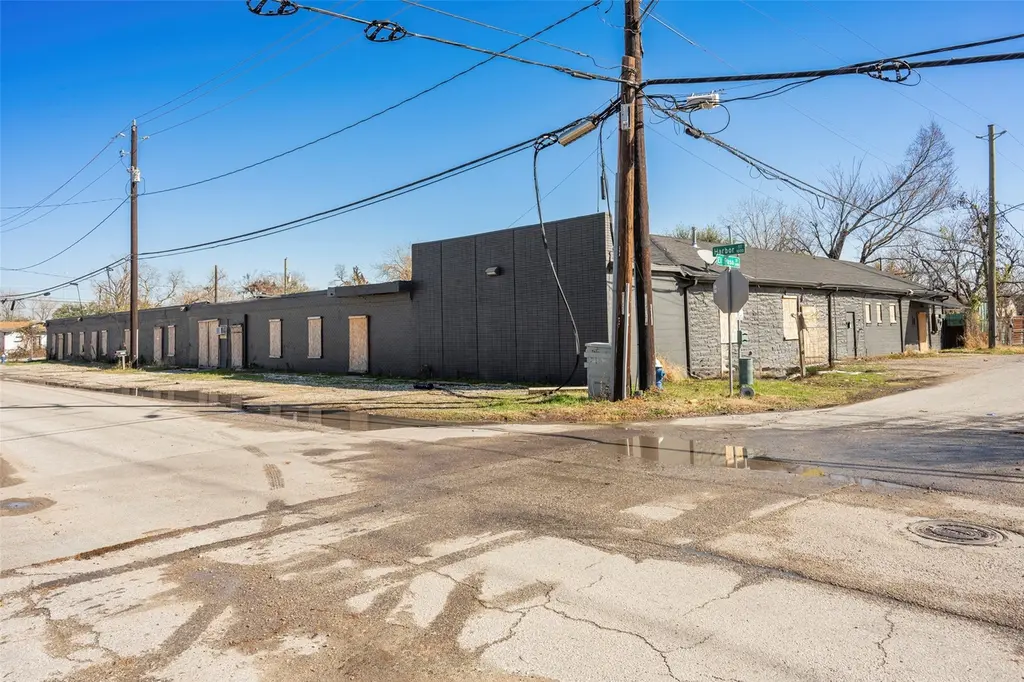
933 Harbor St #12 · Houston, TX
Flood risk No data
- FEMA flood zone
- —
- Chance of flooding over 30 yrs
- —
- Est. flood insurance / yr
- —
Fire risk No data
- Est. fire insurance / yr
- —
Heat risk No data
- Hot days now (above threshold)
- —
- Hot days in 30 yrs
- —
Wind risk No data
- Chance of severe wind over 30 yrs
- —
Air-quality risk No data
- Unhealthy air days now
- —
- Unhealthy air days in 30 yrs
- —
Risk factors via First Street. Map © Google.
Why this score? — see what drove the B+ grade
The composite is a weighted blend of 9 inputs, each scored 0–100. Each bar is that input's sub-score; the figure is the points it added to the 100-point composite (weight × sub-score).
- Cash flow +30.0/30.0
- DSCR +10.0/10.0
- Appreciation +10.0/10.0
- 1% rule +9.4/10.0
- ARV discount +7.5/15.0
- Livability +3.7/5.0
- Rent growth +3.6/5.0
- Schools +2.7/10.0
- Condition / age +1.0/5.0
$1,199,900
🖨 Deal sheet (PDF) 📄 Offer letter ✓ Due diligence
Multi-family units
County records classify this as Multi-Family (5+ Unit). Listing-text estimate: 15 units. confirmed
5+ unit building — per-unit beds/baths from public records are typically unavailable; the breakdown below (if shown) is an estimate from the listing text.
Listing remarks MLS
15 unit multifamily property where each unit has its own private full bathroom, giving residents privacy and flexibility. The layout supports several use options, including workforce housing, furnished rentals, or rent by room, and the property offers on site parking for tenants and visitors. The asset does need rehab and a full turnaround, creating a strong opportunity for a new owner to improve the units, raise rents, and bring the property back to stable operations.Listing may incorporate floorplan and virtual furnishings to help visualize its potential. Property is being sold in “as-is condition”, dimensions and information are approximate and buyer/representation responsibility to verify.
Key facts
- On site parking
- Rehab opportunity
- 0.34 acre lot
Tags
Neighborhood map
What this means for you Summary
Snapshot
- This is a 15 × 1-bed/1-bath units multifamily listed at $1.20M. Condition is rated poor.
Deal economics
- At list price, monthly cash flow is $5k ($60k/yr) — positive. Per door: $335/mo.
- The deal already cash-flows at list — no discount required.
- Meets the 1% rule at list price ($17k rent vs $1.20M).
- Recommended offer: $1.06M (12.0% below list) — sets the bar for market timing.
- Cap rate 11.3% vs local median 3.2% in Houston — top-decile yield for the area; either an underpriced asset or a hidden risk that comps aren't pricing in. Stress-test before assuming the spread holds.
Location & tenants
- Location reads 74/100 on livability (#184 in TX, #4,771 nationally) — a middle-class / working-renter tenant base. Strengths: amenities A+, cost of living A+, housing A+; Watch: crime F.
- Houston ISD (urban): math 27% / reading 35% proficiency, ranked #593 of 826 in TX (top 72%) — families likely to look elsewhere, expect single-tenant / working-renter base with shorter leases; 71% free/reduced lunch — lower-income household profile, screen leases tightly.
- Zoned schools: Martinez R El (math 32% / reading 32%, grade F, #2,268 of 4,322 statewide, top 55%, 428 students, 96% FRL); Mcreynolds Middle (math 10% / reading 17%, grade F, #1,602 of 1,662 statewide, top 97%, 398 students, 98% FRL); Wheatley H S (math 17% / reading 19%, grade F, #1,445 of 1,632 statewide, top 89%, 643 students, 95% FRL) — zoned schools average 96% FRL vs 71% district-wide (25 pts higher); higher-poverty schools than district average — tighter screening recommended.
- Market conditions: Rents rising fast (+4.3%/yr); 339 active listings in the ZIP; 29,883 units permitted in Harris County in 2024 (8,621 in 5+ unit buildings).
- At $17,263/mo this rent would consume 413% of the median local household income ($50k/yr) (locally 969% of renters already pay >50% of income on rent) — very limited rent-growth headroom before tenants either downsize or default.
Forward outlook
- In year one you build about $128k of equity ($8k loan paydown + $120k appreciation (10.0% local appreciation)).
- Harris County population projected at +47% by 2050 — long-run rental-demand tailwind backs the buy-and-hold thesis.
- At projected returns (10.0% appreciation + 4.3% rent growth), your $336k cash investment doubles in ~2 years — after that, you're playing with house money.
- By year 2, paydown + projected appreciation supports a ~$206k cash-out refi (75% LTV) — recoverable capital for the next deal without selling this one.
Negotiation context
- It's been on market 134 days — a 12% lower offer ($1.06M) is reasonable based on typical stale-listing flexibility.
Risks & watch-outs
- Watch-outs: built in 1920 — expect roof / HVAC / electrical / plumbing capex.
Questions for the listing agent
- It's been on market 134 days. Have you received any prior offers? Is the seller open to a 12% concession, seller financing, or rate buy-down credit?
- Can we see the unit-by-unit rent roll, current vacancy, and any below-market leases? What's the average tenancy length?
- What capital expenditures (roof, boiler, parking lot, exteriors) have been made in the last 5 years, and what's planned in the next 2?
- Have any recent inspections been done? Can we get a copy of the seller's disclosures and any deferred-maintenance estimates?
- Built in 1920 — when were the roof, HVAC, electrical panel, plumbing, and water heater last replaced?
- Why hasn't it sold? Are there any deal-killer items the seller is aware of (foundation, flood, title, zoning, code violations)?
- Is there a deadline driving the sale (1031 exchange, divorce, estate, relocation)? That informs how much negotiation room exists.
- Schools are D-rated, which usually means shorter tenancies and higher turnover. Who's the typical renter profile here, and what's been the actual vacancy rate?
- Crime grade is F in this area — have there been break-ins, vandalism, or insurance claims at this property in the last 3 years? What carrier currently insures it and at what premium?
- What's the average days-on-market for RENTAL listings here right now (not sales)? A rising rental-DOM trend means longer vacancies and softer asking-rent achievability than the comps imply.
- What's the recent tenant-quality profile in this submarket — average credit score on applications, eviction rate, late-payment / NSF rate, and stable-employment percentage? A property-management company in the area should have these aggregated.
- How much new apartment / multifamily construction is in the pipeline within 1–3 miles? Heavy new supply (>2% of stock underway) typically softens rents 12–24 months out; light construction supports rent growth.
Investment metrics
- 1% rule
- 1.44% ✓
- Cap rate
- 11.31%
- Cash-on-cash
- 17.92%
- DSCR
- 1.80
- GRM
- 5.8
CMA / ARV
No comps found within radius.
Projected returns pro-forma
10.0% appreciation · 4.27% rent growth · sell at horizon
- IRR
- 38.3%
- Equity multiple
- 3.96×
- Total profit
- $995,920
- Equity at exit
- $1,080,965
- IRR
- 33.5%
- Equity multiple
- 9.13×
- Total profit
- $2,730,125
- Equity at exit
- $2,331,142
Cash invested: $335,972 (down + closing). Projections, not guarantees.
Landlord ↔ Tenant lean methodology
- Overall (STATE)
- 87 Strongly Landlord-Friendly
- State Texas
- 87 Strongly Landlord-Friendly · R+5
- County
- — inherits STATE
- City
- — inherits STATE
ZIP-level market 77020
- Home prices YoY
- 29.1%
- Rents YoY
- 4.3%
- Active inventory
- 339
- Price-to-rent
- 86.9×
Monthly cashflow live
- Estimated rent
- $17,263 medium interval (Pro) →
- Mortgage (P&I)
- −$6,292
- Tax from tax record
- −$1,827 /mo · $21,924/yr
- Insurance
- −$500
- HOA
- −$0
- Vacancy / Maint / Mgmt
- −$3,625
- Net cashflow
- $5,018
Break-even live
Sensitivity live
| Price | -10% $5,698 | -5% $5,358 | +0% $5,018 | +5% $4,679 | +10% $4,339 |
|---|---|---|---|---|---|
| Rent | -10% $3,655 | -5% $4,337 | +0% $5,018 | +5% $5,700 | +10% $6,382 |
| Rate | -1.0pp $5,623 | -0.5pp $5,324 | base $5,018 | +0.5pp $4,707 | +1.0pp $4,391 |
15-unit breakdown (identical units grouped — click to expand)
| Units | Beds | Baths | Est. rent |
|---|---|---|---|
| 15× units | 1 | 1 | $17,265 |
| #1 | 1 | 1 | $1,151 |
| #2 | 1 | 1 | $1,151 |
| #3 | 1 | 1 | $1,151 |
| #4 | 1 | 1 | $1,151 |
| #5 | 1 | 1 | $1,151 |
| #6 | 1 | 1 | $1,151 |
| #7 | 1 | 1 | $1,151 |
| #8 | 1 | 1 | $1,151 |
| #9 | 1 | 1 | $1,151 |
| #10 | 1 | 1 | $1,151 |
| #11 | 1 | 1 | $1,151 |
| #12 | 1 | 1 | $1,151 |
| #13 | 1 | 1 | $1,151 |
| #14 | 1 | 1 | $1,151 |
| #15 | 1 | 1 | $1,151 |
| Total (15 units) | $17,263 | ||
UW: 25.0% down · 7.5% · 30yr · 1.5% tax · 5.0% vac · 8.0% maint · 8.0% mgmt
Financing live
Cash to close
- Down payment
- $299,975
- Closing costs
- $35,997
- Reserves months
- —
- Total cash needed
- —
Loan-product check · same deal, 3 products live
Conventional
25% down · 7.5% · 30yr
- Down + closing
- —
- Monthly P&I
- —
- Monthly cashflow
- —
- DSCR
- —
- Eligible?
- —
Personal DTI + credit; lowest rate.
DSCR
20% down · 8.5% · 30yr
- Down + closing
- —
- Monthly P&I
- —
- Monthly cashflow
- —
- DSCR
- —
- Eligible?
- —
No personal income docs; deal must DSCR.
Hard money
10% down · 12.0% · 12mo
- Down + closing
- —
- Monthly P&I
- —
- Monthly cashflow
- —
- DSCR
- —
- Eligible?
- —
Short-term bridge; refi at stabilization.
Listing history 12 events
-
2026-06-16days on market $1,199,900 Active 134 DOM
-
2026-06-15days on market $1,199,900 Active 133 DOM
-
2026-06-13days on market $1,199,900 Active 131 DOM
-
2026-06-10days on market $1,199,900 Active 127 DOM
-
2026-06-08days on market $1,199,900 Active 126 DOM
-
2026-06-07days on market $1,199,900 Active 125 DOM
-
2026-06-04days on market $1,199,900 Active 122 DOM
-
2026-06-01days on market $1,199,900 Active 119 DOM
-
2026-05-31days on market $1,199,900 Active 118 DOM
-
2026-04-13price $1,199,900 714-char remark
Show marketing remark (714 chars)
15 unit multifamily property where each unit has its own private full bathroom, giving residents privacy and flexibility. The layout supports several use options, including workforce housing, furnished rentals, or rent by room, and the property offers on site parking for tenants and visitors. The asset does need rehab and a full turnaround, creating a strong opportunity for a new owner to improve the units, raise rents, and bring the property back to stable operations.Listing may incorporate floorplan and virtual furnishings to help visualize its potential. Property is being sold in “as-is condition”, dimensions and information are approximate and buyer/representation responsibility to verify.
-
2026-03-21price $1,249,900 714-char remark
Show marketing remark (714 chars)
15 unit multifamily property where each unit has its own private full bathroom, giving residents privacy and flexibility. The layout supports several use options, including workforce housing, furnished rentals, or rent by room, and the property offers on site parking for tenants and visitors. The asset does need rehab and a full turnaround, creating a strong opportunity for a new owner to improve the units, raise rents, and bring the property back to stable operations.Listing may incorporate floorplan and virtual furnishings to help visualize its potential. Property is being sold in “as-is condition”, dimensions and information are approximate and buyer/representation responsibility to verify.
-
2026-02-02$1,349,900 Active 714-char remark
Show marketing remark (714 chars)
15 unit multifamily property where each unit has its own private full bathroom, giving residents privacy and flexibility. The layout supports several use options, including workforce housing, furnished rentals, or rent by room, and the property offers on site parking for tenants and visitors. The asset does need rehab and a full turnaround, creating a strong opportunity for a new owner to improve the units, raise rents, and bring the property back to stable operations.Listing may incorporate floorplan and virtual furnishings to help visualize its potential. Property is being sold in “as-is condition”, dimensions and information are approximate and buyer/representation responsibility to verify.
ⓘ Source: listings_history table (triggers on properties + properties_extension) + one-shot
backfill from property_details.listing_events for pre-trigger history.
Tax reassessment forecast TX · Resets to sale price
- Current annual tax
- $21,924 · $1,827/mo
- Projected year-2 tax
- $21,958 · $1,830/mo
- Expected delta
- +$34/yr (+$3/mo · 0.2%)
ⓘ Screening estimate from a state-policy table — verify with the county assessor before closing.
Nearby sold comps map
Loading sold comps map…
Walkable amenities ~0.75 mi
Loading nearby amenities…
Taxation est. · year 1
- Rental income
- $207,156
- − Mortgage interest
- −$67,213
- − Property taxes
- −$21,924
- − Insurance
- −$6,000
- − Repairs & maintenance
- −$16,572
- − Management
- −$16,572
- − Depreciation
- −$34,906
- Taxable income
- $43,968
- Est. tax owed @ 24.0%
- −$10,552
- After-tax cash flow
- $49,668/yr
For passive investors: Depreciation is non-cash, so a rental often shows a tax loss while cash-flowing — sheltering income. Rental losses are passive: they offset passive income freely, and up to $25,000/yr can offset ordinary (W-2) income if you actively participate and your MAGI is under $100k (phasing out to $0 by $150k); unused losses carry forward. On sale, claimed depreciation is recaptured at up to 25%, and gains may owe capital-gains tax (a 1031 exchange can defer both). Figures are a year-1 estimate at your 24.0% rate — not tax advice; consult a CPA.
Condition & rehab AI · 13 photos
This 15-unit multifamily property is in poor condition with boarded-up windows and overgrown vegetation. Significant repairs and maintenance are needed to bring it up to a livable standard.
Repairs flagged
- Major Boarded-up windows — Indicates potential structural issues and lack of security
- Major Overgrown vegetation — Aesthetically unappealing and could indicate neglect
Value-add opportunities
- Both Landscaping and fencing — Improves curb appeal and security, attracting potential tenants or buyers
- Both Boarded-up windows — Fixing the boarded-up windows will improve the property's appearance and security
Renovation cost estimate screening
| Repair item | Severity | Est. cost |
|---|---|---|
| Boarded-up windows · Indicates potential structural issues and lack of security | Major | $15,000–50,000 |
| Overgrown vegetation · Aesthetically unappealing and could indicate neglect | Major | $15,000–50,000 |
| Total estimated repair cost · 2 items | $30,000–100,000 |
Value-add ROI direction
- Both Landscaping and fencing — Improves curb appeal and security, attracting potential tenants or buyers ↑
- Both Boarded-up windows — Fixing the boarded-up windows will improve the property's appearance and security ↑
ⓘ Cost ranges are severity-bucket heuristics (US national rule-of-thumb). Get contractor quotes + a written scope before underwriting a rehab budget.
Schools (NCES district)
- District
- Houston ISD
- NCES district ID
- 4823640
- Math proficiency
- 27% ▼ -18.00%
- Reading proficiency
- 35% ▼ -6.00%
- Median HH income
- $46,054
- Composite
- 26.63/100
- National rank
- #7173
- State rank
- #593 of 826 in TX
Livability — Houston
- Score
- 74/100
- State rank
- #184
- US rank
- #4771
Category grades
Schools grade is shown separately in the Schools card above.
Census & demographics
- Census place
- Houston, TX
- County
- Harris County · 4,702,590 people
- City population
- 3,226,434
- Metro
- Houston-The Woodlands-Sugar Land, TX
- Population (ZIP)
- 23,686
- Household income
- $50,119
- Rent vs Own
- Severe rent burden
- 969.0
Population outlook (Harris County) Hauer SSP2
- Today (2025)
- 5,571,493 people
- By 2030
- 6,089,821 · +9.3%
- By 2040
- 7,142,806 · +28.2%
- By 2050
- 8,185,864 · +46.9%
- By 2075
- 10,574,329 · +89.8%
- By 2100
- 12,109,958 · +117.4%
Race, ethnicity, and origin ACS 2023
- Neighborhood character
- Predominantly Hispanic (69%)
- Race & ethnicity
- Hispanic / Latino 69% Black 24% Two or more races 22% White 5% Asian 1%
- Hispanic origin (detail)
- Mexican 60%
- Common ancestry
- Swiss 1%
- Foreign-born
- 23% · Canada
- Languages at home
- 39% English-only · Spanish 59% Other Indo-European 1%
Political lean MEDSL · Harris
- 2024 margin
- Lean D (+5.5) · D 52.0% · R 46.4% · Other 1.6%
- 2008→2024 swing
- +3.9pp toward D · 2008: 1.6pp · 2024: 5.5pp
- All cycles
- 2024: D+5.5 2020: D+13.3 2016: D+12.4 2012: D+0.1 2008: D+1.6
Not yet ingested
- Civics
- —
Market trends
- HPI YoY
- ▲ 55.64%
- Current HPI
- 246.5578
- Rent YoY
- ▲ 4.27%
- Metro
- Houston-The Woodlands-Sugar Land, TX
- State GDP YoY
- ▲ 3.95%
- F500 in state
- 110
Industry mix (Fortune 500 HQ in TX)
| Industry | F500 HQs | Revenue |
|---|---|---|
| Energy | 16 | $1,198B |
|
||
| Technology | 5 | $198B |
|
||
| Engineering / Construction | 4 | $72B |
|
||
| Energy Services | 3 | $60B |
|
||
| Utilities | 3 | $41B |
|
||
| Healthcare | 2 | $330B |
|
||
Price history
-11.1% since first listed3 events — show timeline
- 2026-04-13 Price Changed $1,199,900 HARMLS
- 2026-03-21 Price Changed $1,249,900 HARMLS
- 2026-02-02 Listed $1,349,900 HARMLS
Property tax history
+1.8%/yrLatest (2025): $21,924 · -0.0% YoY. Source: county tax records.
Cash-flow waterfall
monthlySold comps — $/sqft
last 12 mo · ≤1 miLoading sold comps…