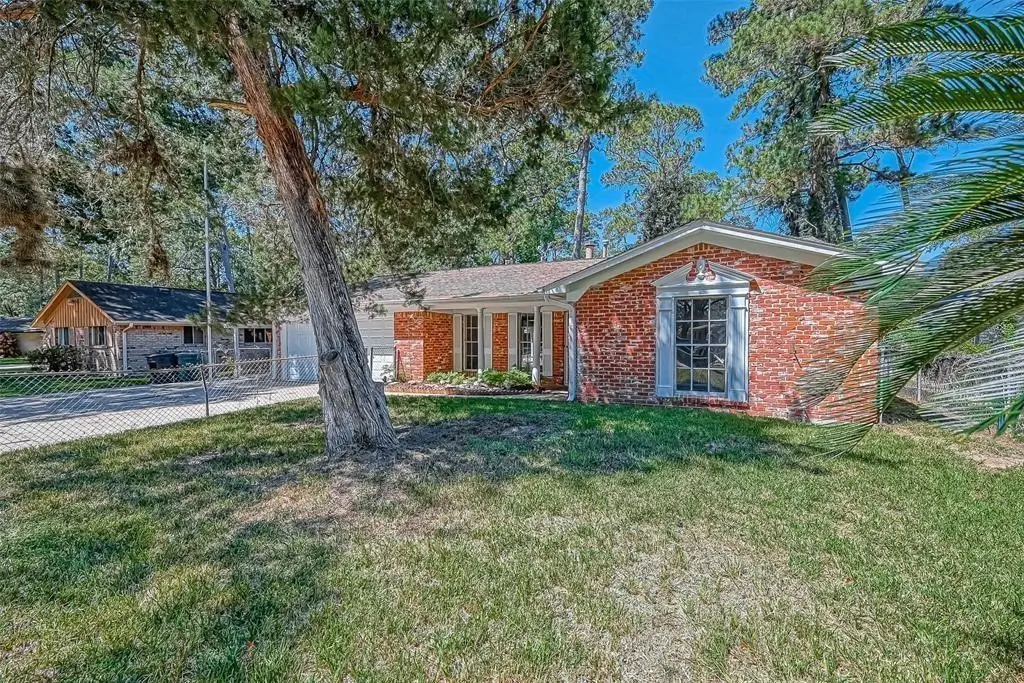
211 Loon River Dr · Houston, TX
Flood risk 1/10 · Minimal
- FEMA flood zone
- X (unshaded)
- Chance of flooding over 30 yrs
- 0.0%
- Est. flood insurance / yr
- $507 – $1,088
Fire risk 2/10 · Minimal
- Est. fire insurance / yr
- $1,222 – $2,270
Heat risk 9/10 · Severe
- Hot days now (above 112°F)
- 7 days/yr
- Hot days in 30 yrs
- 24 days/yr
Wind risk 9/10 · Severe
- Chance of severe wind over 30 yrs
- 99.0%
Air-quality risk 2/10 · Minimal
- Unhealthy air days now
- 2 days/yr
- Unhealthy air days in 30 yrs
- 2 days/yr
Risk factors via First Street. Map © Google.
Why this score? — see what drove the C- grade
The composite is a weighted blend of 9 inputs, each scored 0–100. Each bar is that input's sub-score; the figure is the points it added to the 100-point composite (weight × sub-score).
- Cash flow +15.8/30.0
- ARV discount +13.9/15.0
- 1% rule +5.3/10.0
- DSCR +4.9/10.0
- Livability +3.7/5.0
- Schools +3.1/10.0
- Rent growth +2.5/5.0
- Condition / age +2.5/5.0
- Appreciation +0.7/10.0
$199,500
🖨 Deal sheet 📄 Offer letter ✓ Due diligence
Listing remarks MLS
Great starter home, in established neighborhood. Close to shopping, Lake Houston, and Schools.
Key facts
- Close to schools
- Lake houston
- Close to shopping
Tags
Neighborhood map
What this means for you Summary
Snapshot
- This is a 3-bed/2.0-bath single-family listed at $200k.
Deal economics
- At list price, monthly cash flow is $93 ($1k/yr) — positive.
- The deal already cash-flows at list — no discount required.
- Meets the 1% rule at list price ($2k rent vs $200k).
- Recommended offer: $176k (12.0% below list) — sets the bar for market timing.
- Cap rate 6.8% vs local median 3.2% in Houston — top-decile yield for the area; either an underpriced asset or a hidden risk that comps aren't pricing in. Stress-test before assuming the spread holds.
Location & tenants
- Location reads 74/100 on livability (#184 in TX, #4,771 nationally) — a middle-class / working-renter tenant base. Strengths: amenities A+, cost of living A+, housing A+; Watch: schools D, crime F.
- Huffman ISD (rural): math 32% / reading 35% proficiency, ranked #500 of 826 in TX (top 60%) — families likely to look elsewhere, expect single-tenant / working-renter base with shorter leases.
- Market conditions: 585 active listings in the ZIP; 5 comparable units currently listed for rent nearby; rentals lingering (median 44d on market — plan ~5-8 weeks vacancy on turnover, expect pricing pressure); 80% of comp listings sitting > 30 days — soft ceiling on asking rent; solid renter incomes; 29,883 units permitted in Harris County in 2024 (8,621 in 5+ unit buildings).
Forward outlook
- Local home prices are declining (-3.0%/yr); year-one equity from $1k of loan paydown is wiped out by about $6k of value loss. Plan a longer hold.
- Harris County population projected at +47% by 2050 — long-run rental-demand tailwind backs the buy-and-hold thesis.
Negotiation context
- It's been on market 122 days — a 12% lower offer ($176k) is reasonable based on typical stale-listing flexibility.
- 8 sale attempts since 4y ago; this cycle's ask has dropped $40k (17%) from the opening price — seller is motivated, your offer sets the floor, not the list.
Risks & watch-outs
- Climate carrying-cost: severe wind risk, 99% chance of damaging wind over 30y; extreme-heat days projected 7→24/yr by 2055 (HVAC capex compounding) — expect insurance premiums to compound above CPI over the hold.
Questions for the listing agent
- It's been on market 122 days. Have you received any prior offers? Is the seller open to a 12% concession, seller financing, or rate buy-down credit?
- Built in 1960 — when were the roof, HVAC, electrical panel, plumbing, and water heater last replaced?
- Why hasn't it sold? Are there any deal-killer items the seller is aware of (foundation, flood, title, zoning, code violations)?
- Is there a deadline driving the sale (1031 exchange, divorce, estate, relocation)? That informs how much negotiation room exists.
- Schools are D-rated, which usually means shorter tenancies and higher turnover. Who's the typical renter profile here, and what's been the actual vacancy rate?
- Crime grade is F in this area — have there been break-ins, vandalism, or insurance claims at this property in the last 3 years? What carrier currently insures it and at what premium?
- What's the average days-on-market for RENTAL listings here right now (not sales)? A rising rental-DOM trend means longer vacancies and softer asking-rent achievability than the comps imply.
- What's the recent tenant-quality profile in this submarket — average credit score on applications, eviction rate, late-payment / NSF rate, and stable-employment percentage? A property-management company in the area should have these aggregated.
- How much new for-sale + rental construction is in the pipeline within 1–3 miles? Heavy new supply typically softens prices + rents 12–24 months out; constrained supply supports both.
Investment metrics
- 1% rule
- 1.03% ✓
- Cap rate
- 6.85%
- Cash-on-cash
- 1.99%
- DSCR
- 1.09
- GRM
- 8.1
CMA / ARV
- ARV (median comp)
- $232,540
- List price
- $199,500
- Delta
- -14.21%
- Verdict
- UNDERPRICED
- Comps
- 20 within 1.0 mi
Show comp detail 12 sales within ~0.75 mi
| Address | Dist | Beds/Ba | Sqft | Sold | Price | $/sf | Match |
|---|---|---|---|---|---|---|---|
| 331 Cherry Valley Dr | 0.16mi | 3/2.0 | 1,495 (+4%) | 2mo | $185,000 | $124 | 85 |
| 24402 Lightwoods Dr | 0.08mi | 3/2.0 | 1,607 (+11%) | 3mo | $254,900 | $159 | 75 |
| 24702 Pennfield Arbor Ln | 0.38mi | 3/2.5 | 1,556 (+8%) | 2mo | $231,990 | $149 | 66 |
| 24712 Stablewood Forest Ct | 0.46mi | 3/2.5 | 1,556 (+8%) | 0mo | $180,000 | $116 | 63 |
| 723 Pas Trl | 0.53mi | 3/2.0 | 1,365 (-5%) | 4mo | $220,000 | $161 | 63 |
| 24034 E Lake Houston Pkwy | 0.46mi | 3/2.0 | 1,558 (+8%) | 4mo | $255,999 | $164 | 62 |
| 526 Emerald Thicket Ln | 0.44mi | 3/2.0 | 1,267 (-12%) | 1mo | $234,990 | $185 | 58 |
| 24709 Stablewood Forest Ct | 0.43mi | 3/2.0 | 1,267 (-12%) | 2mo | $227,990 | $180 | 58 |
| 24717 Stablewood Frst | 0.45mi | 3/2.0 | 1,267 (-12%) | 3mo | $224,990 | $178 | 56 |
| 507 Corydon Dr | 0.39mi | 2/1.0 (-1) | 1,310 (-9%) | 2mo | $80,000 | $61 | 55 |
| 513 Emerald Thicket Ln | 0.45mi | 3/2.5 | 1,647 (+14%) | 1mo | $249,990 | $152 | 53 |
| 24716 Lago Bay Ln | 0.46mi | 4/2.0 (+1) | 1,616 (+12%) | 2mo | $244,990 | $152 | 52 |
Match score weights: distance 35% · size 25% · config 20% · recency 20%. Top-matched comps best support the ARV.
Projected returns pro-forma
-3.0% appreciation · 3.0% rent growth · sell at horizon
- IRR
- -13.1%
- Equity multiple
- 0.53×
- Total profit
- $-26,314
- Equity at exit
- $29,746
- IRR
- -4.0%
- Equity multiple
- 0.73×
- Total profit
- $-14,831
- Equity at exit
- $17,249
Cash invested: $55,860 (down + closing). Projections, not guarantees.
Landlord ↔ Tenant lean methodology
- Overall (STATE)
- 87 Strongly Landlord-Friendly
- State Texas
- 87 Strongly Landlord-Friendly · R+5
- County
- — inherits STATE
- City
- — inherits STATE
ZIP-level market 77336
- Home prices YoY
- -1.8%
- Active inventory
- 585
- Price-to-rent
- 8.1×
Monthly cashflow live
- Estimated rent
- $2,050 high interval (Pro) →
- Mortgage (P&I)
- −$1,046
- Tax from tax record
- −$398 /mo · $4,770/yr
- Insurance
- −$83
- HOA
- −$0
- Vacancy / Maint / Mgmt
- −$430
- Net cashflow
- $93
Break-even live
UW: 25.0% down · 7.5% · 30yr · 1.5% tax · 5.0% vac · 8.0% maint · 8.0% mgmt
Financing live
Cash to close
- Down payment
- $49,875
- Closing costs
- $5,985
- Reserves months
- —
- Total cash needed
- —
Loan-product check · same deal, 3 products live
Conventional
25% down · 7.5% · 30yr
- Down + closing
- —
- Monthly P&I
- —
- Monthly cashflow
- —
- DSCR
- —
- Eligible?
- —
Personal DTI + credit; lowest rate.
DSCR
20% down · 8.5% · 30yr
- Down + closing
- —
- Monthly P&I
- —
- Monthly cashflow
- —
- DSCR
- —
- Eligible?
- —
No personal income docs; deal must DSCR.
Hard money
10% down · 12.0% · 12mo
- Down + closing
- —
- Monthly P&I
- —
- Monthly cashflow
- —
- DSCR
- —
- Eligible?
- —
Short-term bridge; refi at stabilization.
Rent comps 5 comps
| Address | Beds | Baths | Sqft | Rent | $/sqft | DOM | Units | Dist |
|---|---|---|---|---|---|---|---|---|
| 24523 Whitesail Dr Huffman, TX | 3.0 | 2.0 | 1512 | $1,800 | $1.19 | 43d | 1 | 0.26mi |
| 408 Emerald Thicket Ln Huffman, TX | 3.0 | 2.5 | 1755 | $2,200 | $1.25 | 43d | 1 | 0.38mi |
| 24719 Colony Meadow Trl Huffman, TX | 4.0 | 2.0 | 1613 | $2,200 | $1.36 | 43d | 1 | 0.86mi |
| 24730 Russet Bluff Trl Huffman, TX | 4.0 | 2.0 | 1604 | $2,150 | $1.34 | 1d | 1 | 0.93mi |
| 24118 Grey Fox Dr Huffman, TX | 3.0 | 2.0 | 1543 | $1,425 | $0.92 | 43d | 1 | 0.97mi |
Listing history 43 events
-
2026-06-09days on market $199,500 Active 122 DOM
-
2026-06-08days on market $199,500 Active 121 DOM
-
2026-06-07days on market $199,500 Active 120 DOM
-
2026-06-04days on market $199,500 Active 117 DOM
-
2026-06-03days on market $199,500 Active 116 DOM
-
2026-06-02days on market $199,500 Active 115 DOM
-
2026-06-01days on market $199,500 Active 114 DOM
-
2026-05-31days on market $199,500 Active 113 DOM
-
2026-05-14price $199,500 94-char remark
Show marketing remark (94 chars)
Great starter home, in established neighborhood. Close to shopping, Lake Houston, and Schools.
-
2026-04-16price $199,995 94-char remark
Show marketing remark (94 chars)
Great starter home, in established neighborhood. Close to shopping, Lake Houston, and Schools.
-
2026-04-08price $208,995 94-char remark
Show marketing remark (94 chars)
Great starter home, in established neighborhood. Close to shopping, Lake Houston, and Schools.
-
2026-03-31price $209,995 94-char remark
Show marketing remark (94 chars)
Great starter home, in established neighborhood. Close to shopping, Lake Houston, and Schools.
-
2026-03-28price $218,500 94-char remark
Show marketing remark (94 chars)
Great starter home, in established neighborhood. Close to shopping, Lake Houston, and Schools.
-
2026-03-23price $219,995 94-char remark
Show marketing remark (94 chars)
Great starter home, in established neighborhood. Close to shopping, Lake Houston, and Schools.
-
2026-02-07$239,995 Active 94-char remark
Show marketing remark (94 chars)
Great starter home, in established neighborhood. Close to shopping, Lake Houston, and Schools.
-
2025-02-16historical
-
2025-02-09price $239,995
-
2025-02-07historical $1,500
-
2025-01-10price $1,500
-
2025-01-10price $1,495
-
2025-01-09price $1,500
-
2024-12-18$1,495
-
2024-12-17$249,995 Active
-
2024-12-16historical
-
2024-12-05price $249,995
-
2024-11-26price $259,995
-
2024-09-11price $279,995
-
2024-08-22$299,995 Active
-
2023-07-06soldstatus Sold
-
2023-07-05status Option Pending
-
2023-07-03status Pending
-
2023-03-06$249,995 Active
-
2023-02-28historical
-
2022-12-15price $239,995
-
2022-12-09price $244,995
-
2022-11-28$249,995 Active
-
2022-11-17historical
-
2022-09-28status Active
-
2022-06-15price $249,995
-
2022-06-15historical
-
2022-06-10price $239,995
-
2022-05-21$249,995 Active
-
1990-02-27soldstatus
ⓘ Source: listings_history table (triggers on properties + properties_extension) + one-shot
backfill from property_details.listing_events for pre-trigger history.
Tax reassessment forecast TX · Resets to sale price
- Current annual tax
- $4,770 · $398/mo
- Projected year-2 tax
- $4,770 · $398/mo
- Expected delta
- $0/yr ($0/mo · 0.0%)
ⓘ Screening estimate from a state-policy table — verify with the county assessor before closing.
Climate risk First Street
- Flood 1/10 Low FEMA zone X (unshaded) · 0% chance over 30 yrs
- Wildfire 2/10 Low
- Heat 9/10 Extreme 7 d/yr ≥112°F today · 24 d/yr by 30 yrs out
- Wind 9/10 Extreme 99% chance of damaging wind over 30 yrs
- Air quality 2/10 Low 2 unhealthy d/yr today · 2 by 30 yrs out
Nearby sold comps map
Loading sold comps map…
Walkable amenities ~0.75 mi
Loading nearby amenities…
Taxation est. · year 1
- Rental income
- $24,598
- − Mortgage interest
- −$11,175
- − Property taxes
- −$4,770
- − Insurance
- −$998
- − Repairs & maintenance
- −$1,968
- − Management
- −$1,968
- − Depreciation
- −$5,804
- Taxable loss
- −$2,084
- Est. tax savings @ 24.0%
- +$500
- After-tax cash flow
- $1,610/yr
For passive investors: Depreciation is non-cash, so a rental often shows a tax loss while cash-flowing — sheltering income. Rental losses are passive: they offset passive income freely, and up to $25,000/yr can offset ordinary (W-2) income if you actively participate and your MAGI is under $100k (phasing out to $0 by $150k); unused losses carry forward. On sale, claimed depreciation is recaptured at up to 25%, and gains may owe capital-gains tax (a 1031 exchange can defer both). Figures are a year-1 estimate at your 24.0% rate — not tax advice; consult a CPA.
Schools (NCES district)
- District
- Huffman ISD
- NCES district ID
- 4823820
- Math proficiency
- 32% ▼ -9.00%
- Reading proficiency
- 35% ▼ -9.00%
- Median HH income
- $65,848
- Composite
- 30.61/100
- National rank
- #6195
- State rank
- #500 of 826 in TX
Livability — Houston
- Score
- 74/100
- State rank
- #184
- US rank
- #4771
Category grades
Schools grade is shown separately in the Schools card above.
Census & demographics
- Census place
- Houston, TX
- County
- Harris County · 4,702,590 people
- City population
- 3,226,434
- Metro
- Houston-The Woodlands-Sugar Land, TX
- Population (ZIP)
- 14,342
- Household income
- $96,404
- Rent vs Own
- Severe rent burden
- 377.0
Population outlook (Harris County) Hauer SSP2
- Today (2025)
- 5,571,493 people
- By 2030
- 6,089,821 · +9.3%
- By 2040
- 7,142,806 · +28.2%
- By 2050
- 8,185,864 · +46.9%
- By 2075
- 10,574,329 · +89.8%
- By 2100
- 12,109,958 · +117.4%
Race, ethnicity, and origin ACS 2023
- Neighborhood character
- Majority White (65%)
- Race & ethnicity
- White 65% Hispanic / Latino 23% Two or more races 9% Black 5% Native American 4%
- Hispanic origin (detail)
- Mexican 20%
- Common ancestry
- Lithuanian 4% Slovak 2% Romanian 2%
- Foreign-born
- 9% · Canada
- Languages at home
- 79% English-only · Spanish 18% Other Indo-European 2%
Political lean MEDSL · Harris
- 2024 margin
- Lean D (+5.5) · D 52.0% · R 46.4% · Other 1.6%
- 2008→2024 swing
- +3.9pp toward D · 2008: 1.6pp · 2024: 5.5pp
- All cycles
- 2024: D+5.5 2020: D+13.3 2016: D+12.4 2012: D+0.1 2008: D+1.6
Not yet ingested
- Civics
- —
Market trends
- HPI YoY
- ▼ -8.59%
- Current HPI
- 472.03
- Rent YoY
- —
- Metro
- Houston-The Woodlands-Sugar Land, TX
- State GDP YoY
- ▲ 3.95%
- F500 in state
- 110
Industry mix (Fortune 500 HQ in TX)
| Industry | F500 HQs | Revenue |
|---|---|---|
| Energy | 16 | $1,198B |
|
||
| Technology | 5 | $198B |
|
||
| Engineering / Construction | 4 | $72B |
|
||
| Energy Services | 3 | $60B |
|
||
| Utilities | 3 | $41B |
|
||
| Healthcare | 2 | $330B |
|
||
Price history
-20.2% since first listed35 events — show timeline
- 2026-05-14 Price Changed $199,500 HARMLS
- 2026-04-16 Price Changed $199,995 HARMLS
- 2026-04-08 Price Changed $208,995 HARMLS
- 2026-03-31 Price Changed $209,995 HARMLS
- 2026-03-28 Price Changed $218,500 HARMLS
- 2026-03-23 Price Changed $219,995 HARMLS
- 2026-02-07 Listed $239,995 HARMLS
- 2025-02-16 Listing Removed — HARMLS
- 2025-02-09 Price Changed $239,995 HARMLS
- 2025-02-07 Rental Removed $1,500 HARMLS
- 2025-01-10 Price Changed $1,500 HARMLS
- 2025-01-10 Price Changed $1,495 HARMLS
- 2025-01-09 Price Changed $1,500 HARMLS
- 2024-12-18 Listed for Rent $1,495 HARMLS
- 2024-12-17 Listed $249,995 HARMLS
- 2024-12-16 Listing Removed — HARMLS
- 2024-12-05 Price Changed $249,995 HARMLS
- 2024-11-26 Price Changed $259,995 HARMLS
- 2024-09-11 Price Changed $279,995 HARMLS
- 2024-08-22 Listed $299,995 HARMLS
- 2023-07-06 Sold (MLS) — HARMLS
- 2023-07-05 Pending — HARMLS
- 2023-07-03 Pending — HARMLS
- 2023-03-06 Listed $249,995 HARMLS
- 2023-02-28 Listing Removed — HARMLS
- 2022-12-15 Price Changed $239,995 HARMLS
- 2022-12-09 Price Changed $244,995 HARMLS
- 2022-11-28 Listed $249,995 HARMLS
- 2022-11-17 Listing Removed — HARMLS
- 2022-09-28 Relisted — HARMLS
- 2022-06-15 Listing Removed — HARMLS
- 2022-06-15 Price Changed $249,995 HARMLS
- 2022-06-10 Price Changed $239,995 HARMLS
- 2022-05-21 Listed $249,995 HARMLS
- 1990-02-27 Sold (Public Records) — Public Records
Property tax history
+9.4%/yrLatest (2025): $4,770 · +1.0% YoY. Source: county tax records.
Cash-flow waterfall
monthlySold comps — $/sqft
last 12 mo · ≤1 miLoading sold comps…