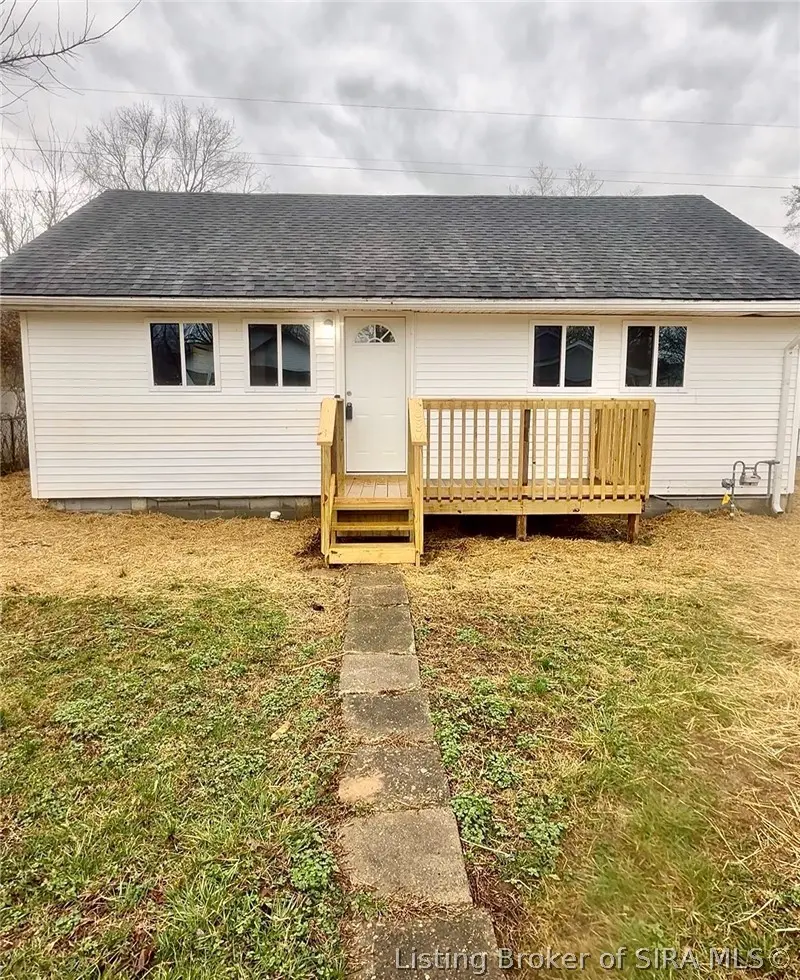
321 Halcyon Rd · Charlestown, IN
Flood risk 3/10 · Minor
- FEMA flood zone
- X (unshaded)
- Chance of flooding over 30 yrs
- 0.2%
- Est. flood insurance / yr
- $507 – $1,088
Fire risk 1/10 · Minimal
- Est. fire insurance / yr
- $717 – $1,331
Heat risk 4/10 · Minor
- Hot days now (above 104°F)
- 7 days/yr
- Hot days in 30 yrs
- 20 days/yr
Wind risk 2/10 · Minimal
- Chance of severe wind over 30 yrs
- 2.0%
Air-quality risk 2/10 · Minimal
- Unhealthy air days now
- 1 days/yr
- Unhealthy air days in 30 yrs
- 3 days/yr
Risk factors via First Street. Map © Google.
Why this score? — see what drove the C- grade
The composite is a weighted blend of 9 inputs, each scored 0–100. Each bar is that input's sub-score; the figure is the points it added to the 100-point composite (weight × sub-score).
- Cash flow +18.4/30.0
- ARV discount +13.8/15.0
- DSCR +5.8/10.0
- 1% rule +3.7/10.0
- Livability +3.2/5.0
- Schools +2.7/10.0
- Rent growth +2.5/5.0
- Condition / age +2.5/5.0
- Appreciation +0.0/10.0
$174,900
🖨 Deal sheet 📄 Offer letter ✓ Due diligence
Listing remarks MLS
Here’s a great opportunity to own this recently renovated home in Charlestown Indiana. Brand new roof, AC unit, furnace, water heater, all new LVP flooring, new carpet, cabinets and countertops, interior paint, brand new windows, and new garage doors. Three rooms that can be used as bedrooms, one large living room connected to the eat-in kitchen. Larger partially fenced in yard. This home will qualify for USDA no money down to those who qualify. Listing agent is seller.
Key facts
- New ac unit
- New furnace
- New water heater
Tags
Neighborhood map
What this means for you Summary
Snapshot
- This is a 3-bed/1.0-bath single-family listed at $175k.
Deal economics
- At list price, monthly cash flow is $162 ($2k/yr) — positive.
- The deal already cash-flows at list — no discount required.
- To meet the 1% rule (rent ≥ 1% of price), the offer needs to be $151k (13.4% below list).
- Recommended offer: $151k (13.4% below list) — sets the bar for 1% rule.
- Cap rate 7.4% vs local median 3.2% in Charlestown — top-decile yield for the area; either an underpriced asset or a hidden risk that comps aren't pricing in. Stress-test before assuming the spread holds.
Location & tenants
- Location reads 65/100 on livability (#352 in IN) — a middle-class / working-renter tenant base. Strengths: crime A+, cost of living A+, housing A+; Watch: schools D, amenities F, commute F.
- Greater Clark County Schools (suburban): math 26% / reading 37% proficiency, ranked #224 of 301 in IN (top 74%) — families likely to look elsewhere, expect single-tenant / working-renter base with shorter leases.
- Market conditions: 263 active listings in the ZIP; 1 comparable units currently listed for rent nearby; solid renter incomes; 911 units permitted in Clark County in 2024 (133 in 5+ unit buildings).
Forward outlook
- Local home prices are declining (-3.0%/yr); year-one equity from $1k of loan paydown is wiped out by about $5k of value loss. Plan a longer hold.
- Clark County population projected at +17% by 2050 — long-run rental-demand tailwind backs the buy-and-hold thesis.
Negotiation context
- It's been on market 103 days — a 9% lower offer ($159k) is reasonable based on typical stale-listing flexibility.
- 2 sale attempts since 2y ago; this cycle's ask has dropped $15k (8%) from the opening price — seller is motivated, your offer sets the floor, not the list.
- Current owner paid $82k; list at $175k implies a 113% gain — meaningful room to come down on a strong offer.
Risks & watch-outs
- Watch-outs: built in 1943 — expect roof / HVAC / electrical / plumbing capex.
Questions for the listing agent
- It's been on market 103 days. Have you received any prior offers? Is the seller open to a 13% concession, seller financing, or rate buy-down credit?
- Built in 1943 — when were the roof, HVAC, electrical panel, plumbing, and water heater last replaced?
- Why hasn't it sold? Are there any deal-killer items the seller is aware of (foundation, flood, title, zoning, code violations)?
- Is there a deadline driving the sale (1031 exchange, divorce, estate, relocation)? That informs how much negotiation room exists.
- Schools are D-rated, which usually means shorter tenancies and higher turnover. Who's the typical renter profile here, and what's been the actual vacancy rate?
- What's the average days-on-market for RENTAL listings here right now (not sales)? A rising rental-DOM trend means longer vacancies and softer asking-rent achievability than the comps imply.
- What's the recent tenant-quality profile in this submarket — average credit score on applications, eviction rate, late-payment / NSF rate, and stable-employment percentage? A property-management company in the area should have these aggregated.
- How much new for-sale + rental construction is in the pipeline within 1–3 miles? Heavy new supply typically softens prices + rents 12–24 months out; constrained supply supports both.
Investment metrics
- 1% rule
- 0.87% ✗
- Cap rate
- 7.41%
- Cash-on-cash
- 3.98%
- DSCR
- 1.18
- GRM
- 9.6
CMA / ARV
- ARV (median comp)
- $203,405
- List price
- $174,900
- Delta
- -14.01%
- Verdict
- UNDERPRICED
- Comps
- 20 within 1.0 mi
Show comp detail 5 sales within ~0.75 mi
| Address | Dist | Beds/Ba | Sqft | Sold | Price | $/sf | Match |
|---|---|---|---|---|---|---|---|
| 15 Charles Pl | 0.34mi | 2/1.0 (-1) | 884 (+4%) | 7mo | $179,900 | $204 | 67 |
| 206 Taff St | 0.44mi | 3/1.0 | 900 (+6%) | 10mo | $190,000 | $211 | 62 |
| 626 Thompson St | 0.24mi | 2/1.0 (-1) | 816 (-4%) | 24mo | $152,000 | $186 | 57 |
| 207 Reynolds St | 0.41mi | 3/1.5 | 975 (+15%) | 0mo | $197,500 | $203 | 54 |
| 766 Oak St | 0.68mi | 2/1.0 (-1) | 864 (+2%) | 10mo | $163,000 | $189 | 53 |
Match score weights: distance 35% · size 25% · config 20% · recency 20%. Top-matched comps best support the ARV.
Projected returns pro-forma
-3.0% appreciation · 3.0% rent growth · sell at horizon
- IRR
- -10.1%
- Equity multiple
- 0.63×
- Total profit
- $-18,092
- Equity at exit
- $26,078
- IRR
- -0.8%
- Equity multiple
- 0.94×
- Total profit
- $-2,791
- Equity at exit
- $15,122
Cash invested: $48,972 (down + closing). Projections, not guarantees.
Landlord ↔ Tenant lean methodology
- Overall (STATE)
- 90 Strongly Landlord-Friendly
- State Indiana
- 90 Strongly Landlord-Friendly · R+11
- County
- — inherits STATE
- City
- — inherits STATE
ZIP-level market 47111
- Active inventory
- 263
- Price-to-rent
- 9.6×
Monthly cashflow live
- Estimated rent
- $1,515 medium interval (Pro) →
- Mortgage (P&I)
- −$917
- Tax from tax record
- −$44 /mo · $532/yr
- Insurance
- −$73
- HOA
- −$0
- Vacancy / Maint / Mgmt
- −$318
- Net cashflow
- $162
Break-even live
UW: 25.0% down · 7.5% · 30yr · 1.5% tax · 5.0% vac · 8.0% maint · 8.0% mgmt
Financing live
Cash to close
- Down payment
- $43,725
- Closing costs
- $5,247
- Reserves months
- —
- Total cash needed
- —
Loan-product check · same deal, 3 products live
Conventional
25% down · 7.5% · 30yr
- Down + closing
- —
- Monthly P&I
- —
- Monthly cashflow
- —
- DSCR
- —
- Eligible?
- —
Personal DTI + credit; lowest rate.
DSCR
20% down · 8.5% · 30yr
- Down + closing
- —
- Monthly P&I
- —
- Monthly cashflow
- —
- DSCR
- —
- Eligible?
- —
No personal income docs; deal must DSCR.
Hard money
10% down · 12.0% · 12mo
- Down + closing
- —
- Monthly P&I
- —
- Monthly cashflow
- —
- DSCR
- —
- Eligible?
- —
Short-term bridge; refi at stabilization.
Rent comps 1 comps
| Address | Beds | Baths | Sqft | Rent | $/sqft | DOM | Units | Dist |
|---|---|---|---|---|---|---|---|---|
| 1155 Indiana 62 Charlestown, IN | 1.0–2.0 | 1.0–2.0 | 993 | $1,550 | $1.56 | 1d | 152 | 0.66mi |
Listing history 19 events
-
2026-06-18days on market $174,900 Active 103 DOM
-
2026-06-17days on market $174,900 Active 102 DOM
-
2026-06-16days on market $174,900 Active 101 DOM
-
2026-06-15pricedays on market $174,900 Active 100 DOM
-
2026-06-13days on market $179,900 Active 98 DOM
-
2026-06-13days on market $179,900 Active 97 DOM
-
2026-06-10days on market $179,900 Active 95 DOM
-
2026-06-09days on market $179,900 Active 94 DOM
-
2026-06-08days on market $179,900 Active 93 DOM
-
2026-06-07days on market $179,900 Active 92 DOM
-
2026-06-03days on market $179,900 Active 88 DOM
-
2026-06-02days on market $179,900 Active 87 DOM
-
2026-06-01days on market $179,900 Active 86 DOM
-
2026-05-31days on market $179,900 Active 85 DOM
-
2026-03-28price $184,900 480-char remark
Show marketing remark (480 chars)
Here’s a great opportunity to own this recently renovated home in Charlestown Indiana. Brand new roof, AC unit, furnace, water heater, all new LVP flooring, new carpet, cabinets and countertops, interior paint, brand new windows, and new garage doors. Three rooms that can be used as bedrooms, one large living room connected to the eat-in kitchen. Larger partially fenced in yard. This home will qualify for USDA no money down to those who qualify. Listing agent is seller.
-
2026-03-06$189,900 Active 480-char remark
Show marketing remark (480 chars)
Here’s a great opportunity to own this recently renovated home in Charlestown Indiana. Brand new roof, AC unit, furnace, water heater, all new LVP flooring, new carpet, cabinets and countertops, interior paint, brand new windows, and new garage doors. Three rooms that can be used as bedrooms, one large living room connected to the eat-in kitchen. Larger partially fenced in yard. This home will qualify for USDA no money down to those who qualify. Listing agent is seller.
-
2025-04-07soldstatus $82,000 Closed 242-char remark
Show marketing remark (242 chars)
321 Halcyon Rd hosts tons of potential in Charlestown's growing, Pleasant Ridge neighborhood. This home with a fenced yard and detached garage is waiting for your creative touch. Property is to be sold AS-IS. Call to schedule a showing today!
-
2025-03-17historical 242-char remark
Show marketing remark (242 chars)
321 Halcyon Rd hosts tons of potential in Charlestown's growing, Pleasant Ridge neighborhood. This home with a fenced yard and detached garage is waiting for your creative touch. Property is to be sold AS-IS. Call to schedule a showing today!
-
2024-11-27$85,000 Active 242-char remark
Show marketing remark (242 chars)
321 Halcyon Rd hosts tons of potential in Charlestown's growing, Pleasant Ridge neighborhood. This home with a fenced yard and detached garage is waiting for your creative touch. Property is to be sold AS-IS. Call to schedule a showing today!
ⓘ Source: listings_history table (triggers on properties + properties_extension) + one-shot
backfill from property_details.listing_events for pre-trigger history.
Tax reassessment forecast IN · Partial reset (capped growth)
- Current annual tax
- $532 · $44/mo
- Projected year-2 tax
- $1,009 · $84/mo
- Expected delta
- +$477/yr (+$40/mo · 89.7%)
ⓘ Screening estimate from a state-policy table — verify with the county assessor before closing.
Climate risk First Street
- Flood 3/10 Moderate FEMA zone X (unshaded) · 20% chance over 30 yrs
- Wildfire 1/10 Low
- Heat 4/10 Moderate 7 d/yr ≥104°F today · 20 d/yr by 30 yrs out
- Wind 2/10 Low 2% chance of damaging wind over 30 yrs
- Air quality 2/10 Low 1 unhealthy d/yr today · 3 by 30 yrs out
Nearby sold comps map
Loading sold comps map…
Walkable amenities ~0.75 mi
Loading nearby amenities…
Taxation est. · year 1
- Rental income
- $18,177
- − Mortgage interest
- −$9,797
- − Property taxes
- −$532
- − Insurance
- −$874
- − Repairs & maintenance
- −$1,454
- − Management
- −$1,454
- − Depreciation
- −$5,088
- Taxable loss
- −$1,023
- Est. tax savings @ 24.0%
- +$246
- After-tax cash flow
- $2,192/yr
For passive investors: Depreciation is non-cash, so a rental often shows a tax loss while cash-flowing — sheltering income. Rental losses are passive: they offset passive income freely, and up to $25,000/yr can offset ordinary (W-2) income if you actively participate and your MAGI is under $100k (phasing out to $0 by $150k); unused losses carry forward. On sale, claimed depreciation is recaptured at up to 25%, and gains may owe capital-gains tax (a 1031 exchange can defer both). Figures are a year-1 estimate at your 24.0% rate — not tax advice; consult a CPA.
Schools (NCES district)
- District
- Greater Clark County Schools
- NCES district ID
- 1803940
- Math proficiency
- 26% ▼ -15.00%
- Reading proficiency
- 37% ▼ -13.00%
- Median HH income
- $47,838
- Composite
- 27.2/100
- National rank
- #7020
- State rank
- #224 of 301 in IN
Livability — Charlestown
- Score
- 65/100
- State rank
- #352
- US rank
- #13430
Category grades
Schools grade is shown separately in the Schools card above.
Census & demographics
- Census place
- Charlestown, IN
- County
- Clark County · 108,879 people
- City population
- 17,738
- Metro
- Louisville/Jefferson County, KY-IN
- Population (ZIP)
- 17,738
- Household income
- $95,376
- Rent vs Own
- Severe rent burden
- 151.0
Population outlook (Clark County) Hauer SSP2
- Today (2025)
- 126,401 people
- By 2030
- 131,455 · +4.0%
- By 2040
- 140,471 · +11.1%
- By 2050
- 147,677 · +16.8%
- By 2075
- 161,702 · +27.9%
- By 2100
- 164,078 · +29.8%
Race, ethnicity, and origin ACS 2023
- Neighborhood character
- Predominantly White (87%)
- Race & ethnicity
- White 87% Two or more races 5% Hispanic / Latino 4% Black 3%
- Common ancestry
- Italian 2% Lithuanian 2% Romanian 2%
- Foreign-born
- 3% · Canada, China
- Languages at home
- 95% English-only · Spanish 3% Chinese 1%
Political lean MEDSL · Clark
- 2024 margin
- Strong R (+20.4) · D 38.9% · R 59.3% · Other 1.8%
- 2008→2024 swing
- -13.3pp toward R · 2008: -7.1pp · 2024: -20.4pp
- All cycles
- 2024: R+20.4 2020: R+18.3 2016: R+22.0 2012: R+9.9 2008: R+7.1
Not yet ingested
- Civics
- —
Market trends
- HPI YoY
- ▼ -126.16%
- Current HPI
- 198.7046
- Rent YoY
- —
- Metro
- Louisville/Jefferson County, KY-IN
- State GDP YoY
- ▲ 2.90%
- F500 in state
- 18
Industry mix (Fortune 500 HQ in IN)
| Industry | F500 HQs | Revenue |
|---|---|---|
| Industrial Machinery | 2 | $37B |
|
||
| Healthcare | 1 | $177B |
|
||
| Pharmaceuticals | 1 | $45B |
|
||
| Metals / Steel | 1 | $18B |
|
||
| Agriculture | 1 | $17B |
|
||
| Packaging | 1 | $12B |
|
||
Price history
+117.5% since first listed5 events — show timeline
- 2026-03-28 Price Changed $184,900 SIRA
- 2026-03-06 Listed $189,900 SIRA
- 2025-04-07 Sold (MLS) $82,000 SIRA
- 2025-03-17 Delisted — SIRA
- 2024-11-27 Listed $85,000 SIRA
Property tax history
-7.7%/yrLatest (2024): $532 · +4.3% YoY. Source: county tax records.
Cash-flow waterfall
monthlySold comps — $/sqft
last 12 mo · ≤1 miLoading sold comps…