 Multi-family
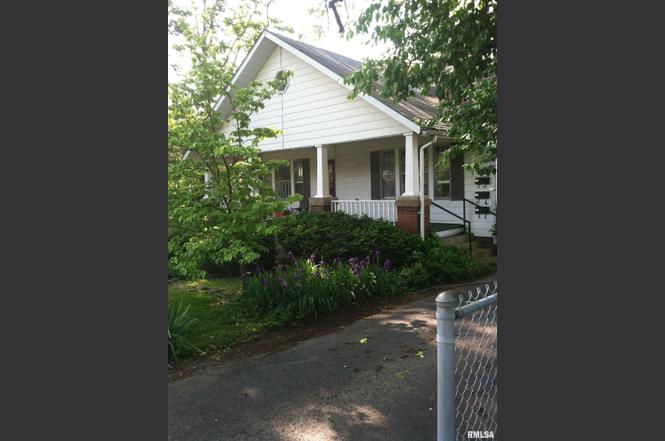
607 W Main St · Carbondale, IL
Flood risk No data
- FEMA flood zone
- —
- Chance of flooding over 30 yrs
- —
- Est. flood insurance / yr
- —
Fire risk No data
- Est. fire insurance / yr
- —
Heat risk No data
- Hot days now (above threshold)
- —
- Hot days in 30 yrs
- —
Wind risk No data
- Chance of severe wind over 30 yrs
- —
Air-quality risk No data
- Unhealthy air days now
- —
- Unhealthy air days in 30 yrs
- —
Risk factors via First Street. Map © Google.
Why this score? — see what drove the B- grade
The composite is a weighted blend of 9 inputs, each scored 0–100. Each bar is that input's sub-score; the figure is the points it added to the 100-point composite (weight × sub-score).
- Cash flow +30.0/30.0
- 1% rule +10.0/10.0
- DSCR +10.0/10.0
- ARV discount +6.9/15.0
- Rent growth +3.6/5.0
- Livability +3.5/5.0
- Condition / age +2.5/5.0
- Schools +2.4/10.0
- Appreciation +0.0/10.0
$99,000
🖨 Deal sheet (PDF) 📄 Offer letter ✓ Due diligence
Multi-family units
County records classify this as Multi-Family (2-4 Unit). Listing-text estimate: 1 unit. estimate disagrees with records
Key facts
- 0.23 acre lot
- 8 parking spots
- Built 1925
Property features AI
Finance
- Financial info: Three-unit investment property with current rents listed: Unit 1 $600, Unit 2 $500, Unit 3 $700
Exterior
- Parking: Total of 8 parking spaces on-site; Parking pads; Each unit is assigned two parking spaces
- Utilities: Public water; Public sewer
- Home design: Residential income property (conversion); Built in 1925
- Construction: Shingle roof; Total building area approximately 1656
- Exterior features: Level lot
Interior
- Bedrooms: Three units: two 2-bedroom units and one 1-bedroom unit
- Bathrooms: Each unit has one full bathroom
- Interior features: Partial, unfinished basement
- Laundry & utility: No on-site laundry listed
Neighborhood map
What this means for you Summary
Snapshot
- This is a 5-bed/3.0-bath multifamily listed at $99k.
Deal economics
- At list price, monthly cash flow is $538 ($6k/yr) — positive.
- The deal already cash-flows at list — no discount required.
- Meets the 1% rule at list price ($2k rent vs $99k).
- Recommended offer: $87k (12.0% below list) — sets the bar for market timing.
- Cap rate 12.8% vs local median 4.9% in Carbondale — top-decile yield for the area; either an underpriced asset or a hidden risk that comps aren't pricing in. Stress-test before assuming the spread holds.
Location & tenants
- Location reads 70/100 on livability (#375 in IL) — a middle-class / working-renter tenant base. Strengths: amenities A+, commute A+, cost of living A+; Watch: housing C-, crime F, employment F.
- Carbondale Chsd 165 (urban): math 26% / reading 35% proficiency, ranked #279 of 620 in IL (top 45%) — families likely to look elsewhere, expect single-tenant / working-renter base with shorter leases.
- Zoned schools: Carbondale Comm H S (math 26% / reading 35%, grade F, #175 of 693 statewide, top 26%, 997 students, 0% FRL).
- Market conditions: Rents rising fast (+4.5%/yr); 202 active listings in the ZIP; lower-income renter base — watch delinquency; 5 units permitted in Jackson County in 2024 (0 in 5+ unit buildings).
- At $1,547/mo this rent would consume 53% of the median local household income ($35k/yr) (locally 2038% of renters already pay >50% of income on rent) — very limited rent-growth headroom before tenants either downsize or default.
Forward outlook
- Local home prices are declining (-3.0%/yr); year-one equity from $684 of loan paydown is wiped out by about $3k of value loss. Plan a longer hold.
- At projected returns (-3.0% appreciation + 4.5% rent growth), your $28k cash investment doubles in ~5 years — after that, you're playing with house money.
Negotiation context
- It's been on market 149 days — a 12% lower offer ($87k) is reasonable based on typical stale-listing flexibility.
- 3 sale attempts; this cycle's ask has dropped $20k (17%) from the opening price — seller is motivated, your offer sets the floor, not the list.
Risks & watch-outs
- Watch-outs: built in 1925 — expect roof / HVAC / electrical / plumbing capex.
Questions for the listing agent
- It's been on market 149 days. Have you received any prior offers? Is the seller open to a 12% concession, seller financing, or rate buy-down credit?
- Built in 1925 — when were the roof, HVAC, electrical panel, plumbing, and water heater last replaced?
- Why hasn't it sold? Are there any deal-killer items the seller is aware of (foundation, flood, title, zoning, code violations)?
- Is there a deadline driving the sale (1031 exchange, divorce, estate, relocation)? That informs how much negotiation room exists.
- Schools are D-rated, which usually means shorter tenancies and higher turnover. Who's the typical renter profile here, and what's been the actual vacancy rate?
- Crime grade is F in this area — have there been break-ins, vandalism, or insurance claims at this property in the last 3 years? What carrier currently insures it and at what premium?
- What's the average days-on-market for RENTAL listings here right now (not sales)? A rising rental-DOM trend means longer vacancies and softer asking-rent achievability than the comps imply.
- What's the recent tenant-quality profile in this submarket — average credit score on applications, eviction rate, late-payment / NSF rate, and stable-employment percentage? A property-management company in the area should have these aggregated.
- How much new apartment / multifamily construction is in the pipeline within 1–3 miles? Heavy new supply (>2% of stock underway) typically softens rents 12–24 months out; light construction supports rent growth.
Investment metrics
- 1% rule
- 1.56% ✓
- Cap rate
- 12.81%
- Cash-on-cash
- 23.29%
- DSCR
- 2.04
- GRM
- 5.3
CMA / ARV
- ARV (on-the-fly)
- $97,704
- Comps found
- 6
Show comp detail 6 sales within ~0.75 mi
| Address | Dist | Beds/Ba | Sqft | Sold | Price | $/sf | Match |
|---|---|---|---|---|---|---|---|
| 301 N Springer St | 0.18mi | 5/3.0 | 1,633 (-1%) | 21mo | $60,000 | $37 | 72 |
| 304 E College St | 0.68mi | 5/3.0 | 1,750 (+6%) | 7mo | $119,000 | $68 | 53 |
| 413 S Washington St | 0.56mi | 5/2.0 | 1,584 (-4%) | 16mo | $25,000 | $16 | 49 |
| 612 N Bridge St | 0.41mi | 5/2.0 | 1,476 (-11%) | 13mo | $69,000 | $47 | 48 |
| 1207 W Freeman St | 0.53mi | 4/2.0 (-1) | 1,740 (+5%) | 15mo | $150,000 | $86 | 45 |
| 517 N Oakland Ave | 0.44mi | 5/2.0 | 1,434 (-13%) | 10mo | $84,900 | $59 | 45 |
Match score weights: distance 35% · size 25% · config 20% · recency 20%. Top-matched comps best support the ARV.
Projected returns pro-forma
-3.0% appreciation · 4.51% rent growth · sell at horizon
- IRR
- 18.0%
- Equity multiple
- 1.74×
- Total profit
- $20,630
- Equity at exit
- $14,761
- IRR
- 27.5%
- Equity multiple
- 3.61×
- Total profit
- $72,274
- Equity at exit
- $8,560
Cash invested: $27,720 (down + closing). Projections, not guarantees.
Landlord ↔ Tenant lean methodology
- Overall (STATE)
- 43 Moderately Tenant-Leaning
- State Illinois
- 43 Moderately Tenant-Leaning · D+7
- County
- — inherits STATE
- City
- — inherits STATE
ZIP-level market 62901
- Rents YoY
- 4.5%
- Active inventory
- 202
- Price-to-rent
- 10.7×
Monthly cashflow live
- Estimated rent
- $1,547 medium interval (Pro) →
- Mortgage (P&I)
- −$519
- Tax est. 1.5%
- −$124 /mo · $1,485/yr
- Insurance
- −$41
- HOA
- −$0
- Vacancy / Maint / Mgmt
- −$325
- Net cashflow
- $538
Break-even live
Sensitivity live
| Price | -10% $606 | -5% $572 | +0% $538 | +5% $504 | +10% $470 |
|---|---|---|---|---|---|
| Rent | -10% $416 | -5% $477 | +0% $538 | +5% $599 | +10% $660 |
| Rate | -1.0pp $588 | -0.5pp $563 | base $538 | +0.5pp $512 | +1.0pp $486 |
2-unit breakdown (identical units grouped — click to expand)
| Units | Beds | Baths | Est. rent |
|---|---|---|---|
| 2× units | 2 | 1.5 | $1,548 |
| #1 | 2 | 1.5 | $774 |
| #2 | 2 | 1.5 | $774 |
| Total (2 units) | $1,547 | ||
UW: 25.0% down · 7.5% · 30yr · 1.5% tax · 5.0% vac · 8.0% maint · 8.0% mgmt
Financing live
Cash to close
- Down payment
- $24,750
- Closing costs
- $2,970
- Reserves months
- —
- Total cash needed
- —
Loan-product check · same deal, 3 products live
Conventional
25% down · 7.5% · 30yr
- Down + closing
- —
- Monthly P&I
- —
- Monthly cashflow
- —
- DSCR
- —
- Eligible?
- —
Personal DTI + credit; lowest rate.
DSCR
20% down · 8.5% · 30yr
- Down + closing
- —
- Monthly P&I
- —
- Monthly cashflow
- —
- DSCR
- —
- Eligible?
- —
No personal income docs; deal must DSCR.
Hard money
10% down · 12.0% · 12mo
- Down + closing
- —
- Monthly P&I
- —
- Monthly cashflow
- —
- DSCR
- —
- Eligible?
- —
Short-term bridge; refi at stabilization.
Listing history 29 events
-
2026-06-19days on market $99,000 Active 149 DOM
-
2026-06-18days on market $99,000 Active 148 DOM
-
2026-06-17days on market $99,000 Active 147 DOM
-
2026-06-16days on market $99,000 Active 146 DOM
-
2026-06-15days on market $99,000 Active 145 DOM
-
2026-06-14days on market $99,000 Active 143 DOM
-
2026-06-13days on market $99,000 Active 142 DOM
-
2026-06-10days on market $99,000 Active 140 DOM
-
2026-06-09days on market $99,000 Active 139 DOM
-
2026-06-08days on market $99,000 Active 138 DOM
-
2026-06-07days on market $99,000 Active 137 DOM
-
2026-06-02days on market $99,000 Active 132 DOM
-
2026-06-01days on market $99,000 Active 131 DOM
-
2026-05-31days on market $99,000 Active 130 DOM
-
2026-05-30days on market $99,000 Active 129 DOM
-
2026-03-26price $99,000
-
2026-01-18historical Contingent - Continue to Show
-
2026-01-14historical
-
2025-10-29historical Under Contract
-
2025-10-28historical
-
2025-10-28historical
-
2025-10-06price
-
2025-04-14Active
-
2025-04-01historical
-
2025-03-31historical
-
2025-03-12Active
-
2025-03-11$119,000 Active
-
2025-03-11historical
-
2024-03-11historical
ⓘ Source: listings_history table (triggers on properties + properties_extension) + one-shot
backfill from property_details.listing_events for pre-trigger history.
Nearby sold comps map
Loading sold comps map…
Walkable amenities ~0.75 mi
Loading nearby amenities…
Taxation est. · year 1
- Rental income
- $18,564
- − Mortgage interest
- −$5,546
- − Property taxes
- −$1,485
- − Insurance
- −$495
- − Repairs & maintenance
- −$1,485
- − Management
- −$1,485
- − Depreciation
- −$2,880
- Taxable income
- $5,188
- Est. tax owed @ 24.0%
- −$1,245
- After-tax cash flow
- $5,210/yr
For passive investors: Depreciation is non-cash, so a rental often shows a tax loss while cash-flowing — sheltering income. Rental losses are passive: they offset passive income freely, and up to $25,000/yr can offset ordinary (W-2) income if you actively participate and your MAGI is under $100k (phasing out to $0 by $150k); unused losses carry forward. On sale, claimed depreciation is recaptured at up to 25%, and gains may owe capital-gains tax (a 1031 exchange can defer both). Figures are a year-1 estimate at your 24.0% rate — not tax advice; consult a CPA.
Schools (NCES district)
- District
- Carbondale Chsd 165
- NCES district ID
- 1708370
- Math proficiency
- 26% ▼ -10.00%
- Reading proficiency
- 35% ▼ -2.00%
- Median HH income
- $22,075
- Composite
- 23.92/100
- National rank
- #7787
- State rank
- #279 of 620 in IL
Livability — Carbondale
- Score
- 70/100
- State rank
- #375
- US rank
- #7806
Category grades
Schools grade is shown separately in the Schools card above.
Census & demographics
- Census place
- Carbondale, IL
- County
- Jackson County · 22,946 people
- City population
- 22,946
- Metro
- Carbondale-Marion, IL
- Population (ZIP)
- 22,946
- Household income
- $35,089
- Rent vs Own
- Severe rent burden
- 2038.0
Population outlook (Jackson County) Hauer SSP2
- Today (2025)
- 59,093 people
- By 2030
- 59,628 · +0.9%
- By 2040
- 59,495 · +0.7%
- By 2050
- 58,811 · -0.5%
- By 2075
- 57,683 · -2.4%
- By 2100
- 55,337 · -6.4%
Race, ethnicity, and origin ACS 2023
- Neighborhood character
- Diverse neighborhood (Simpson 0.58)
- Race & ethnicity
- White 59% Black 26% Asian 6% Hispanic / Latino 5% Two or more races 5%
- Hispanic origin (detail)
- Mexican 4%
- Common ancestry
- Romanian 2% Italian 2% Slovak 2%
- Foreign-born
- 9% · Canada, China, South Korea
- Languages at home
- 87% English-only · Other Indo-European 4% Spanish 4% Arabic 2%
Political lean MEDSL · Jackson
- 2024 margin
- Toss-up / Even · D 51.0% · R 47.5% · Other 1.4%
- 2008→2024 swing
- -18.3pp toward R · 2008: 21.8pp · 2024: 3.5pp
- All cycles
- 2024: D+3.5 2020: D+1.3 2016: D+3.0 2012: D+10.3 2008: D+21.8
Not yet ingested
- Civics
- —
Market trends
- HPI YoY
- ▼ -75.62%
- Current HPI
- 88.7209
- Rent YoY
- ▲ 4.51%
- Metro
- Carbondale-Marion, IL
- State GDP YoY
- ▲ 1.59%
- F500 in state
- 60
Industry mix (Fortune 500 HQ in IL)
| Industry | F500 HQs | Revenue |
|---|---|---|
| Insurance | 4 | $201B |
|
||
| Consumer Goods | 4 | $87B |
|
||
| Industrial Machinery | 3 | $64B |
|
||
| Healthcare | 2 | $55B |
|
||
| Retail / Pharmacy | 1 | $148B |
|
||
| Agriculture / Food | 1 | $86B |
|
||
Price history
-16.8% since first listed14 events — show timeline
- 2026-03-26 Price Changed $99,000 RMLSA as Distributed by MLS Grid
- 2026-01-18 Contingent — MRED as Distributed by MLS Grid
- 2026-01-14 Listing Removed — MRED as Distributed by MLS Grid
- 2025-10-29 Contingent — RMLSA as Distributed by MLS Grid
- 2025-10-28 Listing Removed — RMLSA as Distributed by MLS Grid
- 2025-10-28 Listing Removed — MRED as Distributed by MLS Grid
- 2025-10-06 Price Changed — RMLSA as Distributed by MLS Grid
- 2025-04-14 Listed — RMLSA as Distributed by MLS Grid
- 2025-04-01 Listing Removed — RMLSA as Distributed by MLS Grid
- 2025-03-31 Listing Removed — MRED as Distributed by MLS Grid
- 2025-03-12 Listed — RMLSA as Distributed by MLS Grid
- 2025-03-11 Listing Removed — MRED as Distributed by MLS Grid
- 2025-03-11 Listed $119,000 RMLSA as Distributed by MLS Grid
- 2024-03-11 Listing Removed — MRED as Distributed by MLS Grid
Cash-flow waterfall
monthlySold comps — $/sqft
last 12 mo · ≤1 miLoading sold comps…