 Multi-family
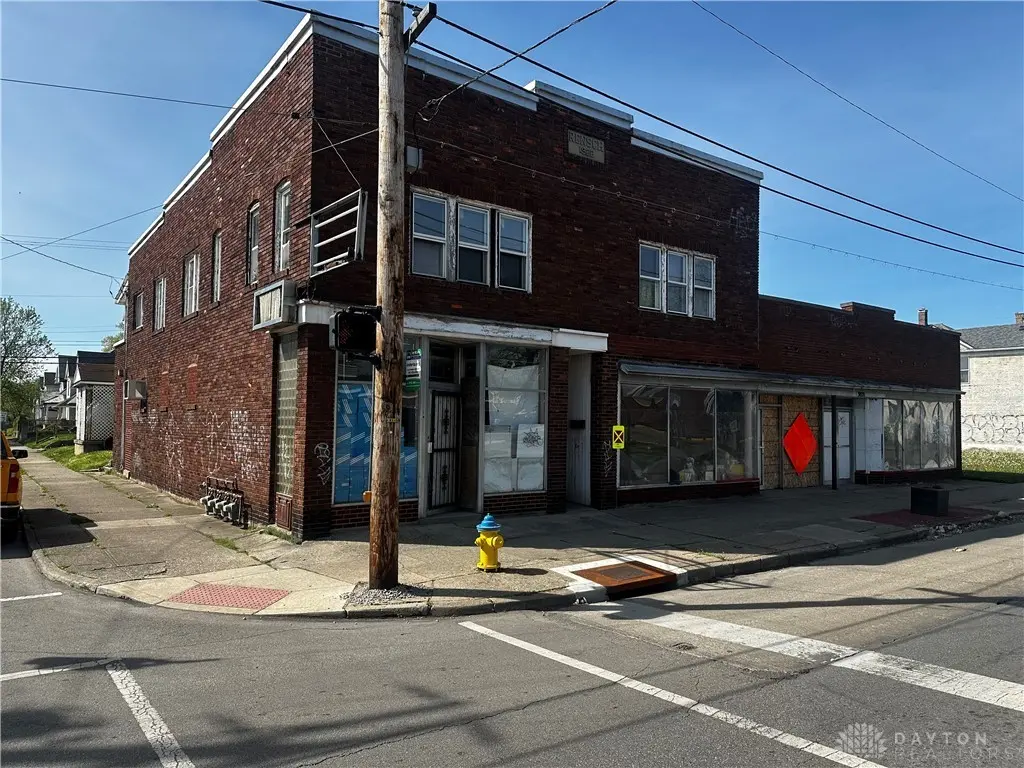
3020 E 3rd St · Dayton, OH
Flood risk 3/10 · Minor
- FEMA flood zone
- X (unshaded)
- Chance of flooding over 30 yrs
- 0.2%
- Est. flood insurance / yr
- $473 – $860
Fire risk 1/10 · Minimal
- Est. fire insurance / yr
- $713 – $1,323
Heat risk 4/10 · Minor
- Hot days now (above 101°F)
- 7 days/yr
- Hot days in 30 yrs
- 18 days/yr
Wind risk 2/10 · Minimal
- Chance of severe wind over 30 yrs
- 1.0%
Air-quality risk 3/10 · Minor
- Unhealthy air days now
- 2 days/yr
- Unhealthy air days in 30 yrs
- 4 days/yr
Risk factors via First Street. Map © Google.
Why this score? — see what drove the B grade
The composite is a weighted blend of 9 inputs, each scored 0–100. Each bar is that input's sub-score; the figure is the points it added to the 100-point composite (weight × sub-score).
- Cash flow +30.0/30.0
- ARV discount +11.5/15.0
- 1% rule +10.0/10.0
- DSCR +10.0/10.0
- Rent growth +3.4/5.0
- Livability +3.2/5.0
- Schools +1.3/10.0
- Condition / age +1.0/5.0
- Appreciation +0.0/10.0
$224,000
🖨 Deal sheet 📄 Offer letter ✓ Due diligence
Multi-family units
County records classify this as Multi-Family (2-4 Unit). Listing-text estimate: 1 unit. estimate disagrees with records
Listing remarks MLS
AGENT OWNED 3020 - 3030 E Third St (Parcels R72-04705-0002 and R72-04705-0003) offer limitless possibilities for investors. Full extensive rehab required. Three apartments upstairs and two store fronts along a very busy E Third St. Selling "as is". Utilize ShowingTime for showings.
Key facts
- 3,646 sq ft lot
- Built 1922
- Listed 219 days
Neighborhood map
What this means for you Summary
Snapshot
- This is a 3-bed/4.0-bath multifamily listed at $224k. Condition is rated poor.
Deal economics
- At list price, monthly cash flow is $3k ($31k/yr) — positive.
- The deal already cash-flows at list — no discount required.
- Meets the 1% rule at list price ($5k rent vs $224k).
- Recommended offer: $197k (12.0% below list) — sets the bar for market timing.
- Cap rate 19.9% vs local median 7.4% in Dayton — top-decile yield for the area; either an underpriced asset or a hidden risk that comps aren't pricing in. Stress-test before assuming the spread holds.
Location & tenants
- Location reads 65/100 on livability (#716 in OH) — a middle-class / working-renter tenant base. Strengths: cost of living A+, housing A+, health & safety A; Watch: schools C-, amenities C-, crime F.
- Dayton City (urban): math 12% / reading 21% proficiency, ranked #641 of 656 in OH (top 98%) — low school quality limits family demand, transient renter base, plan for 1-2y turnover; 74% free/reduced lunch — lower-income household profile, screen leases tightly.
- Market conditions: Rents rising (+3.7%/yr); 77 active listings in the ZIP; 2 comparable units currently listed for rent nearby; lower-income renter base — watch delinquency; 907 units permitted in Montgomery County in 2024 (416 in 5+ unit buildings).
- At $5,181/mo this rent would consume 162% of the median local household income ($38k/yr) (locally 1071% of renters already pay >50% of income on rent) — very limited rent-growth headroom before tenants either downsize or default.
Forward outlook
- Local home prices are declining (-3.0%/yr); year-one equity from $2k of loan paydown is wiped out by about $7k of value loss. Plan a longer hold.
- Montgomery County population projected at -10% by 2050 — secular population decline; favor cash flow + early exit over multi-decade hold.
- At projected returns (-3.0% appreciation + 3.7% rent growth), your $63k cash investment doubles in ~3 years — after that, you're playing with house money.
Negotiation context
- It's been on market 219 days — a 12% lower offer ($197k) is reasonable based on typical stale-listing flexibility.
- 3 sale attempts with the ask held roughly flat each time — persistent listings suggest the price (not the market) is what's stuck; bring a comps-based counter.
Risks & watch-outs
- Watch-outs: built in 1922 — expect roof / HVAC / electrical / plumbing capex.
Questions for the listing agent
- It's been on market 219 days. Have you received any prior offers? Is the seller open to a 12% concession, seller financing, or rate buy-down credit?
- Have any recent inspections been done? Can we get a copy of the seller's disclosures and any deferred-maintenance estimates?
- Built in 1922 — when were the roof, HVAC, electrical panel, plumbing, and water heater last replaced?
- Why hasn't it sold? Are there any deal-killer items the seller is aware of (foundation, flood, title, zoning, code violations)?
- Is there a deadline driving the sale (1031 exchange, divorce, estate, relocation)? That informs how much negotiation room exists.
- Crime grade is F in this area — have there been break-ins, vandalism, or insurance claims at this property in the last 3 years? What carrier currently insures it and at what premium?
- What's the average days-on-market for RENTAL listings here right now (not sales)? A rising rental-DOM trend means longer vacancies and softer asking-rent achievability than the comps imply.
- What's the recent tenant-quality profile in this submarket — average credit score on applications, eviction rate, late-payment / NSF rate, and stable-employment percentage? A property-management company in the area should have these aggregated.
- How much new apartment / multifamily construction is in the pipeline within 1–3 miles? Heavy new supply (>2% of stock underway) typically softens rents 12–24 months out; light construction supports rent growth.
Investment metrics
- 1% rule
- 2.31% ✓
- Cap rate
- 19.93%
- Cash-on-cash
- 48.69%
- DSCR
- 3.17
- GRM
- 3.6
CMA / ARV
- ARV (median comp)
- $245,807
- List price
- $224,000
- Delta
- -8.87%
- Verdict
- FAIR
- Comps
- 10 within 1.0 mi
Projected returns pro-forma
-3.0% appreciation · 3.71% rent growth · sell at horizon
- IRR
- 47.1%
- Equity multiple
- 3.07×
- Total profit
- $129,599
- Equity at exit
- $33,399
- IRR
- 53.1%
- Equity multiple
- 6.38×
- Total profit
- $337,405
- Equity at exit
- $19,367
Cash invested: $62,720 (down + closing). Projections, not guarantees.
Landlord ↔ Tenant lean methodology
- Overall (STATE)
- 73 Landlord-Friendly
- State Ohio
- 73 Landlord-Friendly · R+6
- County
- — inherits STATE
- City
- — inherits STATE
ZIP-level market 45403
- Home prices YoY
- -3.7%
- Rents YoY
- 3.7%
- Active inventory
- 77
- Price-to-rent
- 16.9×
Monthly cashflow live
- Estimated rent
- $5,181 high interval (Pro) →
- Mortgage (P&I)
- −$1,175
- Tax est. 1.5%
- −$280 /mo · $3,360/yr
- Insurance
- −$93
- HOA
- −$0
- Vacancy / Maint / Mgmt
- −$1,088
- Net cashflow
- $2,545
Break-even live
5-unit breakdown (identical units grouped — click to expand)
| Units | Beds | Baths | Est. rent |
|---|---|---|---|
| 3× units | 3 | 1.5 | $3,309 |
| #1 | 3 | 1.5 | $1,103 |
| #2 | 3 | 1.5 | $1,103 |
| #3 | 3 | 1.5 | $1,103 |
| 2× units | 1 | 0.5 | $1,872 |
| #4 | 1 | 0.5 | $936 |
| #5 | 1 | 0.5 | $936 |
| Total (5 units) | $5,181 | ||
UW: 25.0% down · 7.5% · 30yr · 1.5% tax · 5.0% vac · 8.0% maint · 8.0% mgmt
Financing live
Cash to close
- Down payment
- $56,000
- Closing costs
- $6,720
- Reserves months
- —
- Total cash needed
- —
Loan-product check · same deal, 3 products live
Conventional
25% down · 7.5% · 30yr
- Down + closing
- —
- Monthly P&I
- —
- Monthly cashflow
- —
- DSCR
- —
- Eligible?
- —
Personal DTI + credit; lowest rate.
DSCR
20% down · 8.5% · 30yr
- Down + closing
- —
- Monthly P&I
- —
- Monthly cashflow
- —
- DSCR
- —
- Eligible?
- —
No personal income docs; deal must DSCR.
Hard money
10% down · 12.0% · 12mo
- Down + closing
- —
- Monthly P&I
- —
- Monthly cashflow
- —
- DSCR
- —
- Eligible?
- —
Short-term bridge; refi at stabilization.
Rent comps 2 comps
| Address | Beds | Baths | Sqft | Rent | $/sqft | DOM | Units | Dist |
|---|---|---|---|---|---|---|---|---|
| 33 Rita St Unit 33 Dayton, OH | 2.0 | 1.0 | 4794 | $895 | $0.19 | 23d | 1 | 1.17mi |
| 35 Rita St Unit 35 Dayton, OH | 2.0 | 1.0 | 4794 | $895 | $0.19 | 14d | 1 | 1.17mi |
Listing history 24 events
-
2026-06-18days on market $224,000 Active 219 DOM
-
2026-06-17days on market $224,000 Active 218 DOM
-
2026-06-16days on market $224,000 Active 217 DOM
-
2026-06-15days on market $224,000 Active 216 DOM
-
2026-06-14days on market $224,000 Active 214 DOM
-
2026-06-13days on market $224,000 Active 213 DOM
-
2026-06-10days on market $224,000 Active 211 DOM
-
2026-06-09days on market $224,000 Active 210 DOM
-
2026-06-08days on market $224,000 Active 209 DOM
-
2026-06-07days on market $224,000 Active 208 DOM
-
2026-06-05days on market $224,000 Active 205 DOM
-
2026-06-03days on market $224,000 Active 204 DOM
-
2026-06-02days on market $224,000 Active 203 DOM
-
2026-06-01days on market $224,000 Active 202 DOM
-
2026-05-31days on market $224,000 Active 201 DOM
-
2025-12-12price $224,000 292-char remark
Show marketing remark (292 chars)
AGENT OWNED 3020 - 3030 E Third St (Parcels R72-04705-0002 and R72-04705-0003) offer limitless possibilities for investors. Full extensive rehab required. Three apartments upstairs and two store fronts along a very busy E Third St. Selling "as is". Utilize ShowingTime for showings.
-
2025-11-11$225,000 Active 292-char remark
Show marketing remark (292 chars)
AGENT OWNED 3020 - 3030 E Third St (Parcels R72-04705-0002 and R72-04705-0003) offer limitless possibilities for investors. Full extensive rehab required. Three apartments upstairs and two store fronts along a very busy E Third St. Selling "as is". Utilize ShowingTime for showings.
-
2025-09-13historical
-
2025-08-26price $249,000
-
2025-08-19status Active
-
2025-08-10status Pending
-
2025-06-23price $269,000
-
2025-05-21price $289,000
-
2025-05-13$300,000 Active
ⓘ Source: listings_history table (triggers on properties + properties_extension) + one-shot
backfill from property_details.listing_events for pre-trigger history.
Climate risk First Street
- Flood 3/10 Moderate FEMA zone X (unshaded) · 20% chance over 30 yrs
- Wildfire 1/10 Low
- Heat 4/10 Moderate 7 d/yr ≥101°F today · 18 d/yr by 30 yrs out
- Wind 2/10 Low 100% chance of damaging wind over 30 yrs
- Air quality 3/10 Moderate 2 unhealthy d/yr today · 4 by 30 yrs out
Nearby sold comps map
Loading sold comps map…
Walkable amenities ~0.75 mi
Loading nearby amenities…
Taxation est. · year 1
- Rental income
- $62,172
- − Mortgage interest
- −$12,547
- − Property taxes
- −$3,360
- − Insurance
- −$1,120
- − Repairs & maintenance
- −$4,974
- − Management
- −$4,974
- − Depreciation
- −$6,516
- Taxable income
- $28,681
- Est. tax owed @ 24.0%
- −$6,883
- After-tax cash flow
- $23,656/yr
For passive investors: Depreciation is non-cash, so a rental often shows a tax loss while cash-flowing — sheltering income. Rental losses are passive: they offset passive income freely, and up to $25,000/yr can offset ordinary (W-2) income if you actively participate and your MAGI is under $100k (phasing out to $0 by $150k); unused losses carry forward. On sale, claimed depreciation is recaptured at up to 25%, and gains may owe capital-gains tax (a 1031 exchange can defer both). Figures are a year-1 estimate at your 24.0% rate — not tax advice; consult a CPA.
Condition & rehab AI · 9 photos
This property requires extensive structural repairs and HVAC updates to stabilize the building and improve its safety and functionality. Significant value can be added through these repairs and improvements.
Repairs flagged
- Major structural repairs — Severe structural damage
- Major ceiling repairs — Exposed structural elements
- Major HVAC repairs — Debris and structural damage
- Major exterior repairs — Exposed brick and debris
Value-add opportunities
- Both structural repairs — Stabilizing the building for safety and functionality
- Both HVAC repairs — Improving comfort and energy efficiency
- Both exterior repairs — Enhancing curb appeal and safety
- Both landscaping — Improving curb appeal and safety
Renovation cost estimate screening
| Repair item | Severity | Est. cost |
|---|---|---|
| structural repairs · Severe structural damage | Major | $15,000–50,000 |
| ceiling repairs · Exposed structural elements | Major | $15,000–50,000 |
| HVAC repairs · Debris and structural damage | Major | $15,000–50,000 |
| exterior repairs · Exposed brick and debris | Major | $15,000–50,000 |
| Total estimated repair cost · 4 items | $60,000–200,000 |
Value-add ROI direction
- Both structural repairs — Stabilizing the building for safety and functionality ↑
- Both HVAC repairs — Improving comfort and energy efficiency ↑
- Both exterior repairs — Enhancing curb appeal and safety ↑
- Both landscaping — Improving curb appeal and safety ↑
ⓘ Cost ranges are severity-bucket heuristics (US national rule-of-thumb). Get contractor quotes + a written scope before underwriting a rehab budget.
Schools (NCES district)
- District
- Dayton City
- NCES district ID
- 3904384
- Math proficiency
- 12% ▼ -12.00%
- Reading proficiency
- 21% ▼ -11.00%
- Median HH income
- $28,688
- Composite
- 12.94/100
- National rank
- #9579
- State rank
- #641 of 656 in OH
Livability — Dayton
- Score
- 65/100
- State rank
- #716
- US rank
- #12895
Category grades
Schools grade is shown separately in the Schools card above.
Census & demographics
- Census place
- Dayton, OH
- County
- Montgomery County · 459,541 people
- City population
- 164,387
- Metro
- Dayton-Kettering, OH
- Population (ZIP)
- 13,608
- Household income
- $38,323
- Rent vs Own
- Severe rent burden
- 1071.0
Population outlook (Montgomery County) Hauer SSP2
- Today (2025)
- 523,241 people
- By 2030
- 514,948 · -1.6%
- By 2040
- 493,378 · -5.7%
- By 2050
- 469,639 · -10.2%
- By 2075
- 418,360 · -20.0%
- By 2100
- 353,315 · -32.5%
Race, ethnicity, and origin ACS 2023
- Neighborhood character
- Predominantly White (66%)
- Race & ethnicity
- White 66% Hispanic / Latino 15% Black 14% Two or more races 8% Native American 1%
- Hispanic origin (detail)
- Mexican 7%
- Common ancestry
- Lithuanian 2% Slovak 1% Italian 1%
- Foreign-born
- 9% · Canada
- Languages at home
- 84% English-only · Spanish 13% Other Asian/Pacific 1%
Political lean MEDSL · Montgomery
- 2024 margin
- Toss-up / Even · D 49.8% · R 49.3%
- 2008→2024 swing
- -5.8pp toward R · 2008: 6.2pp · 2024: 0.5pp
- All cycles
- 2024: D+0.5 2020: D+2.2 2016: R+1.2 2012: D+3.1 2008: D+6.2
Not yet ingested
- Civics
- —
Market trends
- HPI YoY
- ▼ -17.40%
- Current HPI
- 447.4034
- Rent YoY
- ▲ 3.71%
- Metro
- Dayton-Kettering, OH
- State GDP YoY
- ▲ 1.98%
- F500 in state
- 48
Industry mix (Fortune 500 HQ in OH)
| Industry | F500 HQs | Revenue |
|---|---|---|
| Insurance | 3 | $145B |
|
||
| Industrial Machinery | 3 | $49B |
|
||
| Financial Services | 3 | $24B |
|
||
| Consumer Goods | 2 | $93B |
|
||
| Aerospace / Defense | 2 | $47B |
|
||
| Utilities | 2 | $33B |
|
||
Price history
-25.3% since first listed9 events — show timeline
- 2025-12-12 Price Changed $224,000 Dayton MLS
- 2025-11-11 Listed $225,000 Dayton MLS
- 2025-09-13 Listing Removed — Dayton MLS
- 2025-08-26 Price Changed $249,000 Dayton MLS
- 2025-08-19 Relisted — Dayton MLS
- 2025-08-10 Pending — Dayton MLS
- 2025-06-23 Price Changed $269,000 Dayton MLS
- 2025-05-21 Price Changed $289,000 Dayton MLS
- 2025-05-13 Listed $300,000 Dayton MLS
Cash-flow waterfall
monthlySold comps — $/sqft
last 12 mo · ≤1 miLoading sold comps…