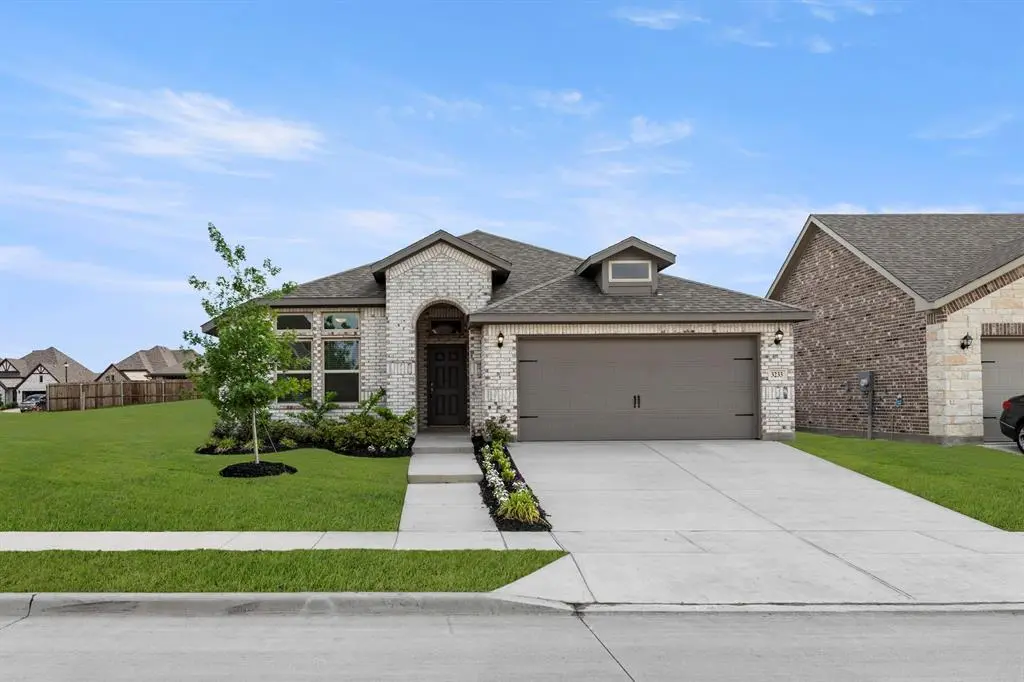
3233 Timineri Ln · Royse City, TX
Flood risk 1/10 · Minimal
- FEMA flood zone
- X (unshaded)
- Chance of flooding over 30 yrs
- 0.0%
- Est. flood insurance / yr
- $507 – $1,088
Fire risk 5/10 · Moderate
- Est. fire insurance / yr
- $1,222 – $2,270
Heat risk 7/10 · Major
- Hot days now (above 110°F)
- 7 days/yr
- Hot days in 30 yrs
- 24 days/yr
Wind risk 6/10 · Moderate
- Chance of severe wind over 30 yrs
- 27.0%
Air-quality risk 2/10 · Minimal
- Unhealthy air days now
- 1 days/yr
- Unhealthy air days in 30 yrs
- 1 days/yr
Risk factors via First Street. Map © Google.
Why this score? — see what drove the D- grade
The composite is a weighted blend of 9 inputs, each scored 0–100. Each bar is that input's sub-score; the figure is the points it added to the 100-point composite (weight × sub-score).
- Cash flow +13.2/30.0
- ARV discount +7.5/15.0
- DSCR +4.0/10.0
- Schools +3.8/10.0
- Livability +3.8/5.0
- 1% rule +2.7/10.0
- Condition / age +2.5/5.0
- Rent growth +2.2/5.0
- Appreciation +0.0/10.0
$299,999
🖨 Deal sheet (PDF) 📄 Offer letter ✓ Due diligence
Listing remarks
MLS# 21236209 - Built by Impression Homes - Ready Now! ~ Discover modern living in this stunning 3 bedroom, 2 bathroom single-family residence located in the desirable DeBerry Reserve subdivision, just completed in 2025. Spanning 1,880 sq ft, this traditional-style home features an open floorplan perfect for entertaining. The heart of the home boasts quartz counters, a kitchen island, and a pantry, complemented by a spacious dining area and a cozy living room. Enjoy the convenience of a smart home system, central heating and cooling. Retreat to the generous primary suite with an ensuite bathroom, alongside two additional bedrooms for family or guests. The exterior includes a charming extend
Key facts
- Quartz counters
- Royse city isd
- Open floorplan
Tags
Property features AI
Finance
- Other: Subdivision: Deberry Reserve; Lot dimensions approximately 50 x 120; Wood fencing; Low-flow water fixtures; Thermostat for energy efficiency
- Financial info: Treat as clear loan type; No second mortgage
- HOA & community: Mandatory association; Annual HOA fee of $600; HOA covers management fees; HOA management company: Louie One
Exterior
- Parking: Attached 2-car garage (20' wide x 19' deep); 2 covered parking spaces; 2-car single door
- Security: Smoke detector(s)
- Utilities: City water; City sewer
- Home design: Single family residence; One story; Residential property
- Construction: Brick construction; Composition roof; Slab foundation; Built in 2025 (new construction - complete)
- Exterior features: Covered porch(es); Covered patio/porch
Interior
- Kitchen: Dishwasher; Disposal; Electric range; Microwave; Walk-in pantry
- Bedrooms: 3 bedrooms (all on the main level); Primary bedroom on main level with walk-in closet, linen closet, and dual sinks
- Flooring: Carpet; Ceramic tile
- Bathrooms: 2 full bathrooms
- Heating & cooling: Central heating; Central air
- Interior features: Open floorplan; Kitchen island; Pantry; Smart home system; 7 total rooms; 1 living area; 1 dining area
- Laundry & utility: Separate utility room; Full-size washer/dryer area; Utility room (7 x 6)
Neighborhood map
What this means for you Summary
Snapshot
- This is a 3-bed/2.0-bath other listed at $300k.
Deal economics
- At list price, monthly cash flow is $-6 ($-66/yr) — negative.
- To cash-flow at today's rent, offer at most $299k (0.3% below list).
- To meet the 1% rule (rent ≥ 1% of price), the offer needs to be $232k (22.8% below list).
- Recommended offer: $232k (22.8% below list) — sets the bar for 1% rule.
- Cap rate 6.3% vs local median 4.2% in Royse City — top-decile yield for the area; either an underpriced asset or a hidden risk that comps aren't pricing in. Stress-test before assuming the spread holds.
Location & tenants
- Location reads 75/100 on livability (#158 in TX, #4,292 nationally) — a middle-class / working-renter tenant base. Strengths: crime A+, employment A+, housing A+; Watch: amenities F, commute F.
- Royse City ISD (rural): math 42% / reading 42% proficiency, ranked #266 of 826 in TX (top 32%) — families likely to look elsewhere, expect single-tenant / working-renter base with shorter leases.
- Zoned schools: Anita Scott El (math 53% / reading 40%, grade D-, #1,080 of 4,322 statewide, top 25%, 712 students, 47% FRL); Ouida Baley Middle (math 32% / reading 35%, grade F, #911 of 1,662 statewide, top 56%, 934 students, 43% FRL); Royse City H S (math 38% / reading 55%, grade D-, #621 of 1,632 statewide, top 38%, 2,526 students, 37% FRL).
- Market conditions: Rents soft (-1.1%/yr); 1301 active listings in the ZIP; 33 comparable units currently listed for rent nearby; rentals at typical pace (median 24d on market — plan ~3-4 weeks tenant-placement turnaround); high-income renter base; 1,289 units permitted in Hunt County in 2024 (527 in 5+ unit buildings).
Forward outlook
- Local home prices are declining (-3.0%/yr); year-one equity from $2k of loan paydown is wiped out by about $9k of value loss. Plan a longer hold.
- Hunt County population projected at +15% by 2050 — modest demand growth; plan on rents tracking national, not racing it.
Negotiation context
- It's been on market 20 days — a 2% lower offer ($295k) is reasonable based on typical stale-listing flexibility.
Risks & watch-outs
- Climate carrying-cost: major wind risk, 27% chance of damaging wind over 30y; moderate wildfire risk; extreme-heat days projected 7→24/yr by 2055 (HVAC capex compounding) — expect insurance premiums to compound above CPI over the hold.
Questions for the listing agent
- What do current leases actually rent for vs. the listed asking? Can we see a recent rent roll and the last 12 months of T-12 income?
- What does the HOA fee cover, when was the last increase, and are there any pending special assessments or reserve-fund shortfalls?
- Is there a deadline driving the sale (1031 exchange, divorce, estate, relocation)? That informs how much negotiation room exists.
- The area grade is low — what's the realistic commute time and amenity access for the typical tenant pool here? Any planned neighborhood developments (good or bad) we should know about?
- What's the average days-on-market for RENTAL listings here right now (not sales)? A rising rental-DOM trend means longer vacancies and softer asking-rent achievability than the comps imply.
- What's the recent tenant-quality profile in this submarket — average credit score on applications, eviction rate, late-payment / NSF rate, and stable-employment percentage? A property-management company in the area should have these aggregated.
- How much new for-sale + rental construction is in the pipeline within 1–3 miles? Heavy new supply typically softens prices + rents 12–24 months out; constrained supply supports both.
Investment metrics
- 1% rule
- 0.77% ✗
- Cap rate
- 6.27%
- Cash-on-cash
- -0.08%
- DSCR
- 1.00
- GRM
- 10.8
CMA / ARV
No comps found within radius.
Projected returns pro-forma
-3.0% appreciation · 0.0% rent growth · sell at horizon
- IRR
- -19.5%
- Equity multiple
- 0.33×
- Total profit
- $-55,865
- Equity at exit
- $44,731
- IRR
- -19.2%
- Equity multiple
- 0.10×
- Total profit
- $-75,792
- Equity at exit
- $25,938
Cash invested: $84,000 (down + closing). Projections, not guarantees.
Landlord ↔ Tenant lean methodology
- Overall (STATE)
- 87 Strongly Landlord-Friendly
- State Texas
- 87 Strongly Landlord-Friendly · R+5
- County
- — inherits STATE
- City
- — inherits STATE
ZIP-level market 75189
- Home prices YoY
- -25.0%
- Rents YoY
- -1.1%
- Active inventory
- 1301
- Price-to-rent
- 10.8×
Monthly cashflow live
- Estimated rent
- $2,317 high interval (Pro) →
- Mortgage (P&I)
- −$1,573
- Tax from tax record
- −$88 /mo · $1,054/yr
- Insurance
- −$125
- HOA
- −$50
- Vacancy / Maint / Mgmt
- −$487
- Net cashflow
- $-6
Break-even live
Sensitivity live
| Price | -10% $164 | -5% $79 | +0% $-6 | +5% $-90 | +10% $-175 |
|---|---|---|---|---|---|
| Rent | -10% $-189 | -5% $-97 | +0% $-6 | +5% $86 | +10% $178 |
| Rate | -1.0pp $146 | -0.5pp $71 | base $-6 | +0.5pp $-83 | +1.0pp $-162 |
UW: 25.0% down · 7.5% · 30yr · 1.5% tax · 5.0% vac · 8.0% maint · 8.0% mgmt
Financing live
Cash to close
- Down payment
- $75,000
- Closing costs
- $9,000
- Reserves months
- —
- Total cash needed
- —
Loan-product check · same deal, 3 products live
Conventional
25% down · 7.5% · 30yr
- Down + closing
- —
- Monthly P&I
- —
- Monthly cashflow
- —
- DSCR
- —
- Eligible?
- —
Personal DTI + credit; lowest rate.
DSCR
20% down · 8.5% · 30yr
- Down + closing
- —
- Monthly P&I
- —
- Monthly cashflow
- —
- DSCR
- —
- Eligible?
- —
No personal income docs; deal must DSCR.
Hard money
10% down · 12.0% · 12mo
- Down + closing
- —
- Monthly P&I
- —
- Monthly cashflow
- —
- DSCR
- —
- Eligible?
- —
Short-term bridge; refi at stabilization.
Rent comps 33 comps
| Address | Beds | Baths | Sqft | Rent | $/sqft | DOM | Units | Dist |
|---|---|---|---|---|---|---|---|---|
| 3270 Timineri Ln Royse City, TX | 4.0 | 2.5 | 2239 | $2,500 | $1.12 | 0d | 1 | 0.08mi |
| 4005 Bailey Way Royse City, TX | 4.0 | 3.0 | 2036 | $2,250 | $1.11 | 4d | 1 | 0.19mi |
| 1021 Peach St Royse City, TX | 3.0 | 2.0 | 1530 | $1,200 | $0.78 | 45d | 1 | 0.44mi |
| 917 Orchid Blvd Royse City, TX | 3.0 | 2.0 | 1628 | $1,895 | $1.16 | 45d | 1 | 0.49mi |
| 2909 Marsha Ln Royse City, TX | 3.0 | 2.0 | 1702 | $2,900 | $1.70 | 4d | 1 | 0.56mi |
| 2701 Redwood St Royse City, TX | 3.0 | 2.0 | 1816 | $2,100 | $1.16 | 7d | 1 | 0.61mi |
| 2712 Redwood St Royse City, TX | 4.0 | 2.5 | 2580 | $2,000 | $0.78 | 19d | 1 | 0.62mi |
| 2704 Redwood St Royse City, TX | 4.0 | 2.0 | 1760 | $1,850 | $1.05 | 24d | 1 | 0.63mi |
| 2717 Marsha Ln Royse City, TX | 4.0 | 3.0 | 2416 | $1,925 | $0.80 | 22d | 1 | 0.63mi |
| 725 Orchid Blvd Royse City, TX | 3.0 | 2.0 | 1558 | $1,795 | $1.15 | 45d | 1 | 0.64mi |
| 2801 Spencer Cir Royse City, TX | 4.0 | 2.5 | 2416 | $1,861 | $0.77 | 1d | 1 | 0.71mi |
| 3108 Overstreet Ln Royse City, TX | 3.0 | 2.0 | 1680 | $1,899 | $1.13 | 5d | 1 | 0.71mi |
| 712 Preston Dr Royse City, TX | 4.0 | 2.0 | 1965 | $1,895 | $0.96 | 5d | 1 | 0.80mi |
| 3140 Overlook Dr Royse City, TX | 4.0 | 2.0 | 1866 | $2,200 | $1.18 | 45d | 1 | 0.93mi |
| 3136 Overlook Dr Royse City, TX | 4.0 | 2.0 | 2046 | $2,295 | $1.12 | 5d | 1 | 0.93mi |
| 3136 Overlook Dr Royse City, TX | 4.0 | 2.0 | 2046 | $2,295 | $1.12 | 45d | 1 | 0.93mi |
| 207 Gardenia Dr Royse City, TX | 3.0 | 2.0 | 1830 | $2,195 | $1.20 | 26d | 1 | 1.02mi |
| 426 Oleander Dr Fate, TX | 3.0 | 2.0 | 2126 | $2,495 | $1.17 | 26d | 1 | 1.03mi |
| 513 Redbud Dr Royse City, TX | 3.0 | 2.0 | 1830 | $2,050 | $1.12 | 45d | 1 | 1.04mi |
| 430 Oleander Dr Fate, TX | 3.0 | 2.0 | 2039 | $2,350 | $1.15 | 45d | 1 | 1.04mi |
| 208 Sunny Corner Rd Royse City, TX | 3.0 | 2.0 | 1780 | $1,695 | $0.95 | 21d | 1 | 1.05mi |
| 525 Redbud Dr Royse City, TX | 3.0 | 2.0 | 2147 | $2,395 | $1.12 | 45d | 1 | 1.07mi |
| 3178 Wind Knot Way Royse City, TX | 3.0 | 2.0 | 1798 | $2,150 | $1.20 | 17d | 1 | 1.13mi |
| 523 Francis Ln Royse City, TX | 4.0 | 3.0 | 2029 | $2,299 | $1.13 | 45d | 1 | 1.14mi |
| 3122 Wind Knot Way Royse City, TX | 4.0 | 3.5 | 2378 | $3,000 | $1.26 | 45d | 1 | 1.17mi |
| 552 Firethorn Dr Royse City, TX | 3.0 | 2.0 | 1830 | $2,350 | $1.28 | 1d | 1 | 1.19mi |
| 3213 Shady River Trl Royse City, TX | 3.0 | 2.0 | 1858 | $1,849 | $1.00 | 24d | 1 | 1.20mi |
| 2031 Roaring Fork Dr Royse City, TX | 3.0 | 2.0 | 1861 | $2,495 | $1.34 | 7d | 1 | 1.23mi |
| 4069 Anglers Way Royse City, TX | 4.0 | 3.0 | 2492 | $2,650 | $1.06 | 45d | 1 | 1.26mi |
| 3003 Wind Knot Way Royse City, TX | 4.0 | 3.5 | 2386 | $2,950 | $1.24 | 21d | 1 | 1.26mi |
| 4023 Anglers Way Royse City, TX | 4.0 | 3.5 | 2122 | $2,900 | $1.37 | 7d | 1 | 1.28mi |
| 6105 Poolside Way Royse City, TX | 3.0 | 2.5 | 2463 | $2,600 | $1.06 | 45d | 1 | 1.35mi |
| 7015 Hopper Ct Royse City, TX | 4.0 | 2.5 | 2198 | $2,300 | $1.05 | 45d | 1 | 1.40mi |
HOA detail
- Monthly dues
- $50 · $600/yr
Listing history 2 events
-
2026-04-30status Pending
-
2026-04-10$299,999 Active
ⓘ Source: listings_history table (triggers on properties + properties_extension) + one-shot
backfill from property_details.listing_events for pre-trigger history.
Tax reassessment forecast TX · Resets to sale price
- Current annual tax
- $1,054 · $88/mo
- Projected year-2 tax
- $5,490 · $457/mo
- Expected delta
- +$4,436/yr (+$370/mo · 420.9%)
ⓘ Screening estimate from a state-policy table — verify with the county assessor before closing.
Climate risk First Street
- Flood 1/10 Low FEMA zone X (unshaded) · 0% chance over 30 yrs
- Wildfire 5/10 Major
- Heat 7/10 Severe 7 d/yr ≥110°F today · 24 d/yr by 30 yrs out
- Wind 6/10 Major 27% chance of damaging wind over 30 yrs
- Air quality 2/10 Low 1 unhealthy d/yr today · 1 by 30 yrs out
Nearby sold comps map
Loading sold comps map…
Walkable amenities ~0.75 mi
Loading nearby amenities…
Taxation est. · year 1
- Rental income
- $27,806
- − Mortgage interest
- −$16,805
- − Property taxes
- −$1,054
- − Insurance
- −$1,500
- − Repairs & maintenance
- −$2,224
- − Management
- −$2,224
- − HOA
- −$600
- − Depreciation
- −$8,727
- Taxable loss
- −$5,329
- Est. tax savings @ 24.0%
- +$1,279
- After-tax cash flow
- $1,213/yr
For passive investors: Depreciation is non-cash, so a rental often shows a tax loss while cash-flowing — sheltering income. Rental losses are passive: they offset passive income freely, and up to $25,000/yr can offset ordinary (W-2) income if you actively participate and your MAGI is under $100k (phasing out to $0 by $150k); unused losses carry forward. On sale, claimed depreciation is recaptured at up to 25%, and gains may owe capital-gains tax (a 1031 exchange can defer both). Figures are a year-1 estimate at your 24.0% rate — not tax advice; consult a CPA.
Schools (NCES district)
- District
- Royse City ISD
- NCES district ID
- 4838220
- Math proficiency
- 42% ▼ -10.00%
- Reading proficiency
- 42% ▼ -5.00%
- Median HH income
- $73,810
- Composite
- 38.44/100
- National rank
- #4197
- State rank
- #266 of 826 in TX
Livability — Royse City
- Score
- 75/100
- State rank
- #158
- US rank
- #4292
Category grades
Schools grade is shown separately in the Schools card above.
Census & demographics
- County
- Rockwall County · 132,930 people
- City population
- 48,739
- Metro
- Dallas-Fort Worth-Arlington, TX
- Population (ZIP)
- 48,739
- Household income
- $117,125
- Rent vs Own
- Severe rent burden
- 569.0
Population outlook (Hunt County) Hauer SSP2
- Today (2025)
- 97,090 people
- By 2030
- 100,452 · +3.5%
- By 2040
- 106,544 · +9.7%
- By 2050
- 111,218 · +14.6%
- By 2075
- 121,695 · +25.3%
- By 2100
- 123,683 · +27.4%
Race, ethnicity, and origin ACS 2023
- Neighborhood character
- Diverse neighborhood (Simpson 0.57)
- Race & ethnicity
- White 60% Hispanic / Latino 25% Two or more races 12% Black 10% Asian 2%
- Hispanic origin (detail)
- Mexican 20%
- Common ancestry
- Slovak 2% Serbian 1% Lithuanian 1%
- Foreign-born
- 10% · Canada, Philippines, Jamaica
- Languages at home
- 80% English-only · Spanish 15% Other Indo-European 1%
Political lean MEDSL · Hunt
- 2024 margin
- Solid R (+55.5) · D 21.9% · R 77.4%
- 2008→2024 swing
- -14.9pp toward R · 2008: -40.6pp · 2024: -55.5pp
- All cycles
- 2024: R+55.5 2020: R+52.5 2016: R+56.3 2012: R+51.2 2008: R+40.6
Not yet ingested
- Civics
- —
Market trends
- HPI YoY
- ▼ -71.10%
- Current HPI
- 212.8422
- Rent YoY
- ▼ -1.13%
- Metro
- Dallas-Fort Worth-Arlington, TX
- State GDP YoY
- ▲ 3.95%
- F500 in state
- 110
Industry mix (Fortune 500 HQ in TX)
| Industry | F500 HQs | Revenue |
|---|---|---|
| Energy | 16 | $1,198B |
|
||
| Technology | 5 | $198B |
|
||
| Engineering / Construction | 4 | $72B |
|
||
| Energy Services | 3 | $60B |
|
||
| Utilities | 3 | $41B |
|
||
| Healthcare | 2 | $330B |
|
||
Price history
2 events — show timeline
- 2026-04-30 Pending — NTREIS
- 2026-04-10 Listed $299,999 NTREIS
Property tax history
-1.9%/yrLatest (2025): $1,054 · +0.7% YoY. Source: county tax records.
Cash-flow waterfall
monthlySold comps — $/sqft
last 12 mo · ≤1 miLoading sold comps…