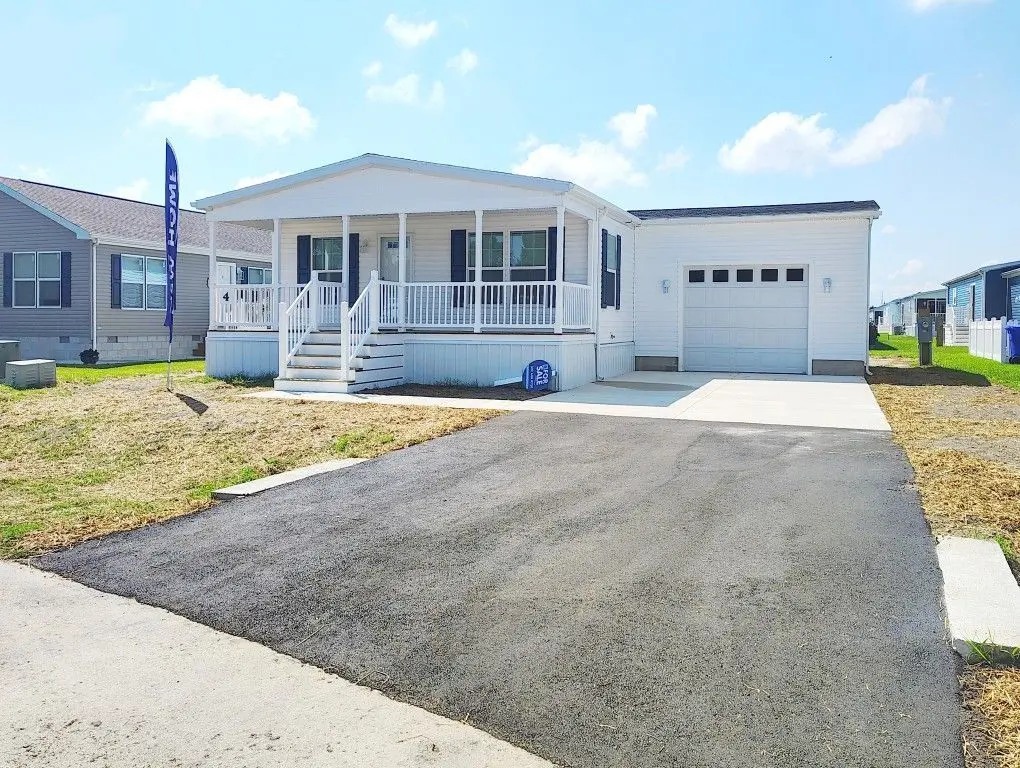
4 Carlisle Way Unit CAR004 · Lewes, DE
Flood risk 1/10 · Minimal
- FEMA flood zone
- X (unshaded)
- Chance of flooding over 30 yrs
- 0.0%
- Est. flood insurance / yr
- $473 – $860
Fire risk 1/10 · Minimal
- Est. fire insurance / yr
- $476 – $884
Heat risk 8/10 · Major
- Hot days now (above 101°F)
- 7 days/yr
- Hot days in 30 yrs
- 19 days/yr
Wind risk 8/10 · Major
- Chance of severe wind over 30 yrs
- 80.0%
Air-quality risk 2/10 · Minimal
- Unhealthy air days now
- 1 days/yr
- Unhealthy air days in 30 yrs
- 1 days/yr
Risk factors via First Street. Map © Google.
Why this score? — see what drove the C- grade
The composite is a weighted blend of 9 inputs, each scored 0–100. Each bar is that input's sub-score; the figure is the points it added to the 100-point composite (weight × sub-score).
- Cash flow +18.4/30.0
- ARV discount +7.5/15.0
- DSCR +5.8/10.0
- 1% rule +4.9/10.0
- Schools +4.2/10.0
- Condition / age +4.0/5.0
- Livability +3.4/5.0
- Rent growth +2.7/5.0
- Appreciation +0.0/10.0
$264,000
🖨 Deal sheet (PDF) 📄 Offer letter ✓ Due diligence
Listing remarks
Sussex West is an active and exciting 55+ Senior Community. Located in Lewes, DE, your brand new 3 bedroom, 2 bathroom home awaits you. With amenities such as a swimming pool, a horseshoe court, and a bocce ball court, you can enjoy your surroundings as a resident of Sussex West. Inside, features such as e-insulated vinyl windows, premium entry doors, and a walk-in master closet will make you fall in love as you walk throughout the home. This one won't be on the market long, so call us today for more information or to schedule a tour. Deposits & Fees are subject to change.
Key facts
- Horseshoe court
- Swimming pool
- Bocce ball court
Tags
Property features AI
Finance
- Other: Address: 4 Carlisle Way Unit CAR004, Lewes, DE 19958
- Financial info: List price $263,500
Exterior
- Utilities: Natural gas; Central air conditioning
- Home design: Spec new construction (Plan 86615); Active listing
- Exterior features: Living area approximately 1,792
Interior
- Bedrooms: 3 bedrooms
- Bathrooms: 2 full bathrooms
- Heating & cooling: Natural gas heating; Central air conditioning
- Interior features: 2 total bathrooms
Neighborhood map
What this means for you Summary
Snapshot
- This is a 3-bed/2.0-bath manufactured listed at $264k. Condition is rated good.
Deal economics
- At list price, monthly cash flow is $247 ($3k/yr) — positive.
- The deal already cash-flows at list — no discount required.
- To meet the 1% rule (rent ≥ 1% of price), the offer needs to be $262k (0.7% below list).
- Recommended offer: $260k (1.5% below list) — sets the bar for market timing.
- Cap rate 7.4% vs local median 1.7% in Lewes — top-decile yield for the area; either an underpriced asset or a hidden risk that comps aren't pricing in. Stress-test before assuming the spread holds.
Location & tenants
- Location reads 67/100 on livability (#40 in DE) — a middle-class / working-renter tenant base. Strengths: crime A+, employment A+, health & safety A+; Watch: commute F, cost of living F.
- Cape Henlopen School District (town): math 42% / reading 55% proficiency, ranked #5 of 26 in DE (top 19%) — families likely to look elsewhere, expect single-tenant / working-renter base with shorter leases.
- Market conditions: Rents flat; 818 active listings in the ZIP; 8 comparable units currently listed for rent nearby; rentals lingering (median 45d on market — plan ~5-8 weeks vacancy on turnover, expect pricing pressure); 50% of comp listings sitting > 30 days — soft ceiling on asking rent; solid renter incomes; 4,354 units permitted in Sussex County in 2024 (344 in 5+ unit buildings).
- This rent runs 32% of the median local income ($97k/yr) — at the standard rent-burdened threshold; future hikes will face affordability resistance.
Forward outlook
- Local home prices are declining (-3.0%/yr); year-one equity from $2k of loan paydown is wiped out by about $8k of value loss. Plan a longer hold.
- Sussex County population projected at +25% by 2050 — long-run rental-demand tailwind backs the buy-and-hold thesis.
Negotiation context
- It's been on market 22 days — a 2% lower offer ($260k) is reasonable based on typical stale-listing flexibility.
Risks & watch-outs
- Climate carrying-cost: severe wind risk, 80% chance of damaging wind over 30y; extreme-heat days projected 7→19/yr by 2055 (HVAC capex compounding) — expect insurance premiums to compound above CPI over the hold.
Questions for the listing agent
- Is there a deadline driving the sale (1031 exchange, divorce, estate, relocation)? That informs how much negotiation room exists.
- Schools are B-rated — typically a magnet for longer-tenancy family renters. What's the average tenant stay here, and is there a school-zone premium baked into asking?
- What's the average days-on-market for RENTAL listings here right now (not sales)? A rising rental-DOM trend means longer vacancies and softer asking-rent achievability than the comps imply.
- What's the recent tenant-quality profile in this submarket — average credit score on applications, eviction rate, late-payment / NSF rate, and stable-employment percentage? A property-management company in the area should have these aggregated.
- How much new for-sale + rental construction is in the pipeline within 1–3 miles? Heavy new supply typically softens prices + rents 12–24 months out; constrained supply supports both.
Investment metrics
- 1% rule
- 0.99% ✗
- Cap rate
- 7.41%
- Cash-on-cash
- 4.00%
- DSCR
- 1.18
- GRM
- 8.4
CMA / ARV
- ARV (on-the-fly)
- $152,320
- Comps found
- 1
Show comp detail 1 sale within ~0.75 mi
| Address | Dist | Beds/Ba | Sqft | Sold | Price | $/sf | Match |
|---|---|---|---|---|---|---|---|
| 31702 Siham Rd #2339 | 0.54mi | 3/2.0 | 1,524 (-15%) | 22mo | $130,000 | $85 | 31 |
Match score weights: distance 35% · size 25% · config 20% · recency 20%. Top-matched comps best support the ARV.
Projected returns pro-forma
-3.0% appreciation · 0.77% rent growth · sell at horizon
- IRR
- -12.6%
- Equity multiple
- 0.56×
- Total profit
- $-32,789
- Equity at exit
- $39,363
- IRR
- -7.3%
- Equity multiple
- 0.58×
- Total profit
- $-30,748
- Equity at exit
- $22,826
Cash invested: $73,920 (down + closing). Projections, not guarantees.
Landlord ↔ Tenant lean methodology
- Overall (STATE)
- 70 Landlord-Friendly
- State Delaware
- 70 Landlord-Friendly · D+7
- County
- — inherits STATE
- City
- — inherits STATE
ZIP-level market 19958
- Rents YoY
- 0.8%
- Active inventory
- 818
- Price-to-rent
- 8.4×
Monthly cashflow live
- Estimated rent
- $2,622 high interval (Pro) →
- Mortgage (P&I)
- −$1,384
- Tax est. 1.5%
- −$330 /mo · $3,960/yr
- Insurance
- −$110
- HOA
- −$0
- Vacancy / Maint / Mgmt
- −$551
- Net cashflow
- $247
Break-even live
Sensitivity live
| Price | -10% $429 | -5% $338 | +0% $247 | +5% $155 | +10% $64 |
|---|---|---|---|---|---|
| Rent | -10% $39 | -5% $143 | +0% $247 | +5% $350 | +10% $454 |
| Rate | -1.0pp $380 | -0.5pp $314 | base $247 | +0.5pp $178 | +1.0pp $109 |
UW: 25.0% down · 7.5% · 30yr · 1.5% tax · 5.0% vac · 8.0% maint · 8.0% mgmt
Financing live
Cash to close
- Down payment
- $66,000
- Closing costs
- $7,920
- Reserves months
- —
- Total cash needed
- —
Loan-product check · same deal, 3 products live
Conventional
25% down · 7.5% · 30yr
- Down + closing
- —
- Monthly P&I
- —
- Monthly cashflow
- —
- DSCR
- —
- Eligible?
- —
Personal DTI + credit; lowest rate.
DSCR
20% down · 8.5% · 30yr
- Down + closing
- —
- Monthly P&I
- —
- Monthly cashflow
- —
- DSCR
- —
- Eligible?
- —
No personal income docs; deal must DSCR.
Hard money
10% down · 12.0% · 12mo
- Down + closing
- —
- Monthly P&I
- —
- Monthly cashflow
- —
- DSCR
- —
- Eligible?
- —
Short-term bridge; refi at stabilization.
Rent comps 8 comps
| Address | Beds | Baths | Sqft | Rent | $/sqft | DOM | Units | Dist |
|---|---|---|---|---|---|---|---|---|
| 20141 Riesling Ln #306 Lewes, DE | 2.0 | 2.0 | 1600 | $2,600 | $1.62 | 44d | 1 | 0.65mi |
| 24258 Zinfandel Ln Lewes, DE | 2.0 | 2.0 | 1300 | $2,300 | $1.77 | 44d | 1 | 0.69mi |
| 12001 Old Vine Blvd Lewes, DE | 1.0–2.0 | 1.0–2.0 | 987 | $3,055 | $3.10 | 14d | 17 | 0.73mi |
| 24238 Zinfandel Ln Lewes, DE | 2.0 | 2.0 | 1300 | $2,300 | $1.77 | 44d | 1 | 0.74mi |
| 17010 Minos Conaway Rd Lewes, DE | 3.0 | 2.0 | 1600 | $2,500 | $1.56 | 44d | 1 | 0.80mi |
| 17432 Slipper Shell Way #5 Lewes, DE | 3.0 | 2.0 | 1840 | $2,150 | $1.17 | 22d | 1 | 1.28mi |
| 18 Greystone Dr Lewes, DE | 3.0 | 2.5 | 2114 | $2,875 | $1.36 | 22d | 1 | 1.30mi |
| 33731 Freeport Dr Lewes, DE | 3.0 | 2.5 | 2300 | $3,295 | $1.43 | 14d | 1 | 1.46mi |
Listing history 16 events
-
2026-06-18days on market $264,000 Active 22 DOM
-
2026-06-17days on market $264,000 Active 21 DOM
-
2026-06-16days on market $264,000 Active 20 DOM
-
2026-06-15days on market $264,000 Active 19 DOM
-
2026-06-14days on market $264,000 Active 17 DOM
-
2026-06-13days on market $264,000 Active 16 DOM
-
2026-06-10days on market $264,000 Active 14 DOM
-
2026-06-09days on market $264,000 Active 13 DOM
-
2026-06-08days on market $264,000 Active 12 DOM
-
2026-06-07days on market $264,000 Active 11 DOM
-
2026-06-05days on market $264,000 Active 8 DOM
-
2026-06-03days on market $264,000 Active 7 DOM
-
2026-06-02days on market $264,000 Active 6 DOM
-
2026-06-01pricedays on market $264,000 Active 5 DOM
-
2026-05-31days on market $263,500 Active 4 DOM
-
2026-05-30days on market $263,500 Active 3 DOM
ⓘ Source: listings_history table (triggers on properties + properties_extension) + one-shot
backfill from property_details.listing_events for pre-trigger history.
Climate risk First Street
- Flood 1/10 Low FEMA zone X (unshaded) · 0% chance over 30 yrs
- Wildfire 1/10 Low
- Heat 8/10 Severe 7 d/yr ≥101°F today · 19 d/yr by 30 yrs out
- Wind 8/10 Severe 80% chance of damaging wind over 30 yrs
- Air quality 2/10 Low 1 unhealthy d/yr today · 1 by 30 yrs out
Nearby sold comps map
Loading sold comps map…
Walkable amenities ~0.75 mi
Loading nearby amenities…
Taxation est. · year 1
- Rental income
- $31,459
- − Mortgage interest
- −$14,788
- − Property taxes
- −$3,960
- − Insurance
- −$1,320
- − Repairs & maintenance
- −$2,517
- − Management
- −$2,517
- − Depreciation
- −$7,680
- Taxable loss
- −$1,323
- Est. tax savings @ 24.0%
- +$317
- After-tax cash flow
- $3,277/yr
For passive investors: Depreciation is non-cash, so a rental often shows a tax loss while cash-flowing — sheltering income. Rental losses are passive: they offset passive income freely, and up to $25,000/yr can offset ordinary (W-2) income if you actively participate and your MAGI is under $100k (phasing out to $0 by $150k); unused losses carry forward. On sale, claimed depreciation is recaptured at up to 25%, and gains may owe capital-gains tax (a 1031 exchange can defer both). Figures are a year-1 estimate at your 24.0% rate — not tax advice; consult a CPA.
Condition & rehab AI · 5 photos
This manufactured home is in good condition with minimal repairs needed. Landscaping and exterior painting would significantly enhance its curb appeal and value.
Value-add opportunities
- Both Landscaping — Enhances curb appeal and adds value
- Both Paint exterior — Fresh paint can make the home look newer
- Both Install new windows — Newer windows can improve energy efficiency and appearance
Renovation cost estimate screening
Value-add ROI direction
- Both Landscaping — Enhances curb appeal and adds value ↑
- Both Paint exterior — Fresh paint can make the home look newer ↑
- Both Install new windows — Newer windows can improve energy efficiency and appearance ↑
ⓘ Cost ranges are severity-bucket heuristics (US national rule-of-thumb). Get contractor quotes + a written scope before underwriting a rehab budget.
Schools (NCES district)
- District
- Cape Henlopen School District
- NCES district ID
- 1000170
- Math proficiency
- 42% ▼ -14.00%
- Reading proficiency
- 55% ▼ -10.00%
- Median HH income
- $60,196
- Composite
- 42.47/100
- National rank
- #3214
- State rank
- #5 of 26 in DE
Livability — Lewes
- Score
- 67/100
- State rank
- #40
- US rank
- #11077
Category grades
Schools grade is shown separately in the Schools card above.
Census & demographics
- County
- Sussex County · 82,708 people
- City population
- 31,938
- Metro
- Salisbury, MD-DE
- Population (ZIP)
- 31,938
- Household income
- $97,197
- Rent vs Own
- Severe rent burden
- 545.0
Population outlook (Sussex County) Hauer SSP2
- Today (2025)
- 248,853 people
- By 2030
- 264,464 · +6.3%
- By 2040
- 290,980 · +16.9%
- By 2050
- 311,259 · +25.1%
- By 2075
- 352,488 · +41.6%
- By 2100
- 367,406 · +47.6%
Race, ethnicity, and origin ACS 2023
- Neighborhood character
- Predominantly White (88%)
- Race & ethnicity
- White 88% Two or more races 6% Hispanic / Latino 4% Black 2% Asian 2%
- Common ancestry
- Romanian 6% Slovak 3% Italian 2%
- Foreign-born
- 6% · Canada
- Languages at home
- 93% English-only · Spanish 3% Other Indo-European 1% Russian/Polish/Slavic 1%
Political lean MEDSL · Sussex
- 2024 margin
- R (+11.0) · D 43.9% · R 54.9% · Other 1.2%
- 2008→2024 swing
- -2.4pp toward R · 2008: -8.6pp · 2024: -11.0pp
- All cycles
- 2024: R+11.0 2020: R+11.2 2016: R+22.0 2012: R+13.0 2008: R+8.6
Not yet ingested
- Civics
- —
Market trends
- HPI YoY
- ▼ -204.07%
- Current HPI
- 299.0736
- Rent YoY
- ▲ 0.77%
- Metro
- Salisbury, MD-DE
- State GDP YoY
- —
- F500 in state
- 0
Cash-flow waterfall
monthlySold comps — $/sqft
last 12 mo · ≤1 miLoading sold comps…