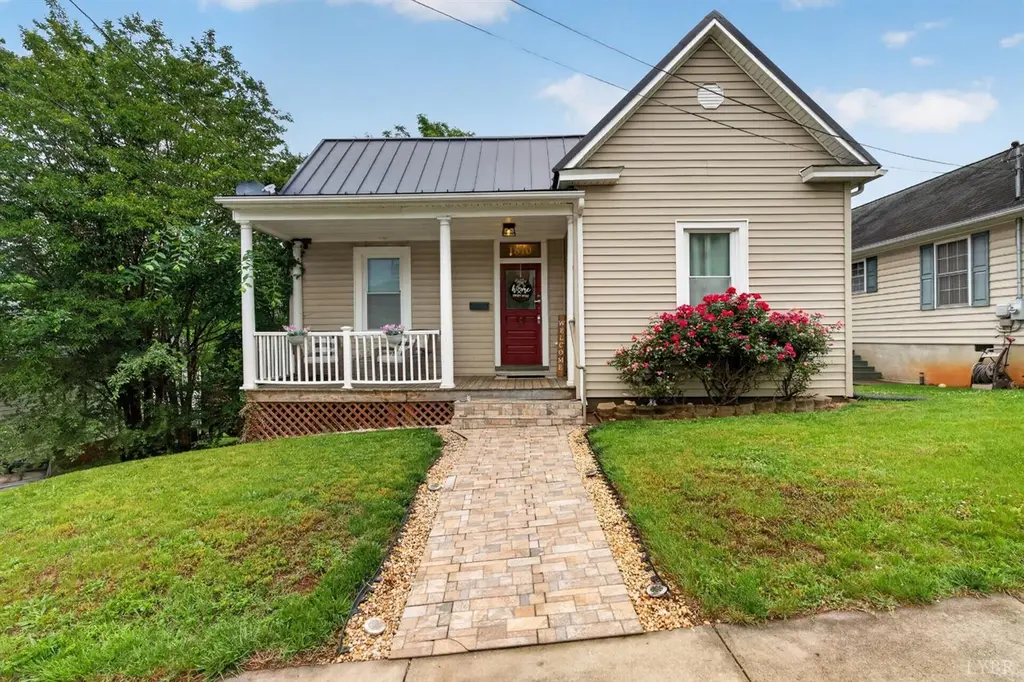
1810 Locust St · Lynchburg, VA
Flood risk 1/10 · Minimal
- FEMA flood zone
- X (unshaded)
- Chance of flooding over 30 yrs
- 0.0%
- Est. flood insurance / yr
- $507 – $1,088
Fire risk 3/10 · Minor
- Est. fire insurance / yr
- $666 – $1,236
Heat risk 6/10 · Moderate
- Hot days now (above 102°F)
- 7 days/yr
- Hot days in 30 yrs
- 18 days/yr
Wind risk 2/10 · Minimal
- Chance of severe wind over 30 yrs
- 3.0%
Air-quality risk 2/10 · Minimal
- Unhealthy air days now
- 0 days/yr
- Unhealthy air days in 30 yrs
- 1 days/yr
Risk factors via First Street. Map © Google.
Why this score? — see what drove the D- grade
The composite is a weighted blend of 9 inputs, each scored 0–100. Each bar is that input's sub-score; the figure is the points it added to the 100-point composite (weight × sub-score).
- Cash flow +13.6/30.0
- Livability +4.5/5.0
- DSCR +4.1/10.0
- Schools +4.0/10.0
- Rent growth +3.6/5.0
- 1% rule +2.7/10.0
- Condition / age +2.5/5.0
- ARV discount +0.0/15.0
- Appreciation +0.0/10.0
$189,900
🖨 Deal sheet (PDF) 📄 Offer letter ✓ Due diligence
Listing remarks
This move-in ready home has been impeccably maintained and offers 3 bedrooms and 1 bath with convenient main-level living. Perfect for a first-time homebuyer, investor, or anyone seeking a low-maintenance lifestyle, this property is currently operating as a successful Airbnb and could continue as a short-term rental or become your next home. Conveniently located near Hwy 29 and just minutes from downtown Lynchburg, you'll enjoy quick access to shopping, dining, and entertainment. Inside, the welcoming foyer opens to spacious rooms with tall ceilings and a seamless flow between the living, dining, and kitchen areas. A separate laundry room and large crawl space provide excellent storage. Out
Key facts
- Firepit area
- Private backyard
- Main-level living
Tags
Property features AI
Exterior
- Utilities: Public water; Public sewer
- Home design: Single-family residence; One story
- Construction: Vinyl siding; Metal roof; Built on crawl space
- Exterior features: Deck; Patio; Porch; Fenced yard
Interior
- Kitchen: Dishwasher; Electric range; Refrigerator; Microwave
- Flooring: Tile flooring; Wood flooring
- Bathrooms: 1 full bathroom
- Heating & cooling: Heat pump heating (has heating)
- Interior features: Gas log fireplace in the living room (2 fireplaces total)
- Laundry & utility: Main level laundry room with washer hookup; Electric water heater
Neighborhood map
What this means for you Summary
Snapshot
- This is a 3-bed/1.0-bath single-family listed at $190k.
Deal economics
- At list price, monthly cash flow is $12 ($140/yr) — positive.
- The deal already cash-flows at list — no discount required.
- To meet the 1% rule (rent ≥ 1% of price), the offer needs to be $146k (23.2% below list).
- Recommended offer: $146k (23.2% below list) — sets the bar for 1% rule.
- Cap rate 6.4% vs local median 4.0% in Lynchburg — top-decile yield for the area; either an underpriced asset or a hidden risk that comps aren't pricing in. Stress-test before assuming the spread holds.
Location & tenants
- Location reads 91/100 on livability (#1 in VA, #58 nationally) — a professional / high-income tenant draw. Strengths: amenities A+, commute A+, cost of living A+; Watch: crime C-, employment D+.
- Lynchburg City Public School District (urban): math 36% / reading 61% proficiency, ranked #104 of 131 in VA (top 79%) — families likely to look elsewhere, expect single-tenant / working-renter base with shorter leases; 61% free/reduced lunch — lower-income household profile, screen leases tightly.
- Zoned schools: Sandusky Elementary (math 47% / reading 67%, grade C+, #597 of 1,108 statewide, top 57%, 352 students, 91% FRL); Sandusky Middle (math 29% / reading 52%, grade F, #303 of 342 statewide, top 89%, 568 students, 96% FRL); Heritage High (math 32% / reading 77%, grade C-, #281 of 319 statewide, top 90%, 1,073 students, 94% FRL) — zoned schools average 94% FRL vs 61% district-wide (33 pts higher); higher-poverty schools than district average — tighter screening recommended.
- Market conditions: Rents rising fast (+4.6%/yr); 111 active listings in the ZIP; 35 comparable units currently listed for rent nearby; rentals at typical pace (median 23d on market — plan ~3-4 weeks tenant-placement turnaround); 40% of comp listings sitting > 30 days — soft ceiling on asking rent; 472 units permitted in Lynchburg city in 2024 (240 in 5+ unit buildings).
- This rent runs 33% of the median local income ($53k/yr) — at the standard rent-burdened threshold; future hikes will face affordability resistance.
Forward outlook
- Local home prices are declining (-3.0%/yr); year-one equity from $1k of loan paydown is wiped out by about $6k of value loss. Plan a longer hold.
- Lynchburg County population projected at +37% by 2050 — long-run rental-demand tailwind backs the buy-and-hold thesis.
Negotiation context
- Only 3 days on market — expect competitive offers; lowballing is unlikely to land.
- Current owner paid $93k; list at $190k implies a 104% gain — meaningful room to come down on a strong offer.
Risks & watch-outs
- Watch-outs: built in 1900 — expect roof / HVAC / electrical / plumbing capex.
- Climate carrying-cost: extreme-heat days projected 7→18/yr by 2055 (HVAC capex compounding) — expect insurance premiums to compound above CPI over the hold.
Questions for the listing agent
- Built in 1900 — when were the roof, HVAC, electrical panel, plumbing, and water heater last replaced?
- Is there a deadline driving the sale (1031 exchange, divorce, estate, relocation)? That informs how much negotiation room exists.
- Schools are A-rated — typically a magnet for longer-tenancy family renters. What's the average tenant stay here, and is there a school-zone premium baked into asking?
- The area grade is low — what's the realistic commute time and amenity access for the typical tenant pool here? Any planned neighborhood developments (good or bad) we should know about?
- What's the average days-on-market for RENTAL listings here right now (not sales)? A rising rental-DOM trend means longer vacancies and softer asking-rent achievability than the comps imply.
- What's the recent tenant-quality profile in this submarket — average credit score on applications, eviction rate, late-payment / NSF rate, and stable-employment percentage? A property-management company in the area should have these aggregated.
- How much new for-sale + rental construction is in the pipeline within 1–3 miles? Heavy new supply typically softens prices + rents 12–24 months out; constrained supply supports both.
Investment metrics
- 1% rule
- 0.77% ✗
- Cap rate
- 6.37%
- Cash-on-cash
- 0.26%
- DSCR
- 1.01
- GRM
- 10.8
CMA / ARV
- ARV (on-the-fly)
- $127,866
- Comps found
- 12
Show comp detail 12 sales within ~0.75 mi
| Address | Dist | Beds/Ba | Sqft | Sold | Price | $/sf | Match |
|---|---|---|---|---|---|---|---|
| 1113 18th St | 0.16mi | 3/2.0 | 1,283 (+1%) | 4mo | $54,500 | $42 | 83 |
| 1027 Knight St | 0.12mi | 3/1.0 | 1,387 (+10%) | 6mo | $95,000 | $68 | 74 |
| 2228 High St | 0.40mi | 2/1.0 (-1) | 1,233 (-3%) | 2mo | $21,500 | $17 | 70 |
| 1800 Floyd St | 0.30mi | 3/1.0 | 1,370 (+8%) | 3mo | $190,000 | $139 | 70 |
| 1930 Vine Street St | 0.12mi | 3/2.0 | 1,110 (-12%) | 6mo | $112,000 | $101 | 66 |
| 1114 Knight St | 0.16mi | 3/2.0 | 1,085 (-14%) | 0mo | $43,600 | $40 | 64 |
| 1205 Fillmore St | 0.55mi | 3/1.0 | 1,370 (+8%) | 3mo | $47,500 | $35 | 58 |
| 1417 Floyd St | 0.40mi | 3/2.0 | 1,120 (-12%) | 1mo | $203,500 | $182 | 57 |
| 1732 Otey St | 0.62mi | 3/2.0 | 1,176 (-7%) | 6mo | $90,000 | $77 | 51 |
| 1310 9th St St | 0.67mi | 3/1.5 | 1,138 (-10%) | 2mo | $185,000 | $163 | 48 |
| 906 8th Street St | 0.68mi | 3/1.5 | 1,132 (-11%) | 4mo | $135,000 | $119 | 45 |
| 129 Jubilee Dr | 0.73mi | 4/1.0 (+1) | 1,108 (-12%) | 5mo | $117,000 | $106 | 36 |
Match score weights: distance 35% · size 25% · config 20% · recency 20%. Top-matched comps best support the ARV.
Projected returns pro-forma
-3.0% appreciation · 4.56% rent growth · sell at horizon
- IRR
- -14.4%
- Equity multiple
- 0.48×
- Total profit
- $-27,784
- Equity at exit
- $28,315
- IRR
- -3.7%
- Equity multiple
- 0.74×
- Total profit
- $-13,718
- Equity at exit
- $16,419
Cash invested: $53,172 (down + closing). Projections, not guarantees.
Landlord ↔ Tenant lean methodology
- Overall (STATE)
- 55 Moderately Landlord-Leaning
- State Virginia
- 55 Moderately Landlord-Leaning · D+2
- County
- — inherits STATE
- City
- — inherits STATE
ZIP-level market 24504
- Home prices YoY
- -12.7%
- Rents YoY
- 4.6%
- Active inventory
- 111
- Price-to-rent
- 10.8×
Monthly cashflow live
- Estimated rent
- $1,459 high interval (Pro) →
- Mortgage (P&I)
- −$996
- Tax from tax record
- −$66 /mo · $795/yr
- Insurance
- −$79
- HOA
- −$0
- Vacancy / Maint / Mgmt
- −$306
- Net cashflow
- $12
Break-even live
Sensitivity live
| Price | -10% $119 | -5% $65 | +0% $12 | +5% $-42 | +10% $-96 |
|---|---|---|---|---|---|
| Rent | -10% $-104 | -5% $-46 | +0% $12 | +5% $69 | +10% $127 |
| Rate | -1.0pp $107 | -0.5pp $60 | base $12 | +0.5pp $-38 | +1.0pp $-88 |
UW: 25.0% down · 7.5% · 30yr · 1.5% tax · 5.0% vac · 8.0% maint · 8.0% mgmt
Financing live
Cash to close
- Down payment
- $47,475
- Closing costs
- $5,697
- Reserves months
- —
- Total cash needed
- —
Loan-product check · same deal, 3 products live
Conventional
25% down · 7.5% · 30yr
- Down + closing
- —
- Monthly P&I
- —
- Monthly cashflow
- —
- DSCR
- —
- Eligible?
- —
Personal DTI + credit; lowest rate.
DSCR
20% down · 8.5% · 30yr
- Down + closing
- —
- Monthly P&I
- —
- Monthly cashflow
- —
- DSCR
- —
- Eligible?
- —
No personal income docs; deal must DSCR.
Hard money
10% down · 12.0% · 12mo
- Down + closing
- —
- Monthly P&I
- —
- Monthly cashflow
- —
- DSCR
- —
- Eligible?
- —
Short-term bridge; refi at stabilization.
Rent comps 35 comps
| Address | Beds | Baths | Sqft | Rent | $/sqft | DOM | Units | Dist |
|---|---|---|---|---|---|---|---|---|
| 1521 Taylor St Lynchburg, VA | 3.0 | 1.0 | 1337 | $1,195 | $0.89 | 22d | 1 | 0.26mi |
| 1308 16th St Lynchburg, VA | 3.0 | 2.0 | 1380 | $1,800 | $1.30 | 15d | 1 | 0.30mi |
| 1316 Harrison St Lynchburg, VA | 3.0 | 1.5 | 1535 | $1,500 | $0.98 | 45d | 1 | 0.33mi |
| 1518 Fillmore St Lynchburg, VA | 3.0 | 2.5 | 1560 | $1,800 | $1.15 | 15d | 1 | 0.40mi |
| 1514 Fillmore St Lynchburg, VA | 3.0 | 2.5 | 1560 | $1,800 | $1.15 | 15d | 1 | 0.40mi |
| 1415 Floyd St Lynchburg, VA | 3.0 | 2.0 | 1300 | $1,800 | $1.38 | 22d | 1 | 0.41mi |
| 1500 Main St Lynchburg, VA | 1.0–2.0 | 1.0 | 1182 | $1,600 | $1.35 | 15d | 6 | 0.46mi |
| 1219 Pierce St Unit 1221 Lynchburg, VA | 2.0 | 1.0 | 1168 | $825 | $0.71 | 15d | 1 | 0.58mi |
| 1105 Fillmore St Unit B Lynchburg, VA | 3.0 | 1.0 | 1300 | $1,250 | $0.96 | 45d | 1 | 0.61mi |
| 900 Polk St Unit A Lynchburg, VA | 3.0 | 1.0 | 1100 | $895 | $0.81 | 15d | 1 | 0.62mi |
| 1106 Pierce St Lynchburg, VA | 3.0 | 2.0 | 1018 | $875 | $0.86 | 22d | 1 | 0.63mi |
| 812 Taylor St Lynchburg, VA | 3.0 | 2.0 | 1872 | $1,950 | $1.04 | 15d | 1 | 0.68mi |
| 1401 Kemper St Lynchburg, VA | 2.0–3.0 | 2.0 | 1118 | $1,167 | $1.04 | 22d | 6 | 0.68mi |
| 1008 8th St Lynchburg, VA | 3.0 | 2.0 | 1316 | $1,795 | $1.36 | 22d | 1 | 0.69mi |
| 801 Church St Unit 8 Lynchburg, VA | 2.0 | 2.0 | 875 | $1,850 | $2.11 | 15d | 1 | 0.77mi |
| 800 Pierce St Lynchburg, VA | 4.0 | 1.0 | 1714 | $1,295 | $0.76 | 45d | 1 | 0.81mi |
| 601 Jackson St Lynchburg, VA | 3.0 | 2.0 | 1138 | $1,595 | $1.40 | 45d | 1 | 0.82mi |
| 512 Polk St Lynchburg, VA | 3.0 | 1.0 | 1340 | $1,295 | $0.97 | 22d | 1 | 0.87mi |
| 612 Commerce St Lynchburg, VA | 1.0–2.0 | 1.0–2.0 | 716 | $1,250 | $1.74 | 15d | 2 | 0.93mi |
| 2269 Aragon St Lynchburg, VA | 3.0 | 2.0 | 1200 | $1,695 | $1.41 | 45d | 1 | 0.95mi |
| 2336 Aragon St Lynchburg, VA | 2.0 | 1.0 | 1042 | $995 | $0.95 | 15d | 1 | 0.98mi |
| 710 Grady St Unit B Lynchburg, VA | 2.0 | 1.0 | 1872 | $795 | $0.42 | 15d | 1 | 0.99mi |
| 317 Polk St Lynchburg, VA | 3.0 | 2.0 | 925 | $1,650 | $1.78 | 45d | 1 | 1.00mi |
| 2518 Carter St Lynchburg, VA | 3.0 | 2.0 | 1091 | $1,500 | $1.37 | 45d | 1 | 1.05mi |
| 1625 Shaffer St Lynchburg, VA | 2.0 | 1.0 | 895 | $850 | $0.95 | 45d | 1 | 1.12mi |
| 403 Grove St Lynchburg, VA | 3.0 | 2.0 | 1400 | $1,600 | $1.14 | 45d | 1 | 1.16mi |
| 317 Grove St Unit A Lynchburg, VA | 2.0 | 1.0 | 900 | $895 | $0.99 | 45d | 1 | 1.19mi |
| 318 Wadsworth St Lynchburg, VA | 3.0 | 1.0 | 943 | $995 | $1.06 | 22d | 1 | 1.21mi |
| 2734 Fort Ave Lynchburg, VA | 1.0–2.0 | 1.0–2.0 | 875 | $1,450 | $1.66 | 45d | 1 | 1.22mi |
| 630 Park Ln Lynchburg, VA | 4.0 | 1.5 | 1434 | $1,895 | $1.32 | 15d | 1 | 1.25mi |
| 209 Munford St Lynchburg, VA | 3.0 | 2.5 | 1420 | $1,497 | $1.05 | 46d | 1 | 1.29mi |
| 1705 1st St Unit A Lynchburg, VA | 2.0 | 1.0 | 1100 | $1,395 | $1.27 | 22d | 1 | 1.30mi |
| 320 Kenyon St Lynchburg, VA | 3.0 | 2.0 | 1736 | $1,595 | $0.92 | 45d | 1 | 1.31mi |
| 216 Kenyon St Lynchburg, VA | 2.0 | 1.0 | 1114 | $995 | $0.89 | 45d | 1 | 1.40mi |
| 507 Victoria Ave Unit 507 Lynchburg, VA | 4.0 | 2.0 | 1480 | $1,700 | $1.15 | 22d | 1 | 1.41mi |
Listing history 7 events
-
2026-05-31status $189,900 Pending 3 DOM
-
2026-05-30days on market $189,900 Active 3 DOM
-
2026-05-27$189,900 Active
-
2011-08-26soldstatus $93,157
-
2004-11-22soldstatus $50,000
-
1995-12-06soldstatus $19,000
-
1991-08-23soldstatus $20,000
ⓘ Source: listings_history table (triggers on properties + properties_extension) + one-shot
backfill from property_details.listing_events for pre-trigger history.
Tax reassessment forecast VA · Resets to sale price
- Current annual tax
- $795 · $66/mo
- Projected year-2 tax
- $1,557 · $130/mo
- Expected delta
- +$763/yr (+$64/mo · 96.0%)
ⓘ Screening estimate from a state-policy table — verify with the county assessor before closing.
Climate risk First Street
- Flood 1/10 Low FEMA zone X (unshaded) · 0% chance over 30 yrs
- Wildfire 3/10 Moderate
- Heat 6/10 Major 7 d/yr ≥102°F today · 18 d/yr by 30 yrs out
- Wind 2/10 Low 3% chance of damaging wind over 30 yrs
- Air quality 2/10 Low 0 unhealthy d/yr today · 1 by 30 yrs out
Nearby sold comps map
Loading sold comps map…
Walkable amenities ~0.75 mi
Loading nearby amenities…
Taxation est. · year 1
- Rental income
- $17,512
- − Mortgage interest
- −$10,637
- − Property taxes
- −$795
- − Insurance
- −$950
- − Repairs & maintenance
- −$1,401
- − Management
- −$1,401
- − Depreciation
- −$5,524
- Taxable loss
- −$3,195
- Est. tax savings @ 24.0%
- +$767
- After-tax cash flow
- $907/yr
For passive investors: Depreciation is non-cash, so a rental often shows a tax loss while cash-flowing — sheltering income. Rental losses are passive: they offset passive income freely, and up to $25,000/yr can offset ordinary (W-2) income if you actively participate and your MAGI is under $100k (phasing out to $0 by $150k); unused losses carry forward. On sale, claimed depreciation is recaptured at up to 25%, and gains may owe capital-gains tax (a 1031 exchange can defer both). Figures are a year-1 estimate at your 24.0% rate — not tax advice; consult a CPA.
Schools (NCES district)
- District
- Lynchburg City Public School District
- NCES district ID
- 5102340
- Math proficiency
- 36% ▼ -38.00%
- Reading proficiency
- 61% ▼ -8.00%
- Median HH income
- $39,097
- Composite
- 40.4/100
- National rank
- #3730
- State rank
- #104 of 131 in VA
Livability — Lynchburg
- Score
- 91/100
- State rank
- #1
- US rank
- #58
Category grades
Schools grade is shown separately in the Schools card above.
Census & demographics
- Census place
- Lynchburg, VA
- County
- Lynchburg City · 97,036 people
- City population
- 97,036
- Metro
- Lynchburg, VA
- Population (ZIP)
- 9,632
- Household income
- $52,571
- Rent vs Own
- Severe rent burden
- 552.0
Population outlook (Lynchburg County) Hauer SSP2
- Today (2025)
- 87,977 people
- By 2030
- 93,626 · +6.4%
- By 2040
- 106,145 · +20.7%
- By 2050
- 120,783 · +37.3%
- By 2075
- 162,249 · +84.4%
- By 2100
- 191,358 · +117.5%
Race, ethnicity, and origin ACS 2023
- Neighborhood character
- Diverse neighborhood (Simpson 0.57)
- Race & ethnicity
- White 51% Black 40% Two or more races 6% Hispanic / Latino 4%
- Common ancestry
- Italian 3% Lithuanian 1% Serbian 1%
- Foreign-born
- 4% · Canada, China
- Languages at home
- 95% English-only · Spanish 3% Chinese 1%
Political lean MEDSL · Lynchburg
- 2024 margin
- Lean R (+7.9) · D 45.4% · R 53.3% · Other 1.3%
- 2008→2024 swing
- -3.9pp toward R · 2008: -4.0pp · 2024: -7.9pp
- All cycles
- 2024: R+7.9 2020: D+2.6 2016: R+9.0 2012: R+10.6 2008: R+4.0
Not yet ingested
- Civics
- —
Market trends
- HPI YoY
- ▼ -33.39%
- Current HPI
- 229.4423
- Rent YoY
- ▲ 4.56%
- Metro
- Lynchburg, VA
- State GDP YoY
- ▲ 2.40%
- F500 in state
- 50
Industry mix (Fortune 500 HQ in VA)
| Industry | F500 HQs | Revenue |
|---|---|---|
| Aerospace / Defense | 4 | $236B |
|
||
| Technology / Defense | 3 | $32B |
|
||
| Financial Services | 2 | $176B |
|
||
| Utilities | 2 | $27B |
|
||
| Insurance | 2 | $25B |
|
||
| Technology | 2 | $15B |
|
||
Price history
+849.5% since first listed5 events — show timeline
- 2026-05-27 Listed $189,900 LMLS
- 2011-08-26 Sold (Public Records) $93,157 Public Records
- 2004-11-22 Sold (Public Records) $50,000 Public Records
- 1995-12-06 Sold (Public Records) $19,000 Public Records
- 1991-08-23 Sold (Public Records) $20,000 Public Records
Property tax history
+9.1%/yrLatest (2025): $795 · +97.1% YoY. Source: county tax records.
Cash-flow waterfall
monthlySold comps — $/sqft
last 12 mo · ≤1 miLoading sold comps…